
Houses for sale in Wrecsam - Wrexham, Wales
House Prices in Wrecsam - Wrexham
Properties in Wrecsam - Wrexham have
an average house price of
£211k
and had 4,822 Property Transactions
within the last 3 years.¹
Wrecsam - Wrexham is a location in
Wales with
57,980 households², where the most expensive property was sold for £1.45M.
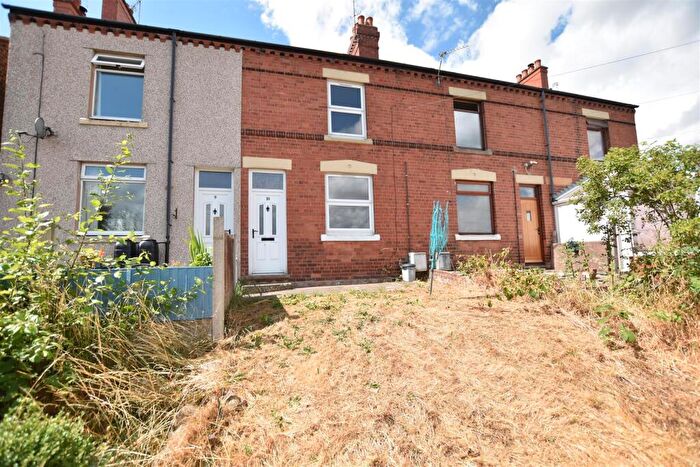
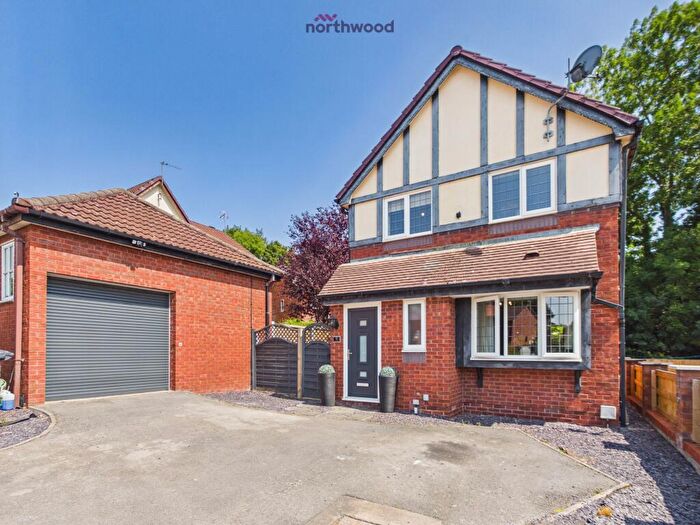
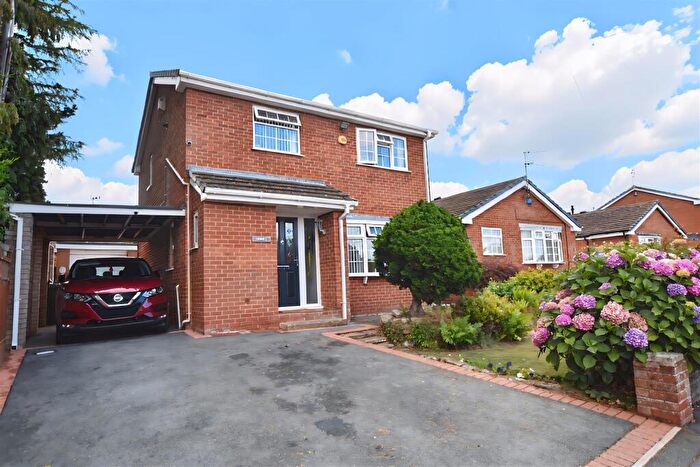
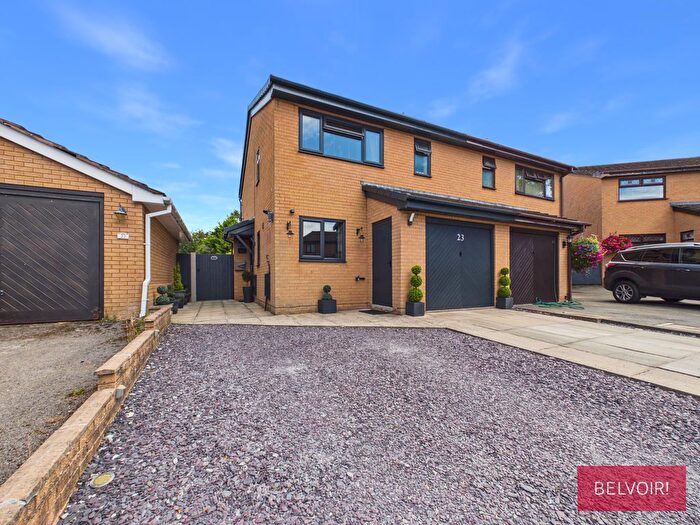
Properties for sale in Wrecsam - Wrexham
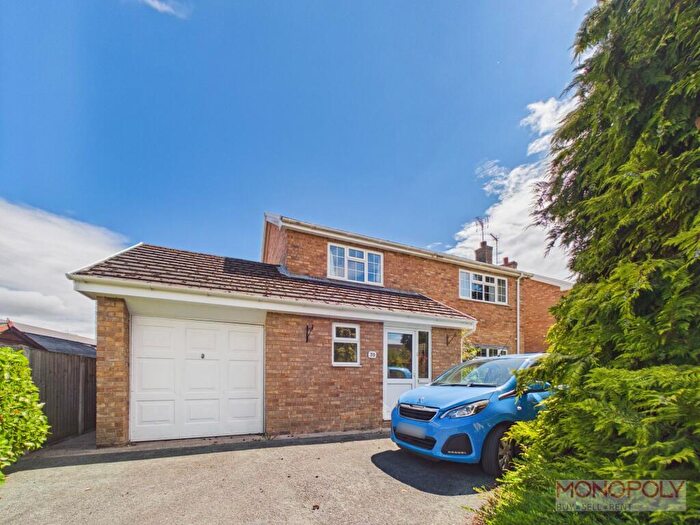


![]()
If you are looking to sell your house, let it out, or receive a property valuation, an expert can help you.
Click the button below to get started.


Towns in Wrecsam - Wrexham
Navigate through our locations to find the location of your next house in Wrecsam - Wrexham, Wales for sale or to rent.
Property price trends in Wrecsam - Wrexham
According to the latest Land Registry data, the average home in Wrecsam - Wrexham sold for £217,396 in 2026. That figure comes from a substantial record of 55,326 sales logged over the past 31 years.
Prices have continued to climb over the last three years. Compared with 2023, when the typical sale came in around £203,786, that's a rise of roughly 6.7%.
Looking back five years, average prices are up about 6.4% since 2021, a gain of around £13,108 in cash terms.
Zoom out to the past decade for the fuller picture. Back in 2016, homes here averaged £163,291, so the typical sold price has climbed about 33.1% since then, roughly 2.9% a year. Stretch the view to fifteen years and that annual pace eases back to about 2.5%.
Frequently asked questions about Wrecsam - Wrexham
What is the average price for a property for sale in Wrecsam - Wrexham?
The average price for a property for sale in Wrecsam - Wrexham is £211,386. This amount is 8% lower than the average price in Wales. There are more than 10,000 property listings for sale in Wrecsam - Wrexham.
What locations have the most expensive properties for sale in Wrecsam - Wrexham?
The locations with the most expensive properties for sale in Wrecsam - Wrexham are Malpas at an average of £556,666 and Whitchurch at an average of £357,808.
What locations have the most affordable properties for sale in Wrecsam - Wrexham?
The locations with the most affordable properties for sale in Wrecsam - Wrexham are Wrexham at an average of £207,339 and Llangollen at an average of £239,224.
Which train stations are available in or near Wrecsam - Wrexham?
Some of the train stations available in or near Wrecsam - Wrexham are Wrexham Central, Wrexham General and Gwersyllt.
Property Price Paid in Wrecsam - Wrexham by Year
The average sold property price by year was:
| Year | Average Sold Price | Price Change |
Sold Properties
|
|---|---|---|---|
| 2026 | £217,396 | -1% |
310 Properties |
| 2025 | £220,504 | 6% |
1,562 Properties |
| 2024 | £207,894 | 2% |
1,537 Properties |
| 2023 | £203,786 | -5% |
1,413 Properties |
| 2022 | £214,629 | 5% |
1,823 Properties |
| 2021 | £204,288 | 13% |
2,166 Properties |
| 2020 | £178,246 | 4% |
1,514 Properties |
| 2019 | £170,392 | -5% |
1,801 Properties |
| 2018 | £178,273 | 6% |
1,838 Properties |
| 2017 | £167,758 | 3% |
1,854 Properties |
Property Price per Property Type in Wrecsam - Wrexham
Here you can find historic sold price data in order to help with your property search.
The average Property Paid Price for specific property types in the last three years are:
| Property Type | Average Sold Price | Sold Properties |
|---|---|---|
| Semi Detached House | £187,514.00 | 1,715 Semi Detached Houses |
| Terraced House | £148,447.00 | 1,247 Terraced Houses |
| Detached House | £314,843.00 | 1,480 Detached Houses |
| Flat | £122,727.00 | 380 Flats |
Transport in Wrecsam - Wrexham
Please see below transportation links in this area:
