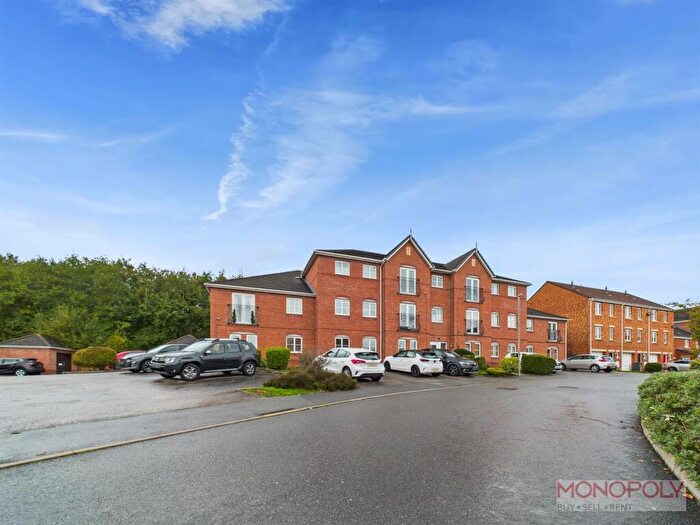
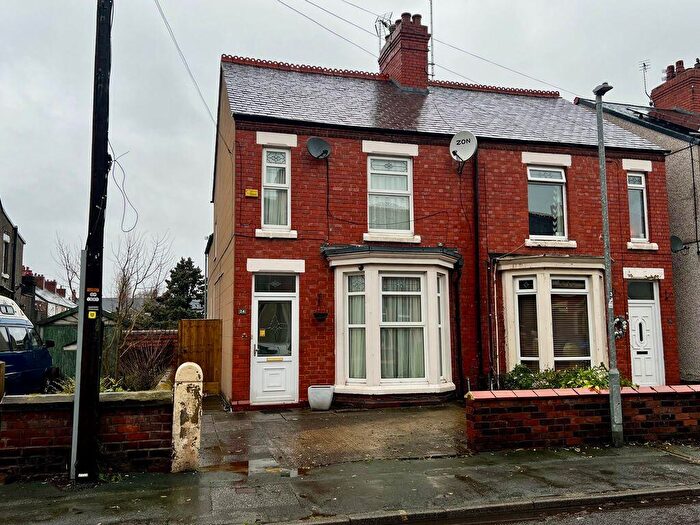
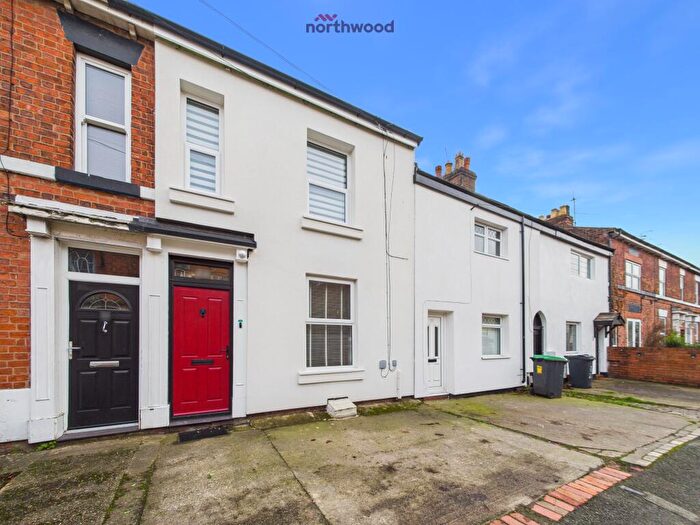
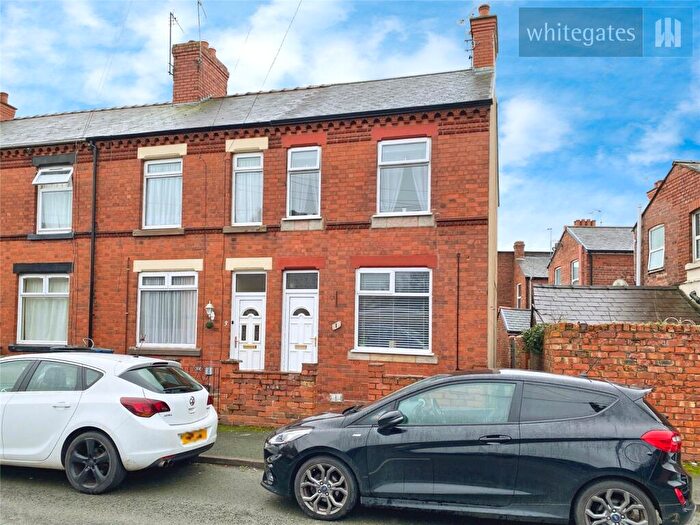
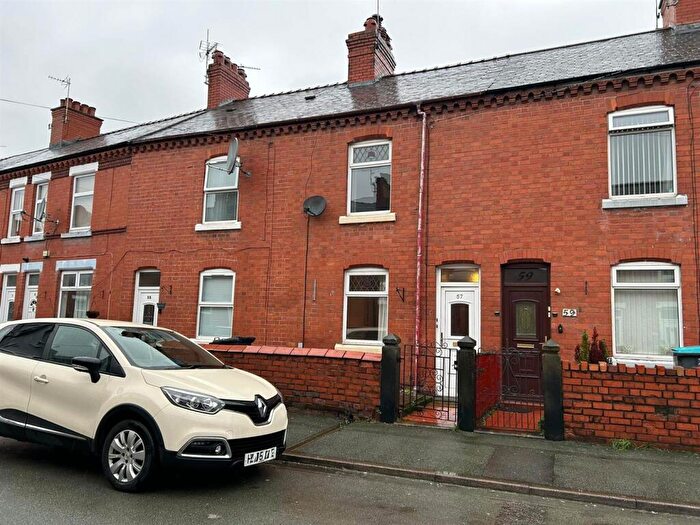
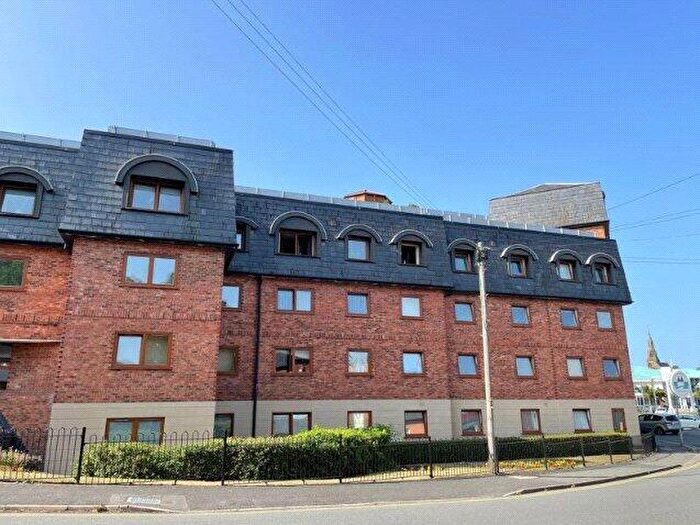
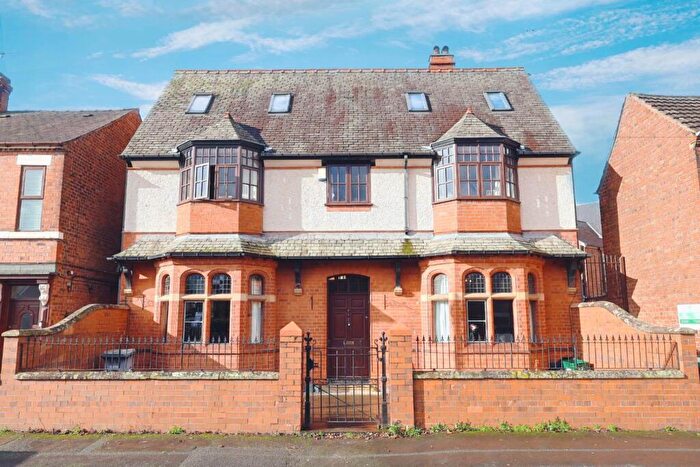
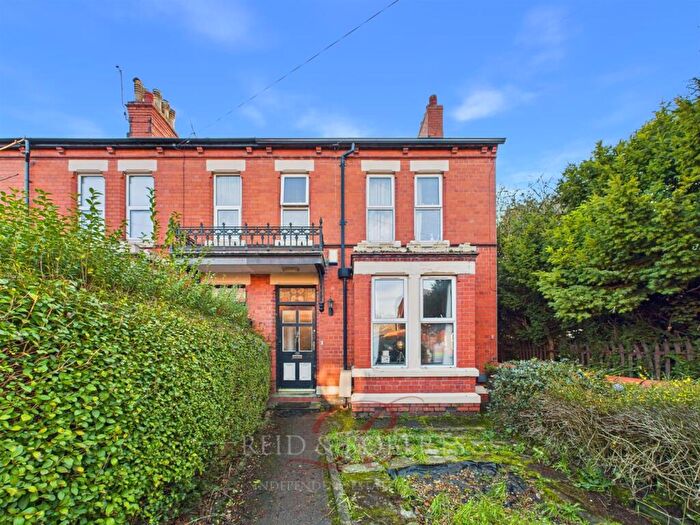
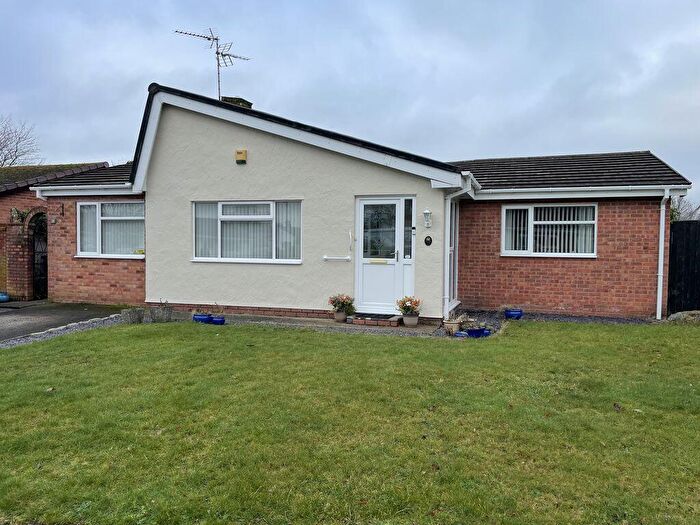
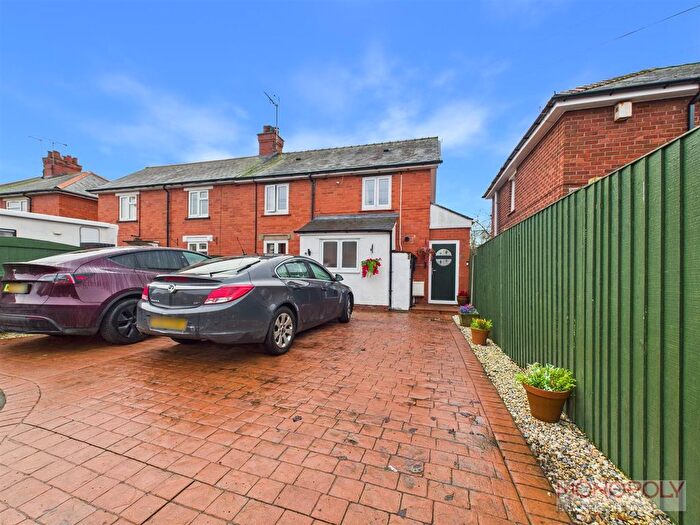
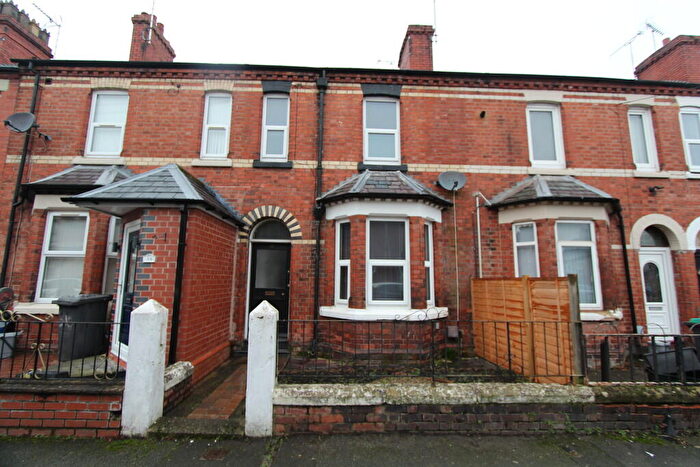
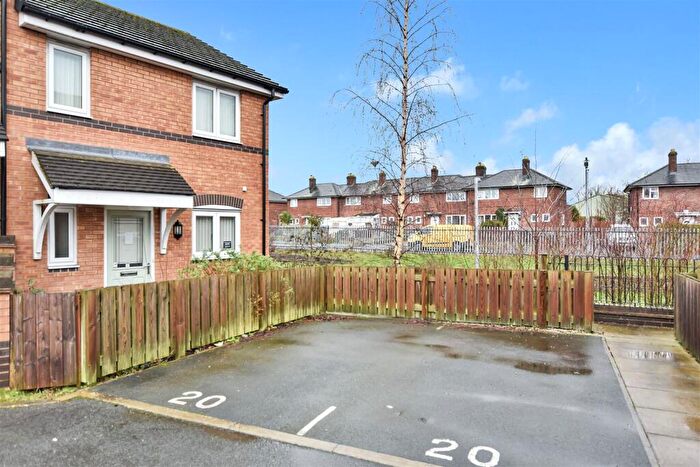
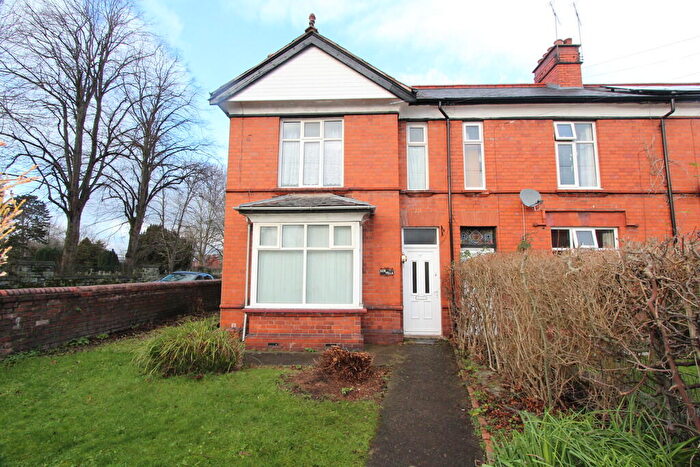
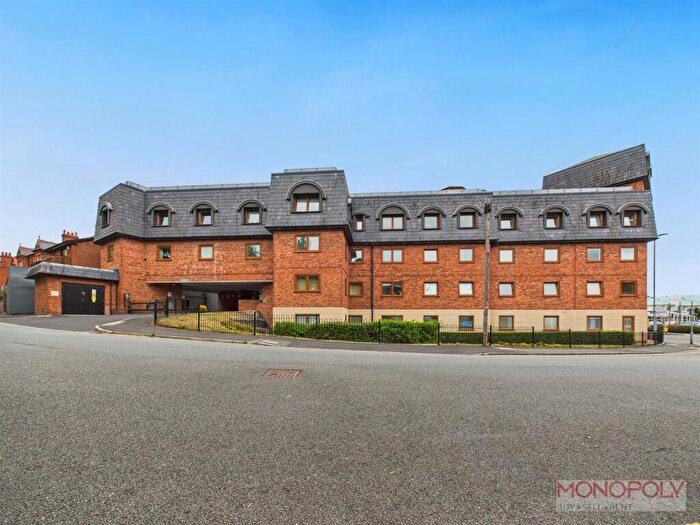
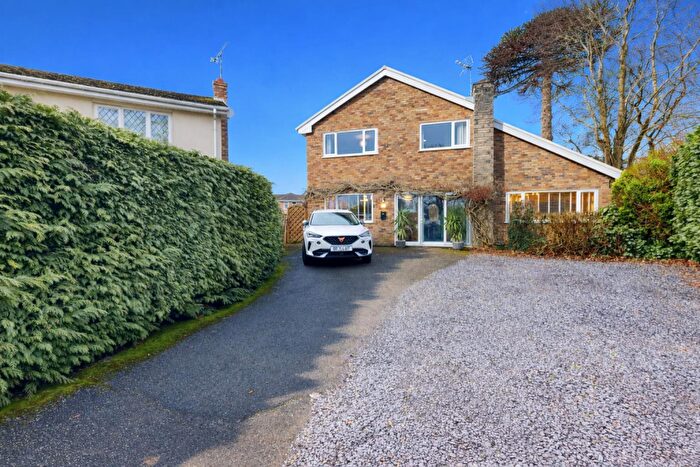
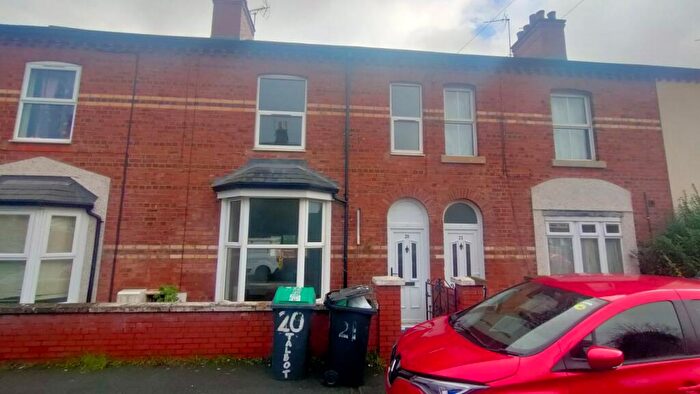
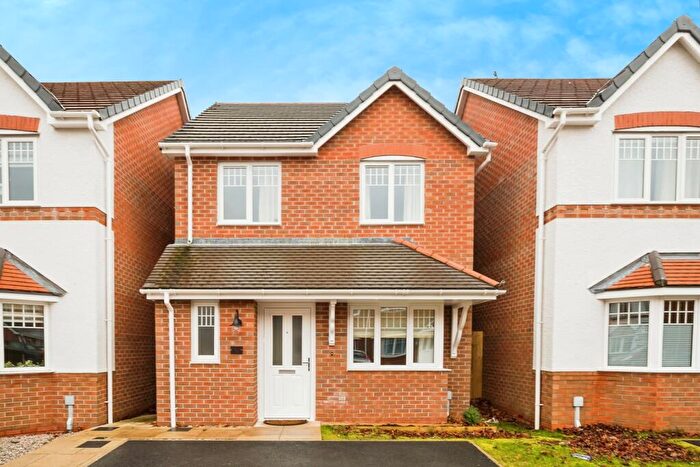
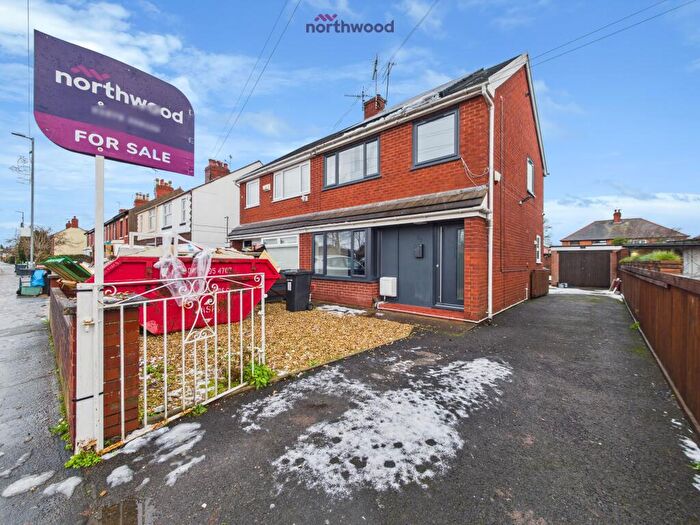
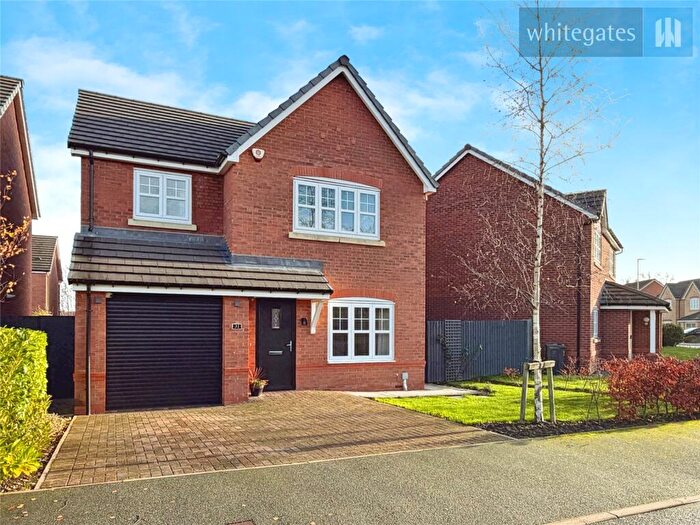
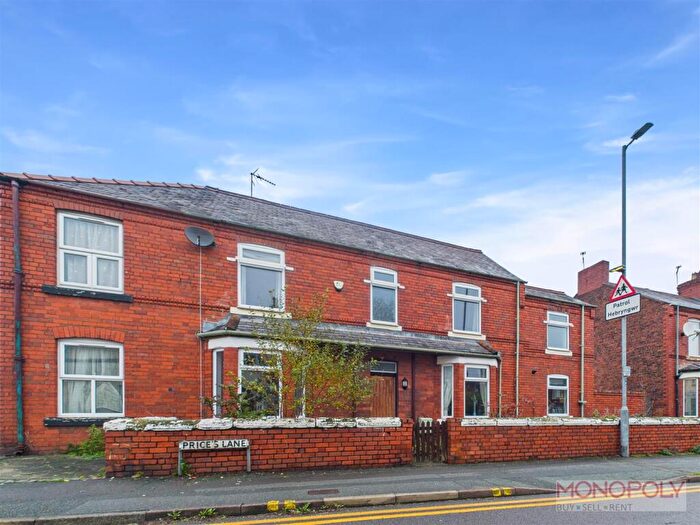
Houses for sale & to rent in Brynyffynnon, Wrexham
House Prices in Brynyffynnon
Properties in Brynyffynnon have an average house price of £161,448.00 and had 170 Property Transactions within the last 3 years¹.
Brynyffynnon is an area in Wrexham, Wrecsam - Wrexham with 1,556 households², where the most expensive property was sold for £340,000.00.
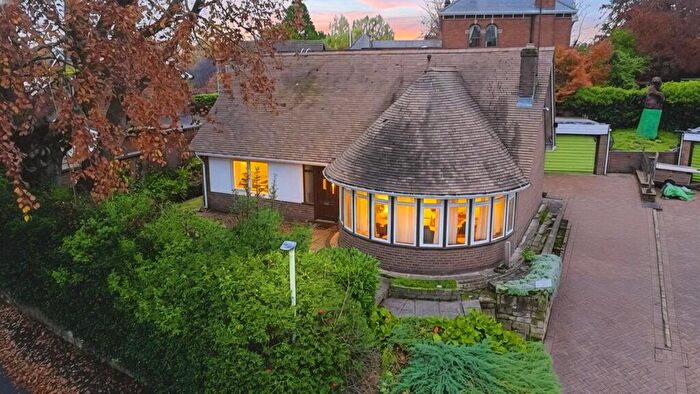
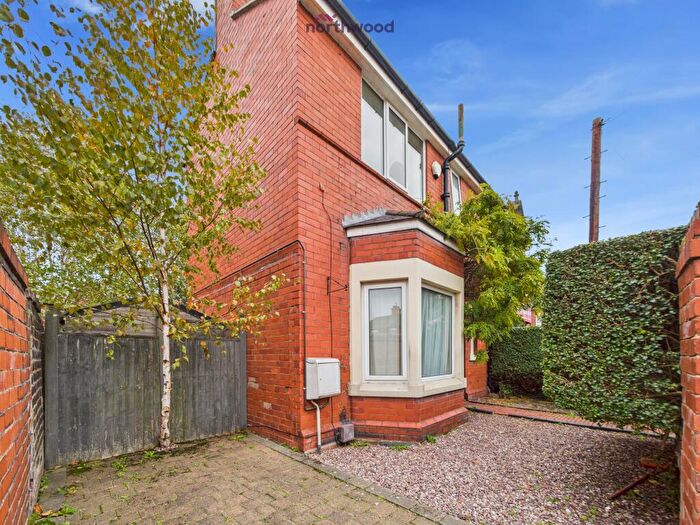
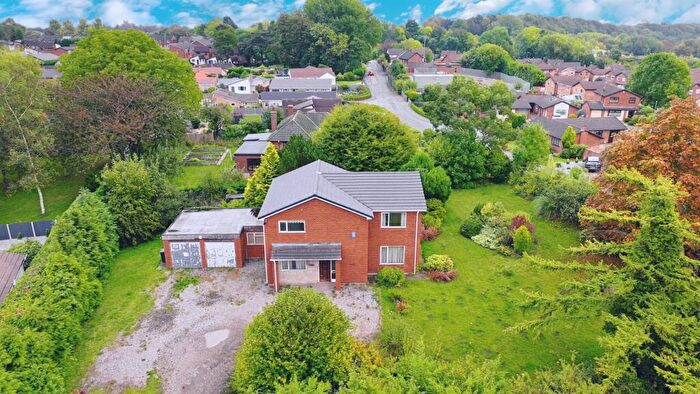
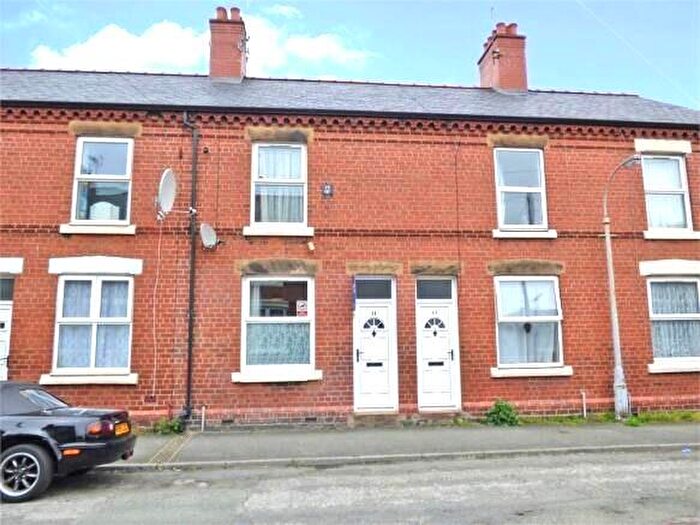
Properties for sale in Brynyffynnon
Roads and Postcodes in Brynyffynnon
Navigate through our locations to find the location of your next house in Brynyffynnon, Wrexham for sale or to rent.
| Streets | Postcodes |
|---|---|
| Abbot Street | LL11 1TA |
| Bellevue Road | LL13 7NH |
| Belvedere Drive | LL11 2BG |
| Berse Road | LL11 2BH LL11 2BL |
| Bersham Road | LL14 4HD |
| Bradley Road | LL13 7TG LL13 7TL LL13 7TP LL13 7SU |
| Brewery Place | LL13 7LU |
| Bright Street | LL13 7TN |
| Bro Deg | LL11 3DL |
| Brook Street | LL13 7LL LL13 7LD |
| Bryn Coch | LL11 3DN |
| Bryn Offa | LL13 7UA LL13 7UD LL13 7UE LL13 7UF LL13 7UL |
| Cae Mawr | LL11 3DH |
| Cobden Road | LL13 7TH |
| Croesnewydd Road | LL11 3BN LL13 7TB LL13 7TJ LL13 7YU LL13 7TX LL13 7TZ |
| Croesnewydd Road Technology Park | LL13 7TD |
| Daisy Bank Close | LL14 4JB |
| Dol Isaf | LL11 3DX |
| Dolydd Road | LL13 7TE LL13 7TF |
| Eglwys Teg | LL11 3BZ |
| Ellice Way | LL13 7YH LL13 7YW |
| Ellice Way Technology Park | LL13 7YT LL13 7YX LL13 7YY |
| Foxwood Drive | LL14 4JA |
| Gibson Street | LL13 7TS |
| Gloucester Drive | LL11 2BE |
| High Ridge Drive | LL14 4JD |
| Hill Street | LL11 1SN |
| Hirwaun | LL11 3EF |
| Homestead Lane | LL14 4HE |
| Hope Street | LL11 1BD LL11 1BG |
| Island Green Shopping Centre | LL13 7LW |
| Jacques Way | LL11 2BY LL11 2DB |
| Jubilee Road | LL13 7NN |
| Lilac Way | LL11 2BB |
| Llys Nantgarw | LL13 7SX LL13 7SZ |
| Llys Y Groes | LL13 7AG |
| Maesgwyn Road | LL11 2AP LL11 2AR |
| Mold Road | LL11 2AE LL11 2AF LL11 2AG LL11 2AD |
| Peel Street | LL13 7TR |
| Pendinas | LL11 3BQ |
| Pierces Square | LL13 7NE |
| Plas Y Ffynnon | LL11 2AY |
| Primrose Way | LL11 2AQ LL11 2AT |
| Priory Street | LL11 1SP LL11 1SU |
| Regent Street | LL11 1PF LL11 1RB LL11 1RN LL11 1RY LL11 1SG |
| Ruthin Road | LL13 7TT LL13 7TU LL11 3BW LL13 7TY |
| St Giles Court | LL13 7NR |
| The Homestead | LL14 4HQ |
| Thornhill Drive | LL14 4JE |
| Town Hill | LL13 8NB |
| Trem Y Llyn | LL11 3BX |
| Union Road | LL13 7SR |
| Vicarage Hill | LL13 7HN |
| Villiers Street | LL13 7TW |
| Watery Road | LL13 7NP LL13 7NW LL13 7SY |
| Watery Road Technology Park | LL13 7NQ LL13 7NT |
| Western Gateway Business Park | LL13 7ZB |
| Windsor Drive | LL11 2BD |
| Wisteria Court | LL11 2AJ |
| Woodberry Close | LL14 4JF |
| Wrexham Technology Park | LL13 7YP |
| Y Werddon | LL13 7LT |
| Yale Business Village | LL13 7YL |
| Yale Park | LL11 2AX |
| Yale Walk | LL11 2AZ |
| LL11 3EZ LL13 7NB LL13 7NX LL13 7NZ LL13 7UB |
Transport near Brynyffynnon
- FAQ
- Price Paid By Year
- Property Type Price
Frequently asked questions about Brynyffynnon
What is the average price for a property for sale in Brynyffynnon?
The average price for a property for sale in Brynyffynnon is £161,448. This amount is 22% lower than the average price in Wrexham. There are 351 property listings for sale in Brynyffynnon.
What streets have the most expensive properties for sale in Brynyffynnon?
The streets with the most expensive properties for sale in Brynyffynnon are The Homestead at an average of £286,666, Llys Y Groes at an average of £265,522 and Thornhill Drive at an average of £262,500.
What streets have the most affordable properties for sale in Brynyffynnon?
The streets with the most affordable properties for sale in Brynyffynnon are Eglwys Teg at an average of £82,500, Villiers Street at an average of £96,250 and Pendinas at an average of £97,850.
Which train stations are available in or near Brynyffynnon?
Some of the train stations available in or near Brynyffynnon are Wrexham Central, Wrexham General and Gwersyllt.
Property Price Paid in Brynyffynnon by Year
The average sold property price by year was:
| Year | Average Sold Price | Price Change |
Sold Properties
|
|---|---|---|---|
| 2025 | £181,088 | 4% |
50 Properties |
| 2024 | £173,489 | 23% |
58 Properties |
| 2023 | £134,346 | -23% |
62 Properties |
| 2022 | £165,465 | 2% |
63 Properties |
| 2021 | £161,780 | 17% |
101 Properties |
| 2020 | £133,762 | 1% |
54 Properties |
| 2019 | £132,303 | -31% |
78 Properties |
| 2018 | £173,872 | 23% |
105 Properties |
| 2017 | £134,660 | 11% |
79 Properties |
| 2016 | £119,588 | -5% |
118 Properties |
| 2015 | £125,577 | -15% |
50 Properties |
| 2014 | £144,029 | 18% |
53 Properties |
| 2013 | £117,784 | -8% |
63 Properties |
| 2012 | £127,159 | -3% |
71 Properties |
| 2011 | £131,326 | 10% |
43 Properties |
| 2010 | £118,583 | -0,3% |
65 Properties |
| 2009 | £118,986 | -20% |
64 Properties |
| 2008 | £143,089 | 4% |
40 Properties |
| 2007 | £137,688 | 2% |
99 Properties |
| 2006 | £134,766 | 21% |
123 Properties |
| 2005 | £106,580 | 4% |
42 Properties |
| 2004 | £102,067 | 12% |
56 Properties |
| 2003 | £89,742 | 29% |
75 Properties |
| 2002 | £63,382 | 16% |
72 Properties |
| 2001 | £53,529 | -3% |
69 Properties |
| 2000 | £55,314 | 16% |
87 Properties |
| 1999 | £46,619 | 5% |
73 Properties |
| 1998 | £44,396 | 16% |
57 Properties |
| 1997 | £37,160 | -20% |
56 Properties |
| 1996 | £44,556 | 18% |
29 Properties |
| 1995 | £36,473 | - |
38 Properties |
Property Price per Property Type in Brynyffynnon
Here you can find historic sold price data in order to help with your property search.
The average Property Paid Price for specific property types in the last three years are:
| Property Type | Average Sold Price | Sold Properties |
|---|---|---|
| Semi Detached House | £185,227.00 | 36 Semi Detached Houses |
| Detached House | £273,855.00 | 28 Detached Houses |
| Terraced House | £137,210.00 | 60 Terraced Houses |
| Flat | £106,032.00 | 46 Flats |

