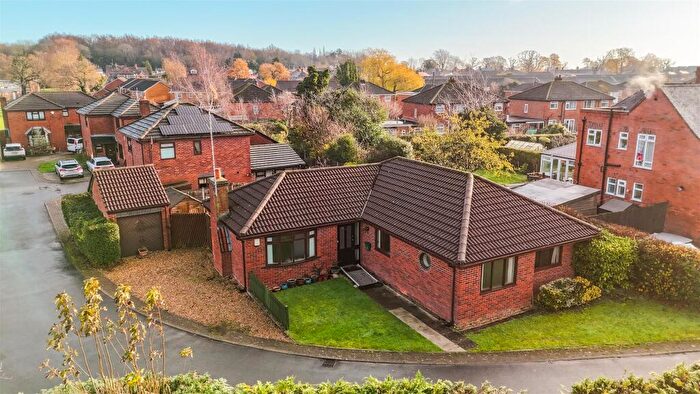
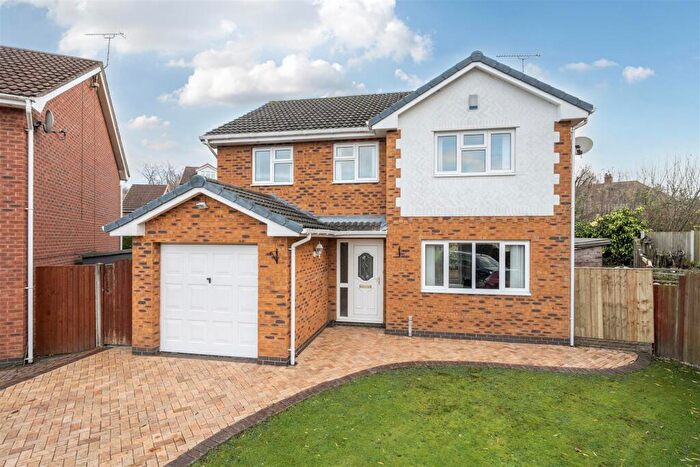
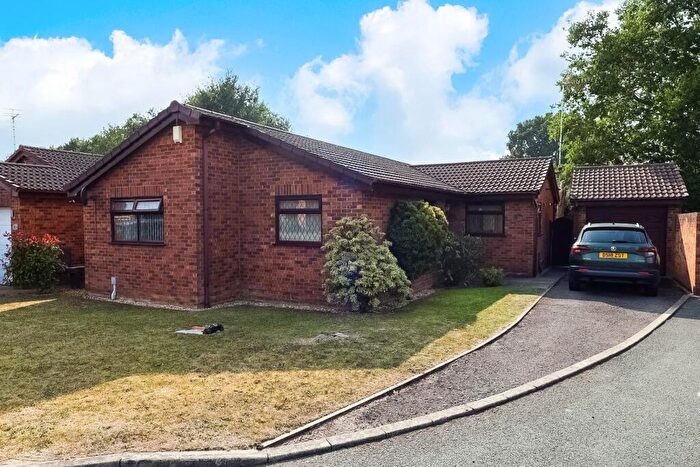
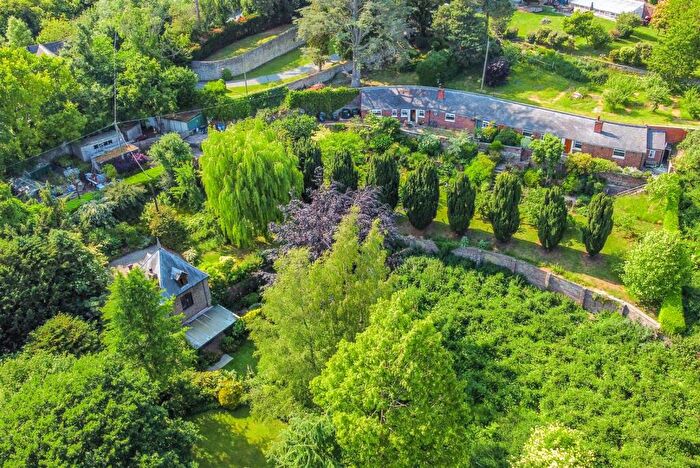
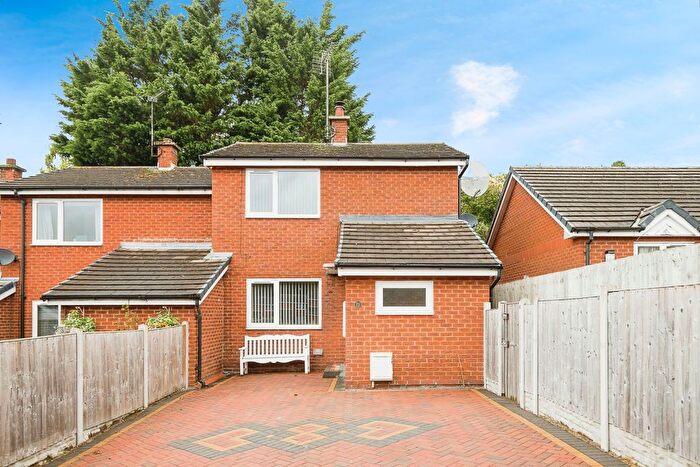
Houses for sale & to rent in Chirk North, Wrexham
House Prices in Chirk North
Properties in Chirk North have an average house price of £209,897.00 and had 62 Property Transactions within the last 3 years¹.
Chirk North is an area in Wrexham, Wrecsam - Wrexham with 1,056 households², where the most expensive property was sold for £590,000.00.
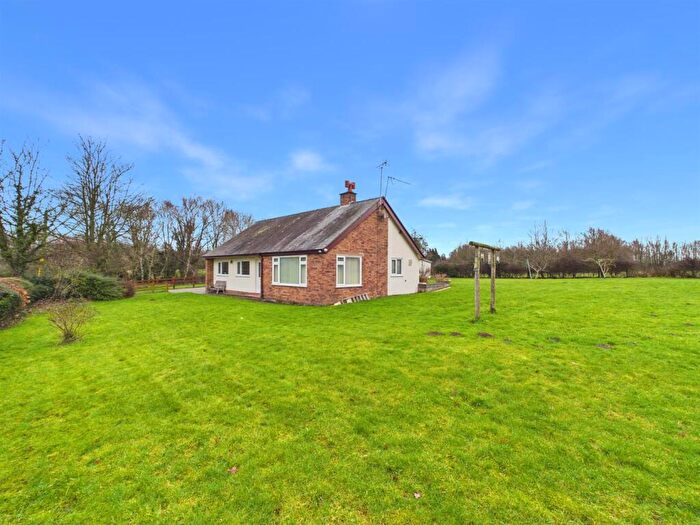
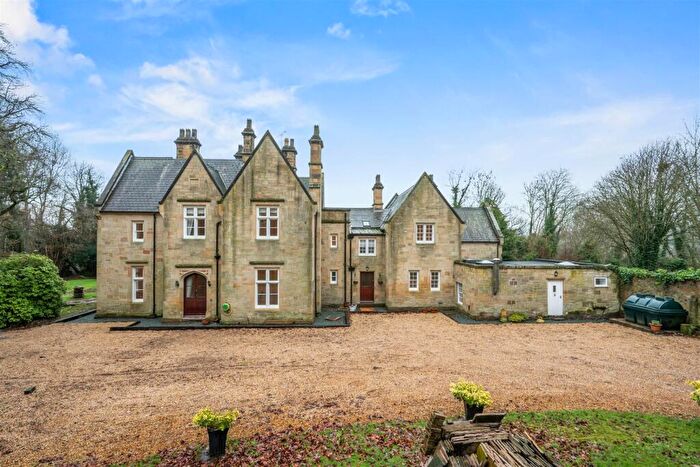
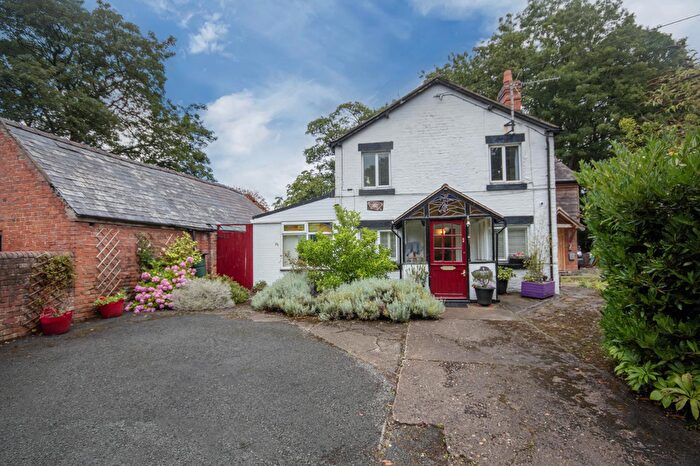
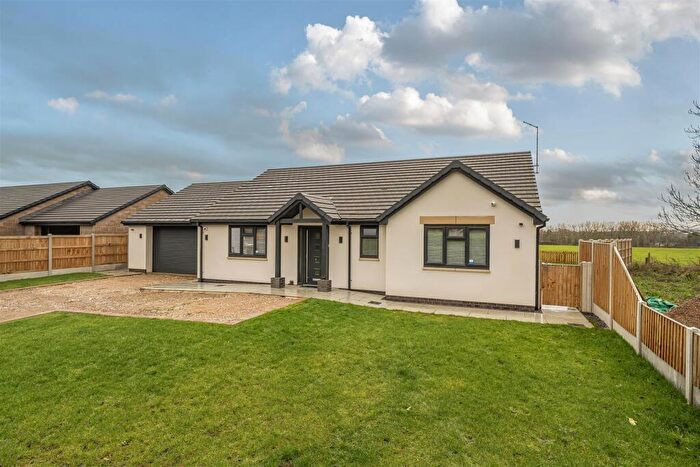
Properties for sale in Chirk North
Previously listed properties in Chirk North
Roads and Postcodes in Chirk North
Navigate through our locations to find the location of your next house in Chirk North, Wrexham for sale or to rent.
| Streets | Postcodes |
|---|---|
| Ash Grove | LL14 5RF |
| Black Park | LL14 5AU LL14 5BA LL14 5AX |
| Chapel Lane | LL14 5NG |
| Charles Street | LL14 5HT |
| Chirk Park | LL14 5AZ |
| Cilcoed | LL14 5BX |
| Coronation Drive | LL14 5LE LL14 5LF |
| Craig Close | LL14 5NY |
| Crogen | LL14 5BJ LL14 5BN |
| Derwen | LL14 5BZ |
| Duke Street | LL14 5LB |
| Ewart Street | LL14 5LA |
| George Street | LL14 5HS |
| Halton | LL14 5BD LL14 5BG |
| Helfa Bach | LL14 5EQ |
| Holyhead Road | LL14 5HF LL14 5HP |
| John Street | LL14 5HY |
| Linden Avenue | LL14 5ER |
| Maes Hyfryd | LL14 5AQ |
| Maes Y Berwyn | LL14 5BE LL14 5RA |
| Maes Y Parc | LL14 5BB |
| New Houses | LL14 5AP |
| Newbridge Road | LL14 3JE |
| North View | LL14 5HU |
| Offa | LL14 5BP LL14 5DJ |
| Pentre | LL14 5AW |
| Penybont | LL14 5AR |
| Princess Avenue | LL14 5LG |
| Richmond Gardens | LL14 5BF |
| South View | LL14 5LD |
| Sycamore Drive | LL14 5RG |
| Upper Wharf | LL14 5HR |
| Walden Crescent | LL14 5LH LL14 5LL |
| Wern | LL14 5BW |
| West View | LL14 5HL LL14 5HN LL14 5HW |
| Whitehurst | LL14 5AS |
| Whitehurst Gardens | LL14 5AT |
| Yr Helfa | LL14 5EP |
| LL14 5AY LL14 5LN |
Transport near Chirk North
- FAQ
- Price Paid By Year
- Property Type Price
Frequently asked questions about Chirk North
What is the average price for a property for sale in Chirk North?
The average price for a property for sale in Chirk North is £209,897. This amount is 1% higher than the average price in Wrexham. There are 140 property listings for sale in Chirk North.
What streets have the most expensive properties for sale in Chirk North?
The streets with the most expensive properties for sale in Chirk North are Black Park at an average of £396,250, Pentre at an average of £373,333 and Maes Y Berwyn at an average of £255,750.
What streets have the most affordable properties for sale in Chirk North?
The streets with the most affordable properties for sale in Chirk North are Linden Avenue at an average of £111,375, George Street at an average of £146,000 and Princess Avenue at an average of £150,000.
Which train stations are available in or near Chirk North?
Some of the train stations available in or near Chirk North are Chirk, Ruabon and Gobowen.
Property Price Paid in Chirk North by Year
The average sold property price by year was:
| Year | Average Sold Price | Price Change |
Sold Properties
|
|---|---|---|---|
| 2025 | £228,705 | 10% |
17 Properties |
| 2024 | £206,562 | 4% |
24 Properties |
| 2023 | £198,483 | -14% |
21 Properties |
| 2022 | £227,151 | 26% |
19 Properties |
| 2021 | £167,796 | 9% |
23 Properties |
| 2020 | £152,093 | -2% |
28 Properties |
| 2019 | £155,624 | 2% |
37 Properties |
| 2018 | £152,968 | 4% |
36 Properties |
| 2017 | £147,082 | 7% |
38 Properties |
| 2016 | £136,951 | 7% |
31 Properties |
| 2015 | £127,065 | -0,5% |
44 Properties |
| 2014 | £127,641 | 5% |
38 Properties |
| 2013 | £120,931 | 13% |
26 Properties |
| 2012 | £105,791 | -19% |
24 Properties |
| 2011 | £125,909 | 9% |
21 Properties |
| 2010 | £114,332 | -6% |
21 Properties |
| 2009 | £121,608 | -16% |
31 Properties |
| 2008 | £140,928 | -9% |
14 Properties |
| 2007 | £154,089 | 15% |
38 Properties |
| 2006 | £131,199 | 4% |
71 Properties |
| 2005 | £125,507 | 7% |
48 Properties |
| 2004 | £116,343 | 26% |
48 Properties |
| 2003 | £86,249 | 26% |
48 Properties |
| 2002 | £64,087 | 19% |
45 Properties |
| 2001 | £51,788 | 0,3% |
41 Properties |
| 2000 | £51,644 | 12% |
42 Properties |
| 1999 | £45,291 | 3% |
55 Properties |
| 1998 | £43,744 | 2% |
48 Properties |
| 1997 | £42,875 | 1% |
40 Properties |
| 1996 | £42,297 | -2% |
37 Properties |
| 1995 | £43,099 | - |
31 Properties |
Property Price per Property Type in Chirk North
Here you can find historic sold price data in order to help with your property search.
The average Property Paid Price for specific property types in the last three years are:
| Property Type | Average Sold Price | Sold Properties |
|---|---|---|
| Semi Detached House | £198,574.00 | 32 Semi Detached Houses |
| Detached House | £252,776.00 | 19 Detached Houses |
| Terraced House | £176,650.00 | 10 Terraced Houses |
| Flat | £90,000.00 | 1 Flat |

