Houses for sale & to rent in Penycae And Ruabon South, Wrexham
House Prices in Penycae And Ruabon South
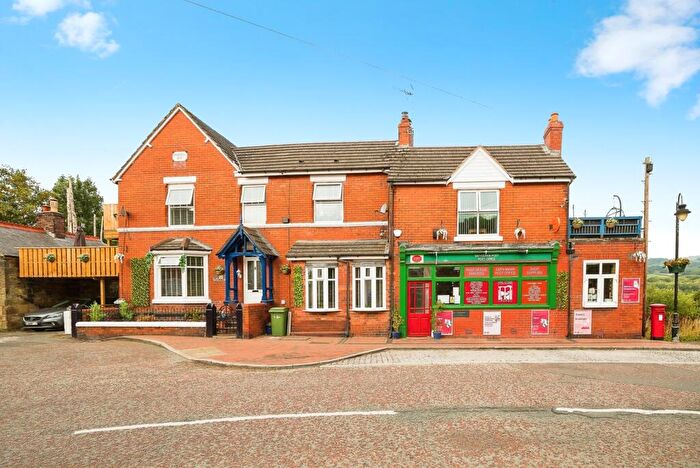
Properties in Penycae And Ruabon South have an average house price of £219,648.00 and had 108 Property Transactions within the last 3 years¹.
Penycae And Ruabon South is an area in Wrexham, Wrecsam - Wrexham with 1,075 households², where the most expensive property was sold for £795,000.00.
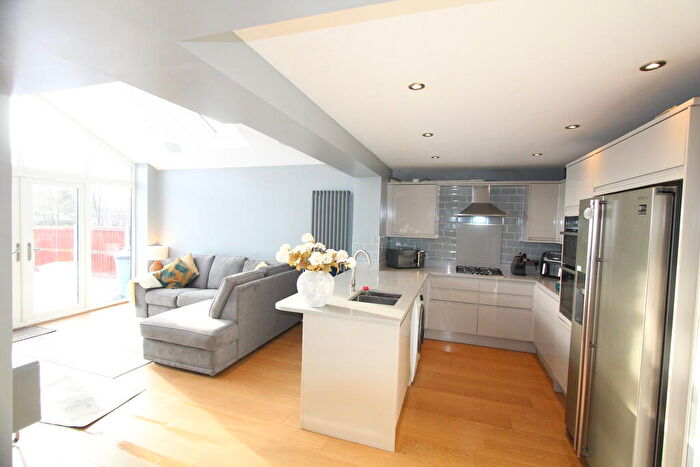
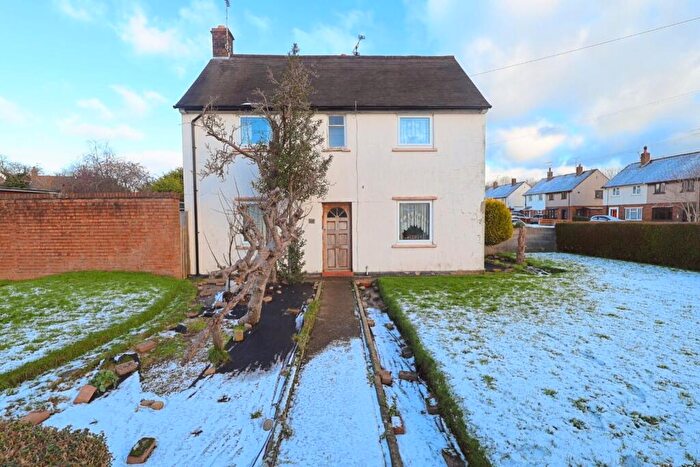
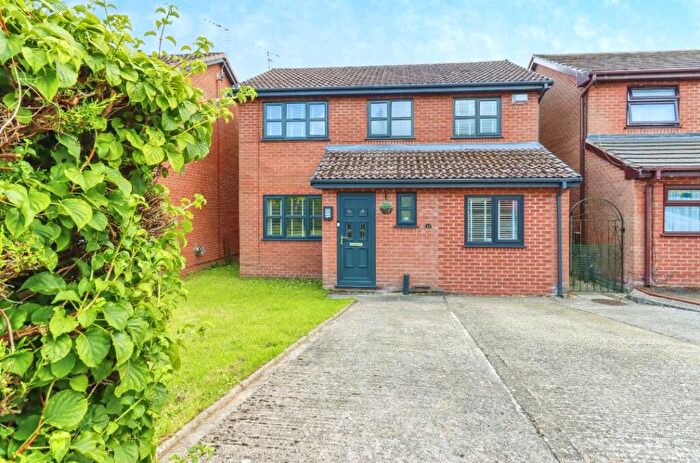
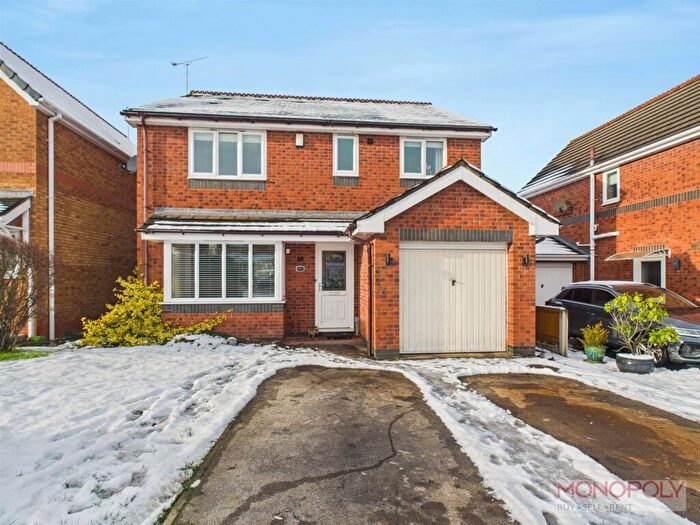
Properties for sale in Penycae And Ruabon South
Roads and Postcodes in Penycae And Ruabon South
Navigate through our locations to find the location of your next house in Penycae And Ruabon South, Wrexham for sale or to rent.
| Streets | Postcodes |
|---|---|
| Bridge Street | LL14 2RH LL14 6DA |
| Bro Awelon | LL14 2RG |
| Bryn Y Barcut | LL14 2TR |
| Bryn Y Coed | LL14 2EG |
| Brynyffynnon Road | LL14 2RW |
| Chapel Street | LL14 2RF |
| Church Street | LL14 2RL |
| Church View | LL14 6TD |
| Cil Y Coed | LL14 6TA |
| Coed Y Nant | LL14 2SJ |
| Copperas Hill | LL14 2SA LL14 2SD |
| Cristionydd | LL14 1TT LL14 2RR LL14 2RS |
| Drefechan | LL14 1UE |
| Duke Street | LL14 6DE |
| Gardd Francis | LL14 2LY |
| Groesfan | LL14 2RP |
| Hall Street | LL14 2RT LL14 2RU LL14 2RY |
| Hill Close | LL14 2SG |
| Hill Street | LL14 2RD |
| James Park Way | LL14 6EQ |
| Lambpit Street | LL14 2RB |
| Little Street | LL14 6DF |
| Llangollen Road | LL14 6RW |
| Llwyn Bach | LL14 6TB |
| Llys Y Nant | LL14 6DJ |
| Maes Mabon | LL14 6EL |
| Maes Y Nant | LL14 2RE |
| Maesydd | LL14 1UF |
| Mammoth Grove | LL14 2RN |
| Millbrook | LL14 6DX |
| Overton Road | LL14 6LL |
| Paddock Row | LL14 6DD |
| Park Road | LL14 3EH |
| Parkland Walk | LL14 6TG |
| Pen Y Lan | LL14 6HP LL14 6HR LL14 6HT LL14 6HW LL14 6HS |
| Plasbennion Road | LL14 1TP |
| Pont Adam | LL14 6BT LL14 6DU |
| Pont Adam Crescent | LL14 6ED LL14 6EE LL14 6EF LL14 6EG LL14 6EH |
| Railway Terrace | LL14 6DH |
| Rhosymadoc | LL14 6LN LL14 6LP LL14 6LR LL14 6LS LL14 6LT LL14 6LW LL14 6LU |
| Ruabon Road | LL14 1TW |
| Spinney Walk | LL14 6TE |
| Station Road | LL14 6DL |
| Sweeney Mount | LL14 1TS |
| Tainant | LL14 1UG |
| Tanylan | LL14 6DB |
| The Walks | LL14 6DG |
| Village Meadow | LL14 6TF |
| Watkin Way | LL14 6EP |
| Westend Terrace | LL14 6EA |
| Wynn Hall Terrace | LL14 1TR |
| Wynnstay Gardens | LL14 6EJ |
| Wynnstay Hall Estate | LL14 6LA LL14 6LB LL14 6LJ |
| Wynnstay Mews | LL14 6BU |
| Wynnstay Technology Park | LL14 6EN |
| Wynnstay Yard | LL14 6DP |
| LL14 6DW |
Transport near Penycae And Ruabon South
- FAQ
- Price Paid By Year
- Property Type Price
Frequently asked questions about Penycae And Ruabon South
What is the average price for a property for sale in Penycae And Ruabon South?
The average price for a property for sale in Penycae And Ruabon South is £219,648. This amount is 6% higher than the average price in Wrexham. There are 916 property listings for sale in Penycae And Ruabon South.
What streets have the most expensive properties for sale in Penycae And Ruabon South?
The streets with the most expensive properties for sale in Penycae And Ruabon South are Ruabon Road at an average of £700,000, Pen Y Lan at an average of £410,285 and Wynnstay Hall Estate at an average of £279,272.
What streets have the most affordable properties for sale in Penycae And Ruabon South?
The streets with the most affordable properties for sale in Penycae And Ruabon South are Wynnstay Mews at an average of £93,737, Copperas Hill at an average of £142,400 and Bro Awelon at an average of £150,000.
Which train stations are available in or near Penycae And Ruabon South?
Some of the train stations available in or near Penycae And Ruabon South are Ruabon, Chirk and Wrexham Central.
Property Price Paid in Penycae And Ruabon South by Year
The average sold property price by year was:
| Year | Average Sold Price | Price Change |
Sold Properties
|
|---|---|---|---|
| 2025 | £210,225 | -12% |
20 Properties |
| 2024 | £235,574 | 22% |
27 Properties |
| 2023 | £183,100 | -30% |
25 Properties |
| 2022 | £238,319 | 18% |
36 Properties |
| 2021 | £194,585 | -4% |
46 Properties |
| 2020 | £201,587 | -1% |
28 Properties |
| 2019 | £202,909 | -3% |
51 Properties |
| 2018 | £209,019 | 31% |
48 Properties |
| 2017 | £144,997 | -24% |
35 Properties |
| 2016 | £180,246 | 15% |
31 Properties |
| 2015 | £153,752 | 1% |
33 Properties |
| 2014 | £152,255 | 13% |
33 Properties |
| 2013 | £132,450 | -8% |
18 Properties |
| 2012 | £142,761 | -48% |
17 Properties |
| 2011 | £211,043 | 17% |
22 Properties |
| 2010 | £175,153 | 13% |
16 Properties |
| 2009 | £152,282 | -33% |
17 Properties |
| 2008 | £203,111 | 10% |
23 Properties |
| 2007 | £182,865 | 17% |
76 Properties |
| 2006 | £150,890 | 6% |
51 Properties |
| 2005 | £141,982 | 7% |
28 Properties |
| 2004 | £132,248 | 14% |
46 Properties |
| 2003 | £113,237 | 0,3% |
39 Properties |
| 2002 | £112,909 | 37% |
46 Properties |
| 2001 | £70,887 | -14% |
36 Properties |
| 2000 | £80,574 | 23% |
49 Properties |
| 1999 | £61,994 | 15% |
37 Properties |
| 1998 | £52,650 | 8% |
26 Properties |
| 1997 | £48,515 | 7% |
33 Properties |
| 1996 | £45,354 | -16% |
37 Properties |
| 1995 | £52,517 | - |
31 Properties |
Property Price per Property Type in Penycae And Ruabon South
Here you can find historic sold price data in order to help with your property search.
The average Property Paid Price for specific property types in the last three years are:
| Property Type | Average Sold Price | Sold Properties |
|---|---|---|
| Semi Detached House | £185,301.00 | 35 Semi Detached Houses |
| Detached House | £298,357.00 | 35 Detached Houses |
| Terraced House | £160,933.00 | 31 Terraced Houses |
| Flat | £257,857.00 | 7 Flats |

