
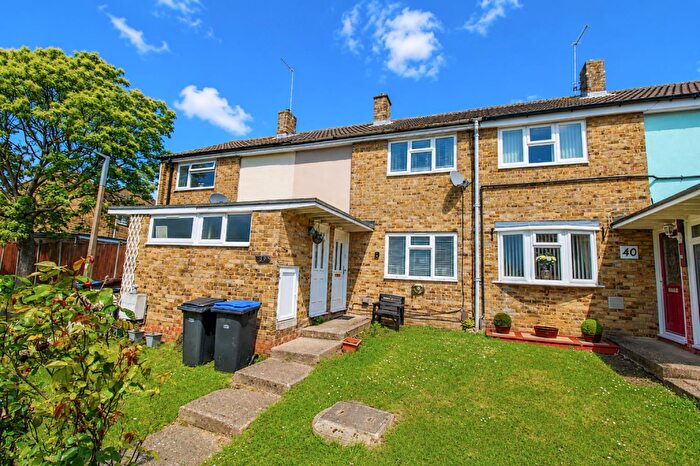
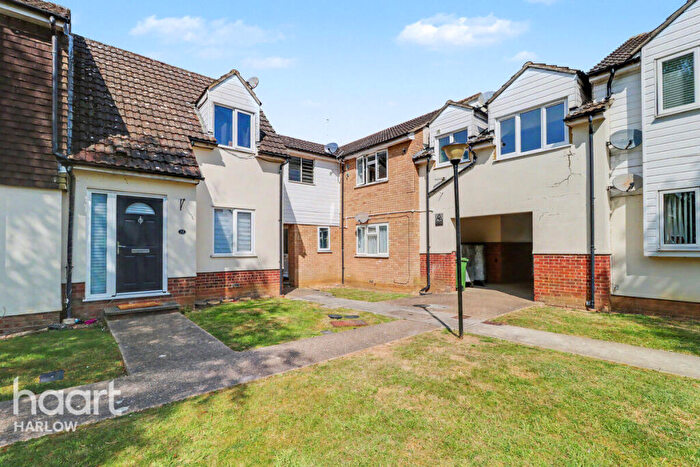
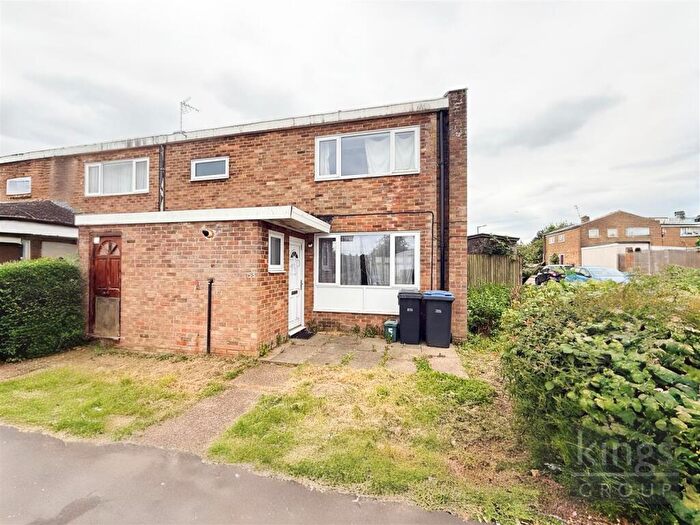
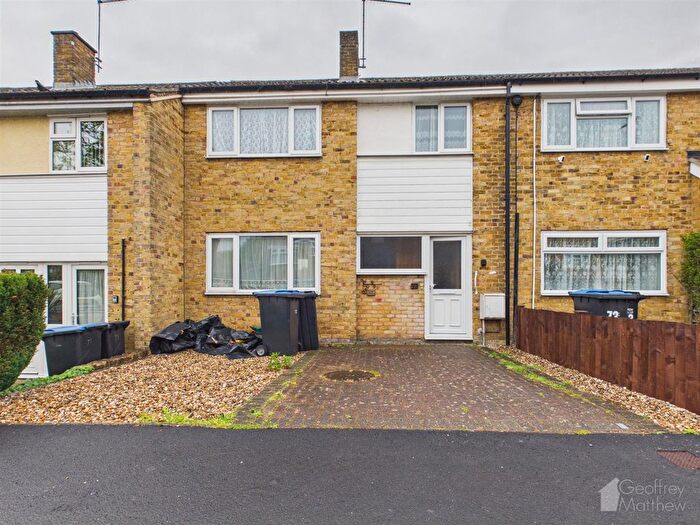
Properties for sale in CM18
Harlow
- Info
- Price Paid By Year
- Property Type Price
- Transport
House Prices in CM18
Properties in CM18 have an average house price of £307,473.00 and had 783 Property Transactions within the last 3 years.
The most expensive property was sold for £1,310,000.00.
Property Price Paid in CM18 by Year
The average sold property price by year was:
| Year | Average Sold Price | Sold Properties |
|---|---|---|
| 2026 | £400,844.00 | 22 Properties |
| 2025 | £306,868.00 | 269 Properties |
| 2024 | £302,937.00 | 257 Properties |
| 2023 | £304,386.00 | 235 Properties |
| 2022 | £320,644.00 | 302 Properties |
| 2021 | £284,791.00 | 362 Properties |
| 2020 | £286,113.00 | 289 Properties |
| 2019 | £279,466.00 | 321 Properties |
| 2018 | £267,600.00 | 303 Properties |
| 2017 | £269,327.00 | 332 Properties |
| 2016 | £239,949.00 | 331 Properties |
| 2015 | £215,165.00 | 334 Properties |
| 2014 | £188,770.00 | 362 Properties |
| 2013 | £169,247.00 | 255 Properties |
| 2012 | £161,964.00 | 175 Properties |
| 2011 | £158,985.00 | 203 Properties |
| 2010 | £153,545.00 | 161 Properties |
| 2009 | £156,170.00 | 183 Properties |
| 2008 | £167,604.00 | 200 Properties |
| 2007 | £160,196.00 | 510 Properties |
| 2006 | £152,566.00 | 448 Properties |
| 2005 | £142,615.00 | 346 Properties |
| 2004 | £139,222.00 | 457 Properties |
| 2003 | £120,444.00 | 466 Properties |
| 2002 | £109,609.00 | 467 Properties |
| 2001 | £87,759.00 | 391 Properties |
| 2000 | £79,116.00 | 415 Properties |
| 1999 | £65,383.00 | 404 Properties |
| 1998 | £63,157.00 | 368 Properties |
| 1997 | £58,641.00 | 378 Properties |
| 1996 | £53,907.00 | 298 Properties |
| 1995 | £51,413.00 | 256 Properties |
Property Price per Property Type in CM18
Here you can find historic sold price data in order to help with your property search.
The average Property Paid Price for specific property types in the last three years are:
| Property Type | Average Sold Price | Sold Properties |
|---|---|---|
| Semi Detached House | £385,843.00 | 88 Semi Detached Houses |
| Detached House | £510,145.00 | 48 Detached Houses |
| Terraced House | £311,371.00 | 500 Terraced Houses |
| Flat | £181,122.00 | 147 Flats |


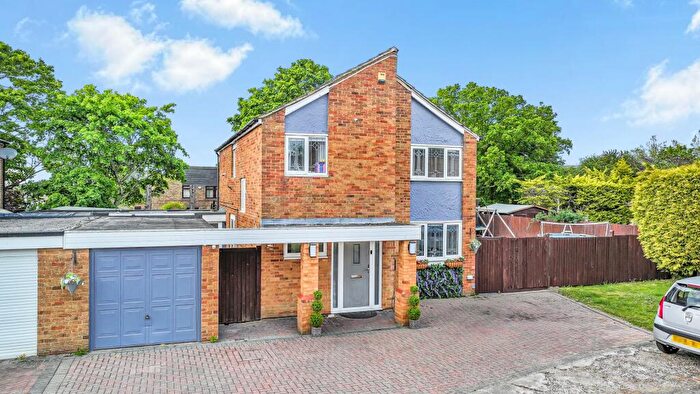
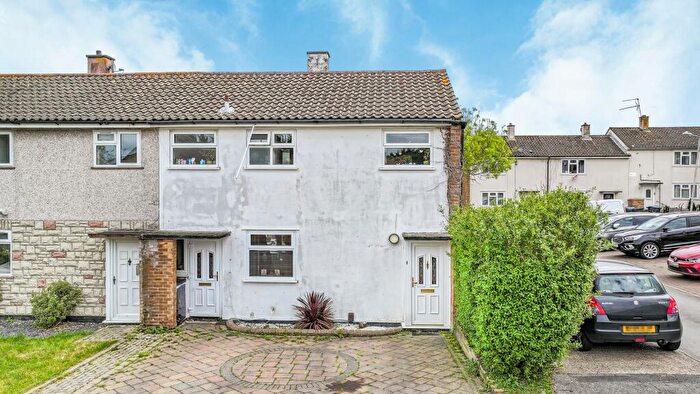
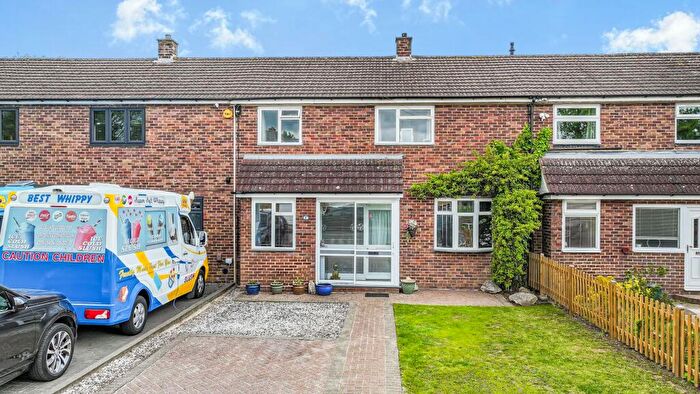
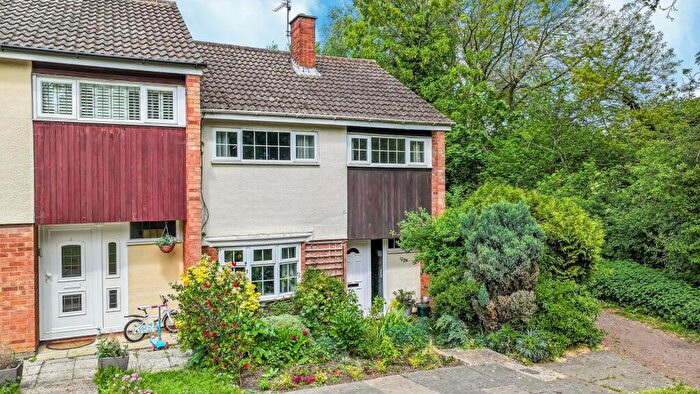
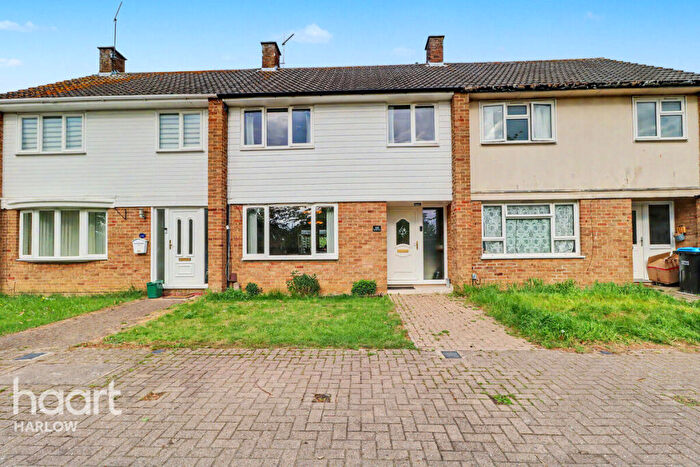
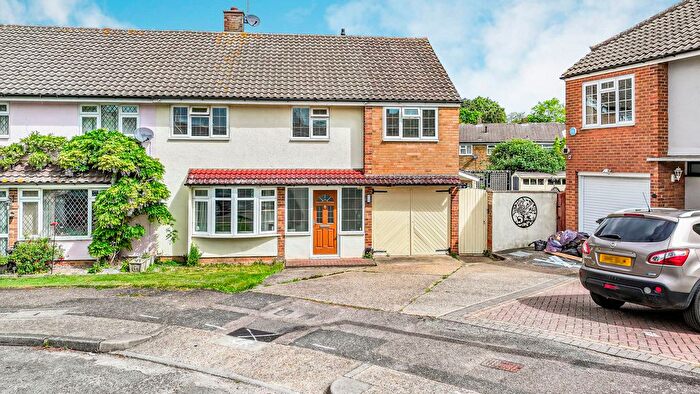
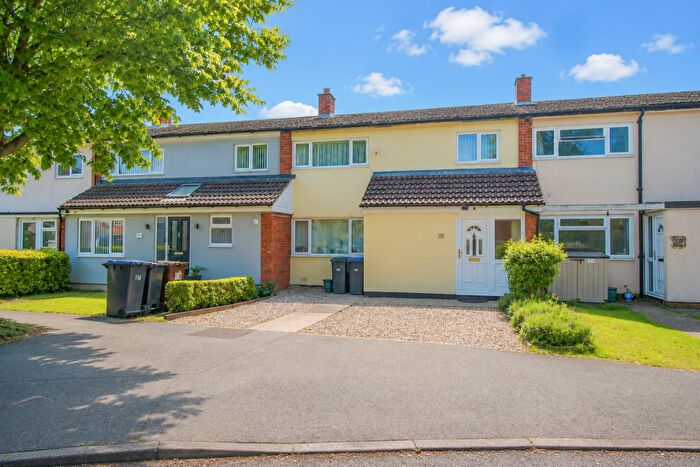
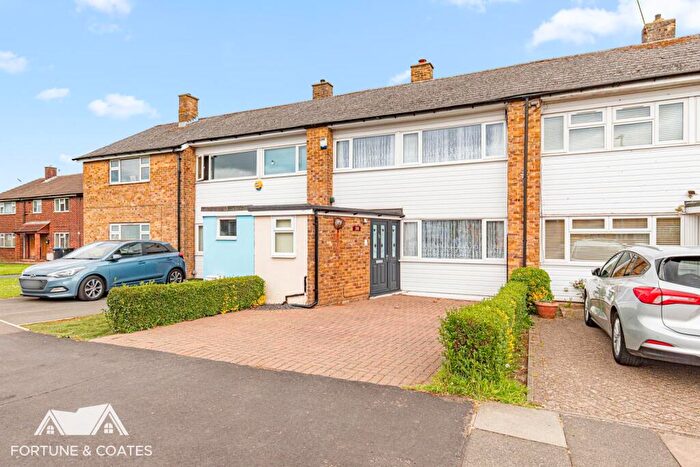
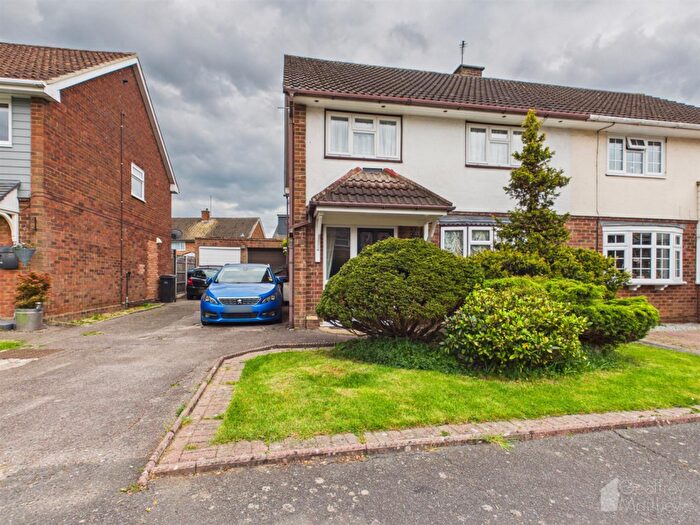
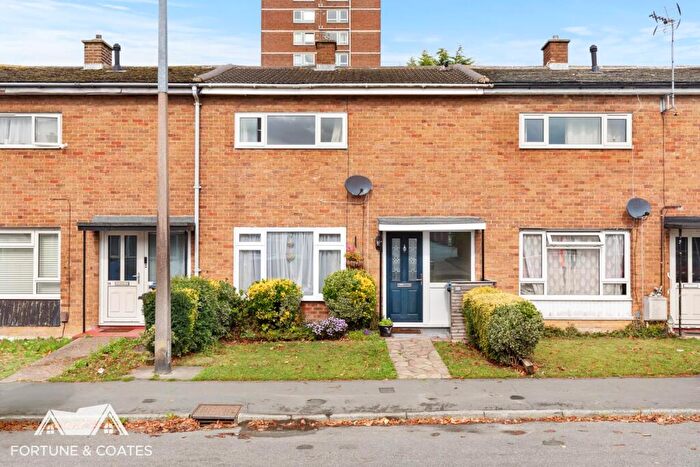
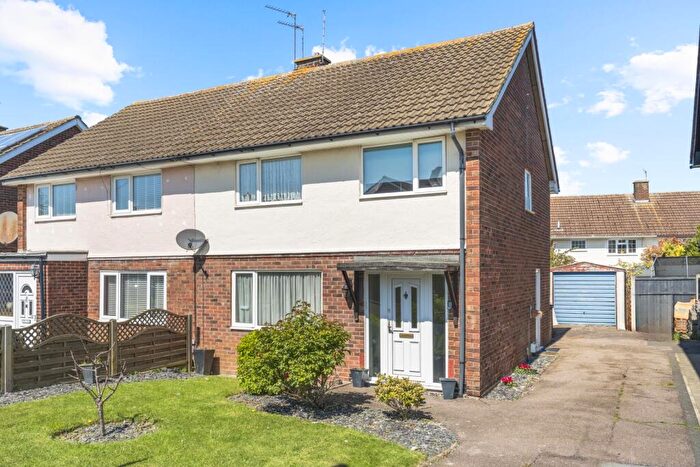
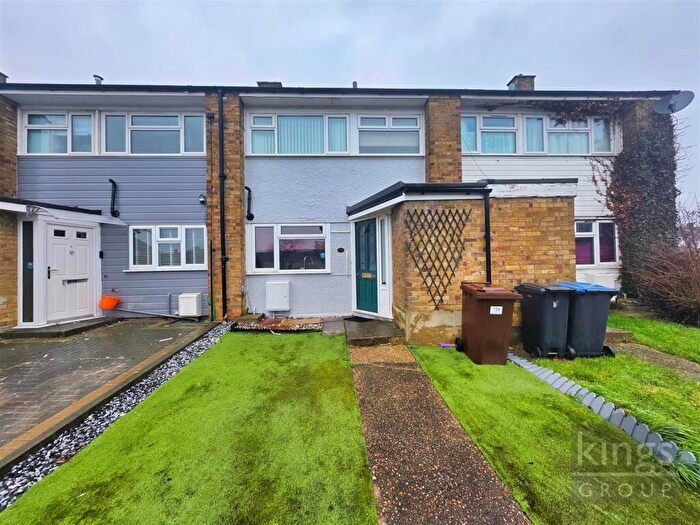
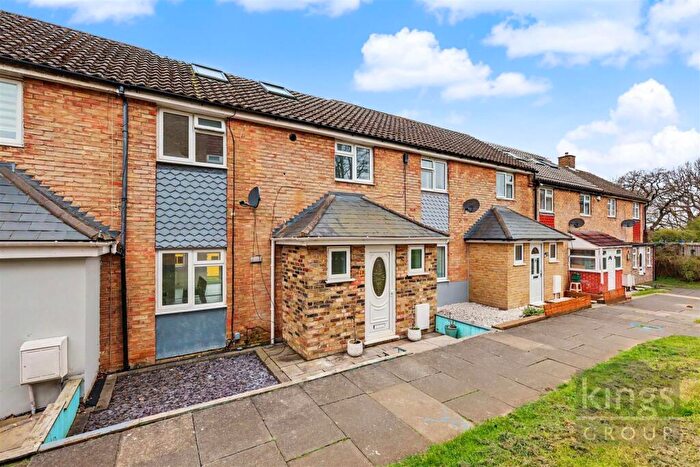
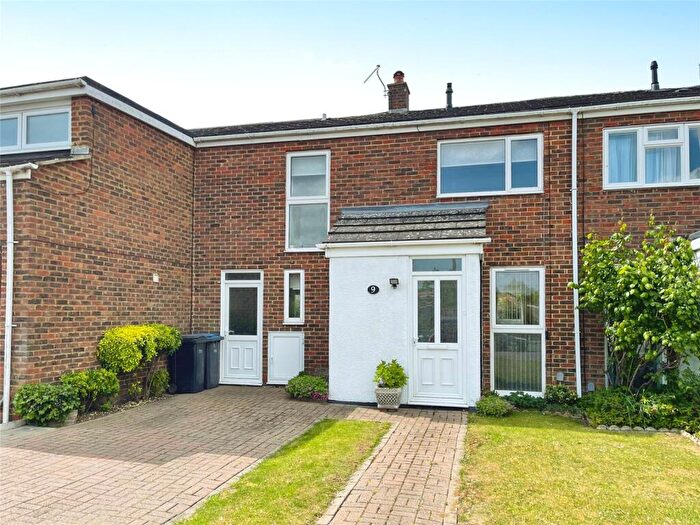
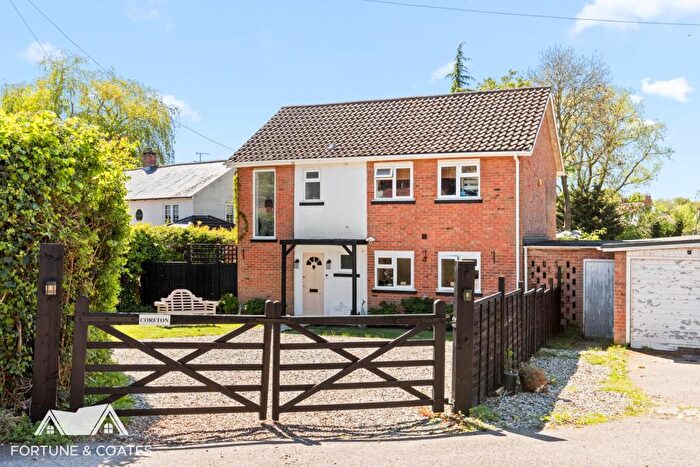
Houses and Flats for sale in CM18, Harlow

![]()
If you are looking to sell your house, let it out, or receive a property valuation, an expert can help you.
Click the button below to get started.


Frequently Asked Questions about CM18
What is the average price for a property for sale in CM18?
The average price for a property for sale in CM18 is £307,473. There are 66 property listings for sale in CM18.
Which areas are included in the CM18 postcode district?
The main area within CM18 is Harlow.
What are the most common property types in CM18?
The most common property types in CM18 are Terraced Houses, Flats, Semi Detached Houses and Detached Houses.
What has been the average sold property price in CM18 over the last three years?
Terraced Houses in CM18 have an average sold price of £311,371, while Flats have an average of £181,122. Semi Detached Houses have an average of £385,843 and Detached Houses have an average of £510,145. The average sold property price in CM18 over the last three years is approximately £336,883.