
Properties for sale in IP7
Hadleigh
- Info
- Price Paid By Year
- Property Type Price
- Transport
House Prices in IP7
Properties in IP7 have an average house price of £406,329.00 and had 524 Property Transactions within the last 3 years.
The most expensive property was sold for £2,050,000.00.
Property Price Paid in IP7 by Year
The average sold property price by year was:
| Year | Average Sold Price | Sold Properties |
|---|---|---|
| 2026 | £311,666.00 | 9 Properties |
| 2025 | £410,184.00 | 162 Properties |
| 2024 | £390,462.00 | 195 Properties |
| 2023 | £427,351.00 | 158 Properties |
| 2022 | £422,611.00 | 192 Properties |
| 2021 | £397,796.00 | 300 Properties |
| 2020 | £348,917.00 | 244 Properties |
| 2019 | £333,004.00 | 274 Properties |
| 2018 | £334,256.00 | 215 Properties |
| 2017 | £362,433.00 | 240 Properties |
| 2016 | £338,406.00 | 219 Properties |
| 2015 | £282,349.00 | 220 Properties |
| 2014 | £271,231.00 | 298 Properties |
| 2013 | £265,361.00 | 243 Properties |
| 2012 | £227,501.00 | 219 Properties |
| 2011 | £234,801.00 | 150 Properties |
| 2010 | £295,684.00 | 213 Properties |
| 2009 | £228,425.00 | 193 Properties |
| 2008 | £255,500.00 | 163 Properties |
| 2007 | £259,445.00 | 323 Properties |
| 2006 | £232,658.00 | 346 Properties |
| 2005 | £218,994.00 | 287 Properties |
| 2004 | £200,592.00 | 348 Properties |
| 2003 | £195,313.00 | 255 Properties |
| 2002 | £184,155.00 | 335 Properties |
| 2001 | £135,458.00 | 321 Properties |
| 2000 | £125,820.00 | 272 Properties |
| 1999 | £108,381.00 | 346 Properties |
| 1998 | £92,212.00 | 314 Properties |
| 1997 | £85,743.00 | 321 Properties |
| 1996 | £75,898.00 | 232 Properties |
| 1995 | £75,111.00 | 197 Properties |
Property Price per Property Type in IP7
Here you can find historic sold price data in order to help with your property search.
The average Property Paid Price for specific property types in the last three years are:
| Property Type | Average Sold Price | Sold Properties |
|---|---|---|
| Semi Detached House | £324,918.00 | 128 Semi Detached Houses |
| Detached House | £513,297.00 | 256 Detached Houses |
| Terraced House | £292,630.00 | 122 Terraced Houses |
| Flat | £234,555.00 | 18 Flats |

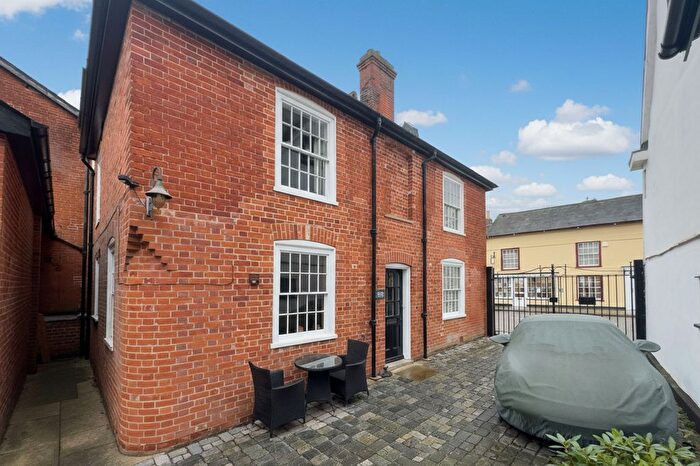
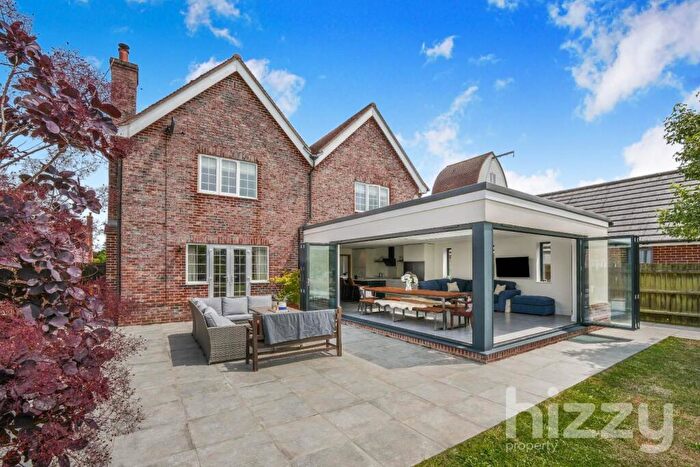
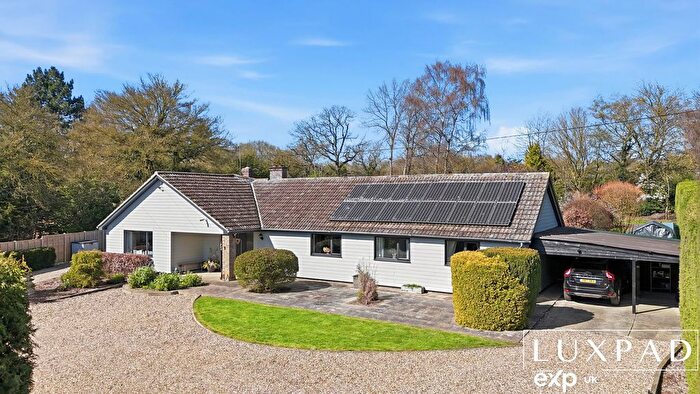
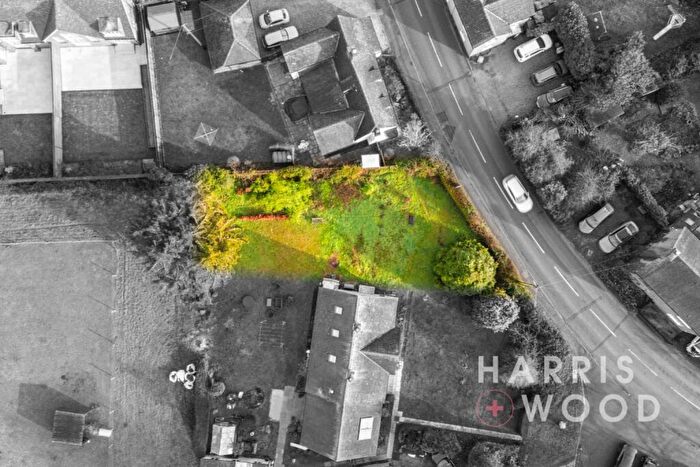
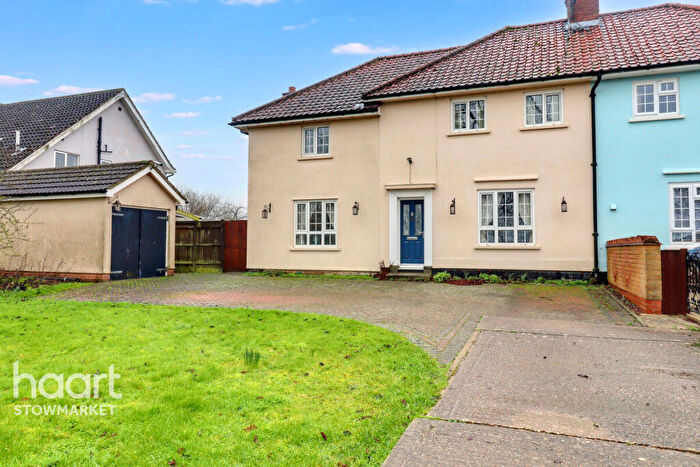
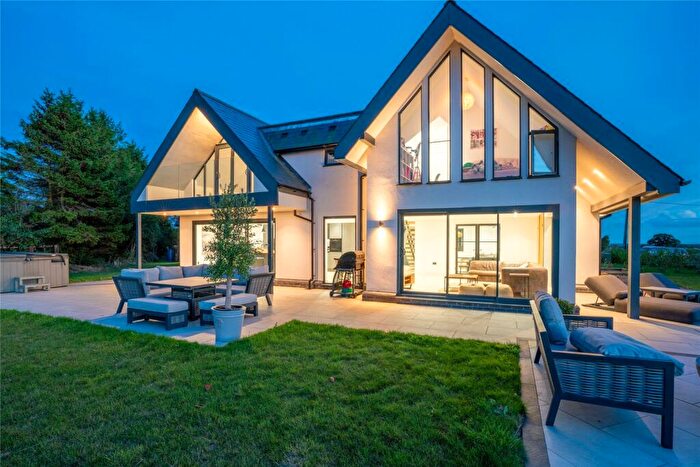
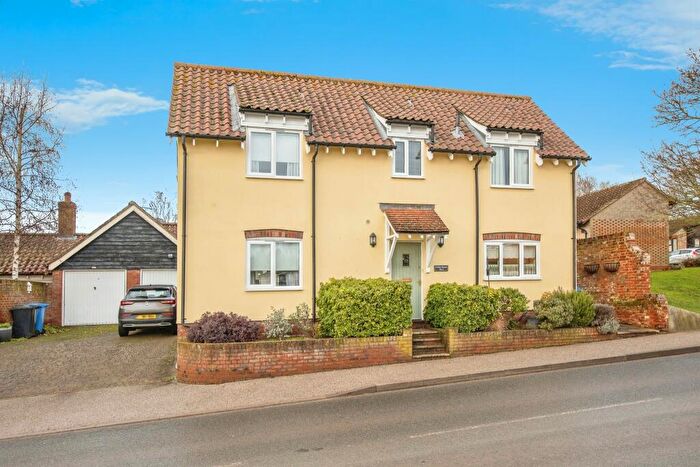
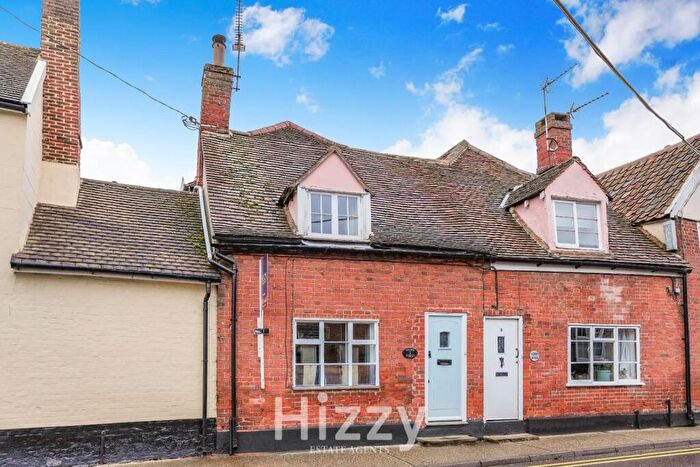
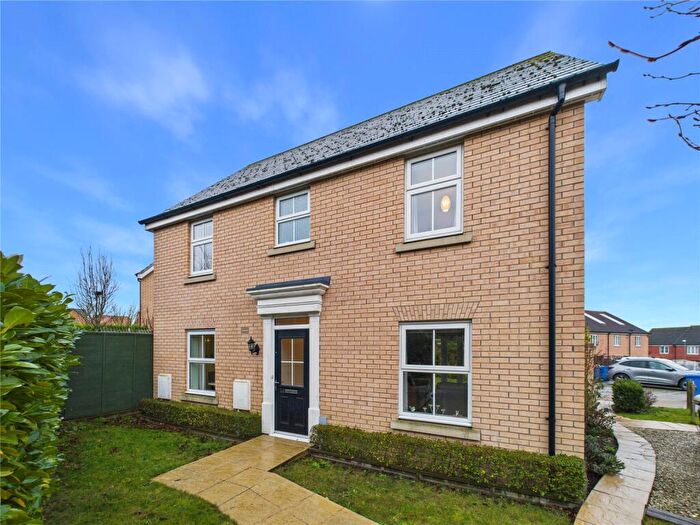
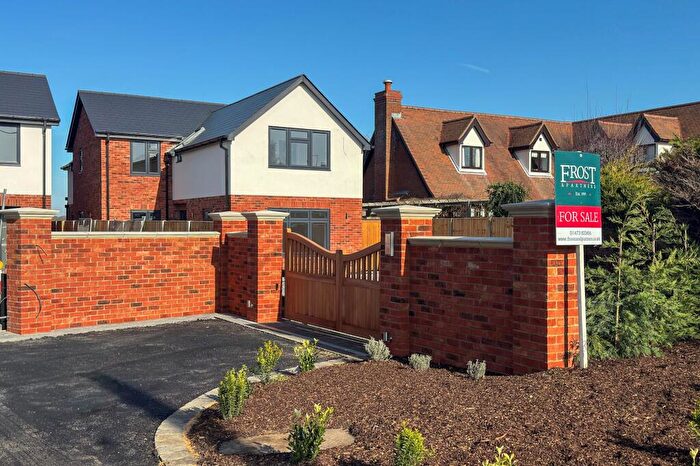
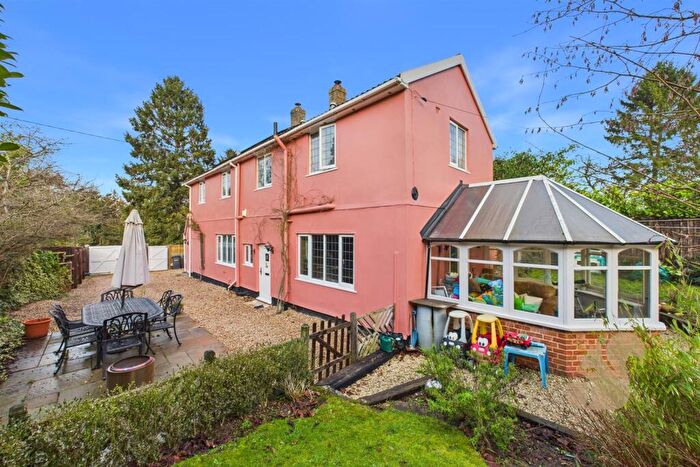
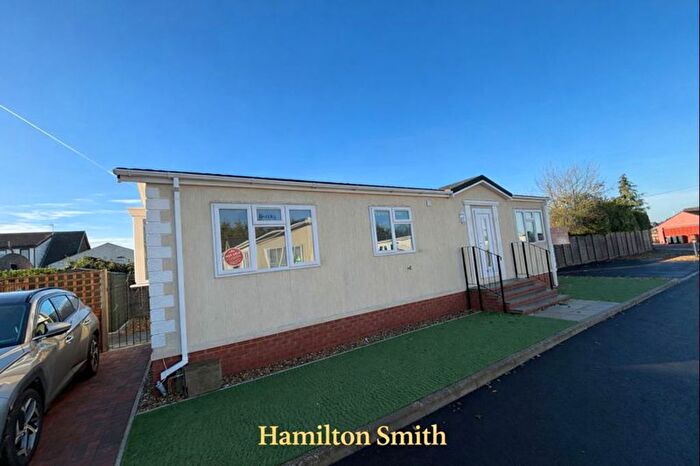
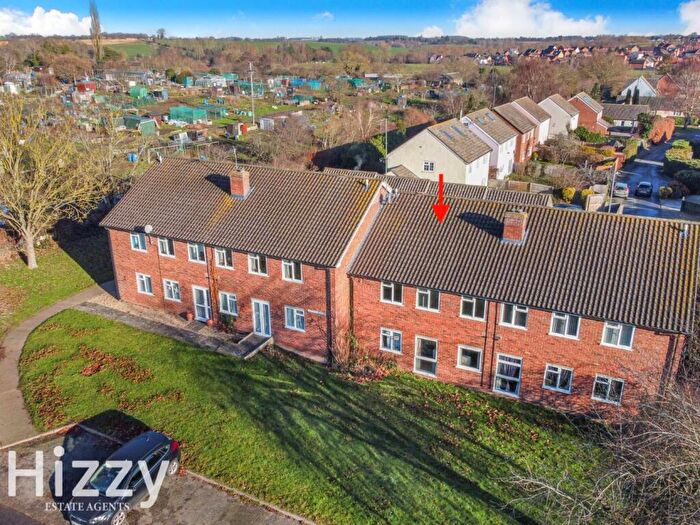
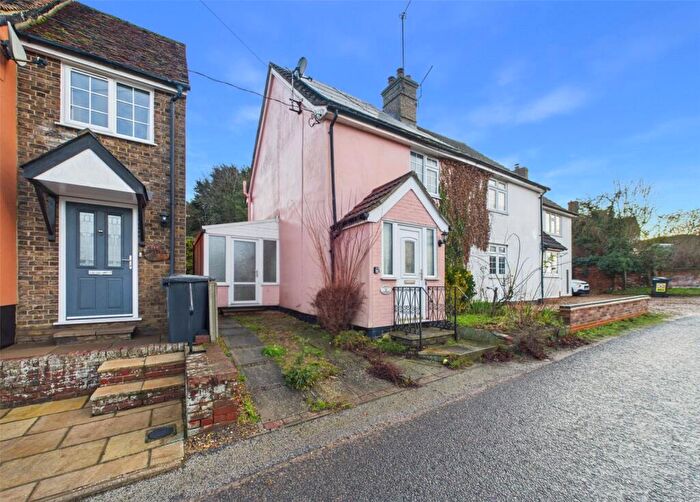
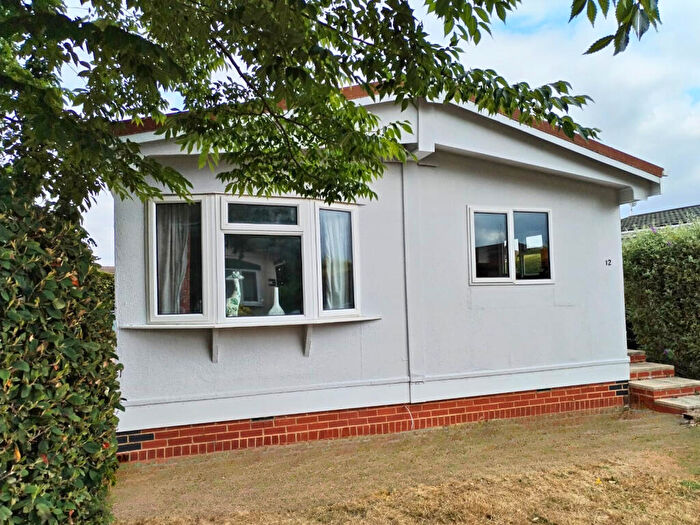
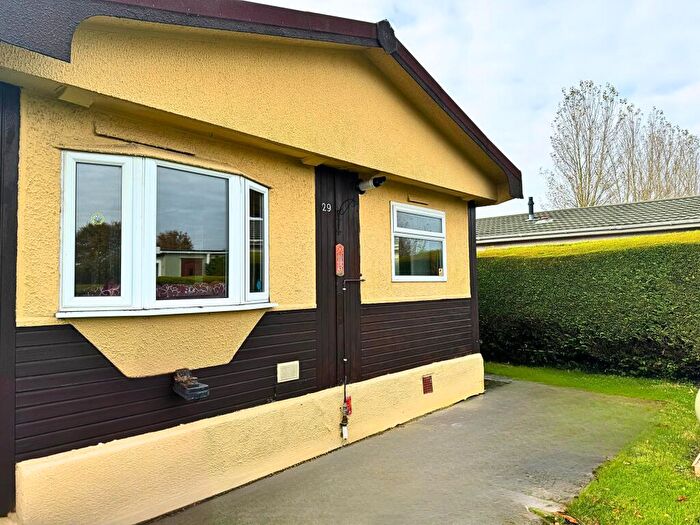
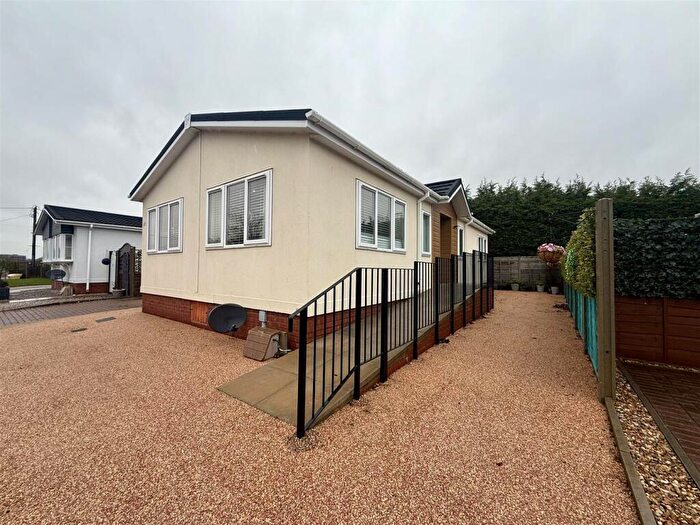
Houses and Flats for sale in IP7, Hadleigh
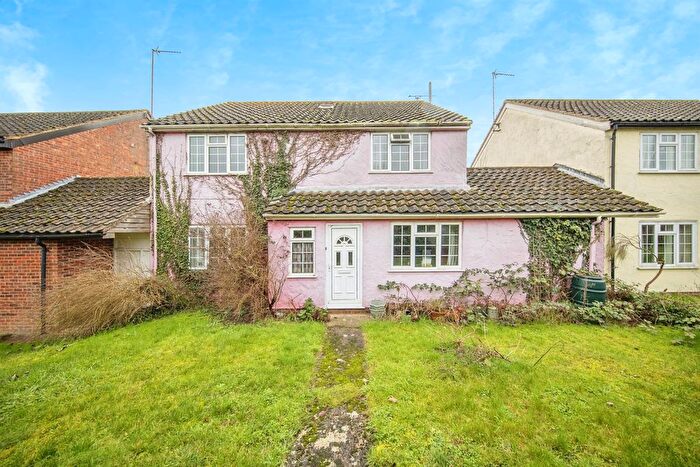
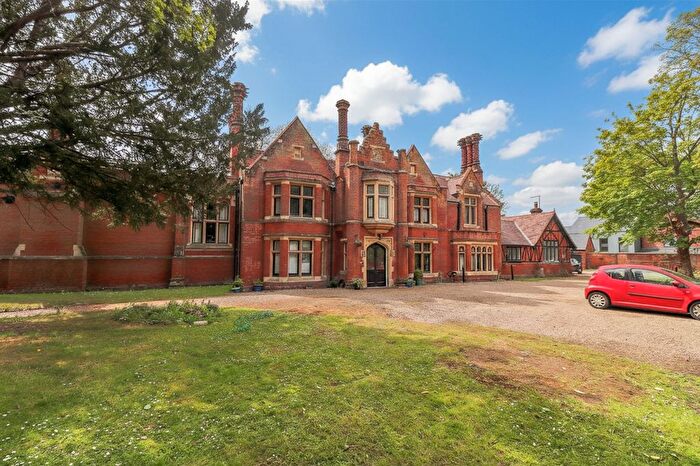
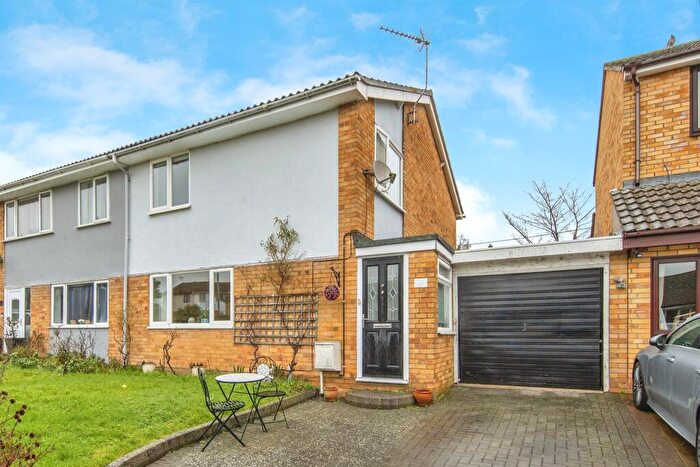
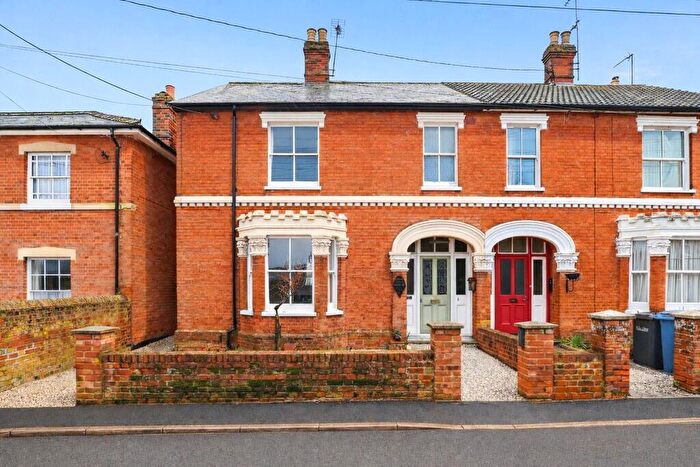
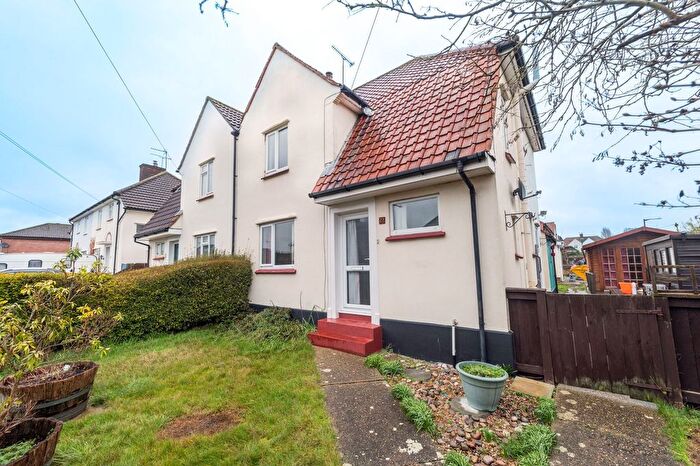
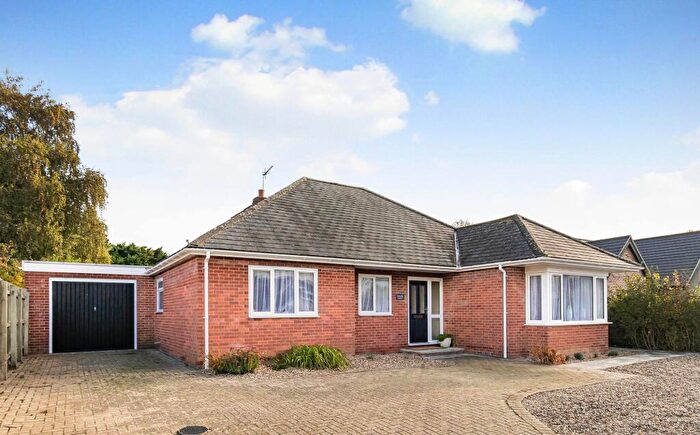
![]()
If you are looking to sell your house, let it out, or receive a property valuation, an expert can help you.
Click the button below to get started.

Frequently Asked Questions about IP7
What is the average price for a property for sale in IP7?
The average price for a property for sale in IP7 is £406,329. There are 146 property listings for sale in IP7.
Which areas are included in the IP7 postcode district?
The main area within IP7 is Hadleigh.
What are the most common property types in IP7?
The most common property types in IP7 are Detached Houses, Semi Detached Houses, Terraced Houses and Flats.
What has been the average sold property price in IP7 over the last three years?
Detached Houses in IP7 have an average sold price of £513,297, while Semi Detached Houses have an average of £324,918. Terraced Houses have an average of £292,630 and Flats have an average of £234,555. The average sold property price in IP7 over the last three years is approximately £370,771.