
Properties for sale in KT8
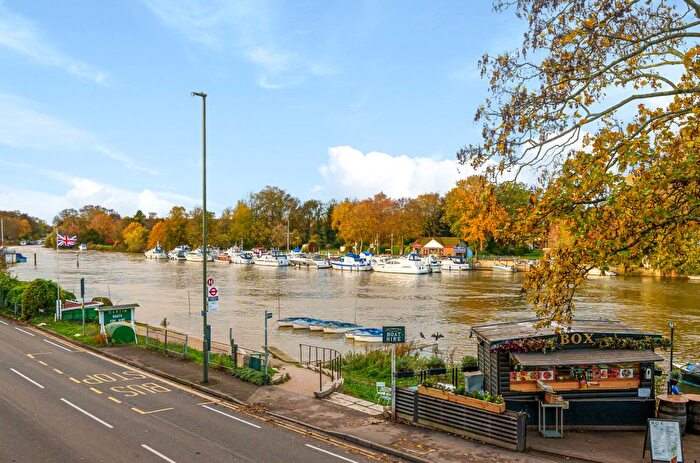
West Molesey, East Molesey, Hampton Court Palace, Bushy Park
- Info
- Price Paid By Year
- Property Type Price
- Transport
House Prices in KT8
Properties in KT8 have an average house price of £675,240.00 and had 787 Property Transactions within the last 3 years.
The most expensive property was sold for £4,200,000.00.
Property Price Paid in KT8 by Year
The average sold property price by year was:
| Year | Average Sold Price | Sold Properties |
|---|---|---|
| 2026 | £671,666.00 | 3 Properties |
| 2025 | £666,697.00 | 268 Properties |
| 2024 | £710,676.00 | 279 Properties |
| 2023 | £643,229.00 | 237 Properties |
| 2022 | £742,296.00 | 352 Properties |
| 2021 | £703,818.00 | 489 Properties |
| 2020 | £625,570.00 | 302 Properties |
| 2019 | £627,056.00 | 341 Properties |
| 2018 | £601,609.00 | 326 Properties |
| 2017 | £590,138.00 | 305 Properties |
| 2016 | £565,381.00 | 363 Properties |
| 2015 | £518,827.00 | 404 Properties |
| 2014 | £530,090.00 | 413 Properties |
| 2013 | £489,543.00 | 392 Properties |
| 2012 | £432,959.00 | 340 Properties |
| 2011 | £398,892.00 | 293 Properties |
| 2010 | £387,417.00 | 306 Properties |
| 2009 | £354,712.00 | 262 Properties |
| 2008 | £397,276.00 | 288 Properties |
| 2007 | £386,689.00 | 508 Properties |
| 2006 | £327,722.00 | 620 Properties |
| 2005 | £304,603.00 | 413 Properties |
| 2004 | £292,869.00 | 453 Properties |
| 2003 | £261,789.00 | 419 Properties |
| 2002 | £236,581.00 | 573 Properties |
| 2001 | £218,319.00 | 489 Properties |
| 2000 | £198,731.00 | 430 Properties |
| 1999 | £167,930.00 | 556 Properties |
| 1998 | £149,474.00 | 442 Properties |
| 1997 | £137,206.00 | 475 Properties |
| 1996 | £135,510.00 | 536 Properties |
| 1995 | £140,348.00 | 393 Properties |
Property Price per Property Type in KT8
Here you can find historic sold price data in order to help with your property search.
The average Property Paid Price for specific property types in the last three years are:
| Property Type | Average Sold Price | Sold Properties |
|---|---|---|
| Semi Detached House | £704,278.00 | 231 Semi Detached Houses |
| Detached House | £1,271,972.00 | 132 Detached Houses |
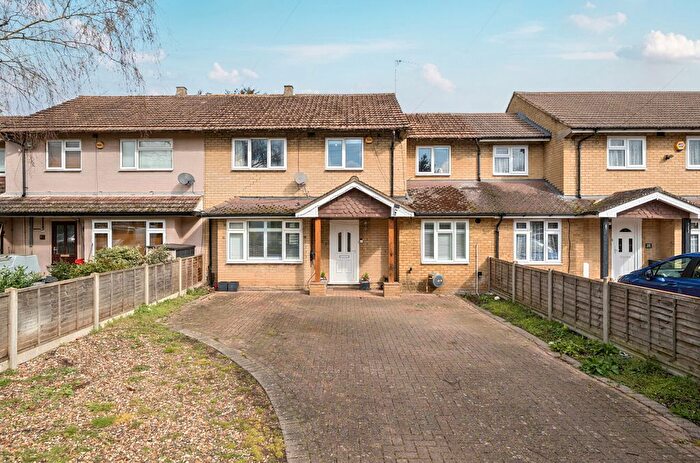
| Terraced House | £525,429.00 | 237 Terraced Houses |
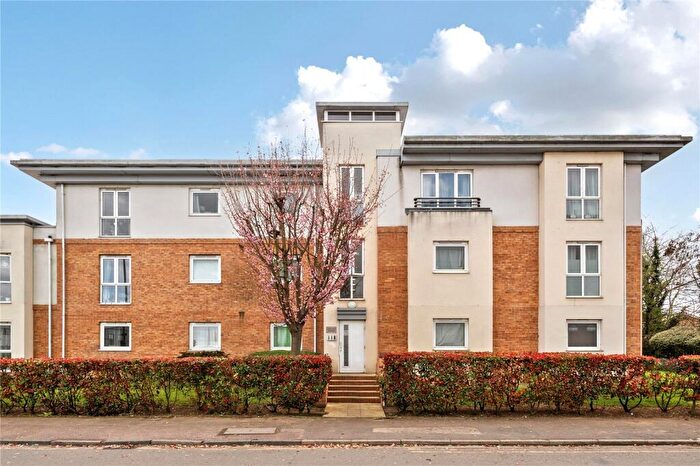
| Flat | £408,013.00 | 187 Flats |

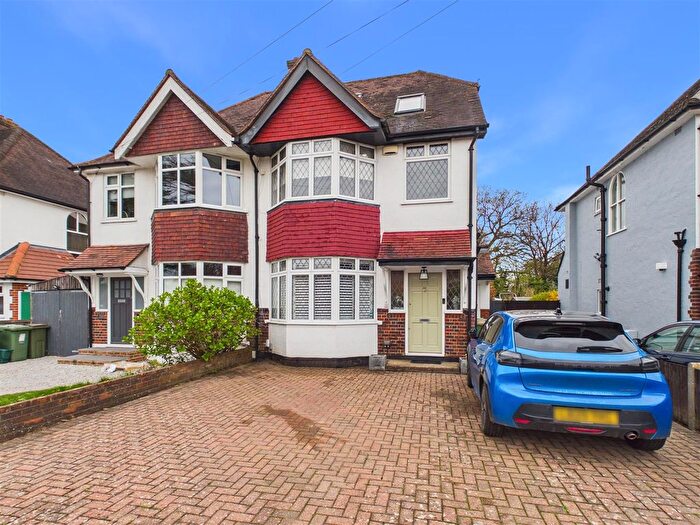
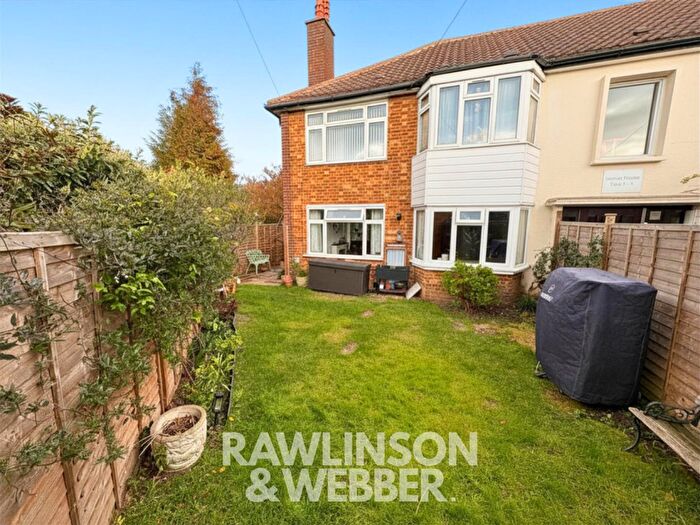
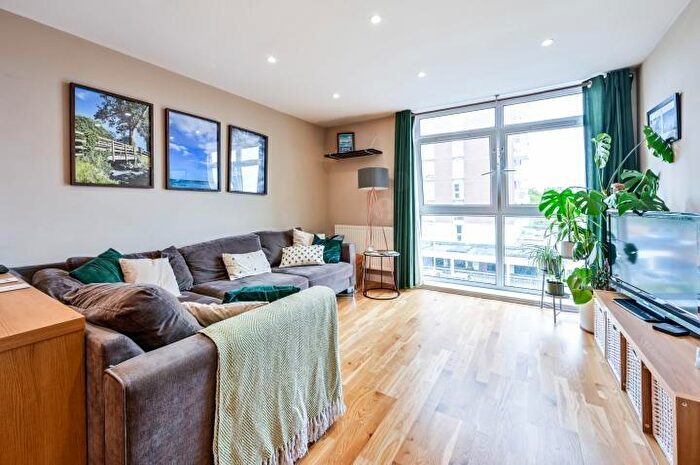
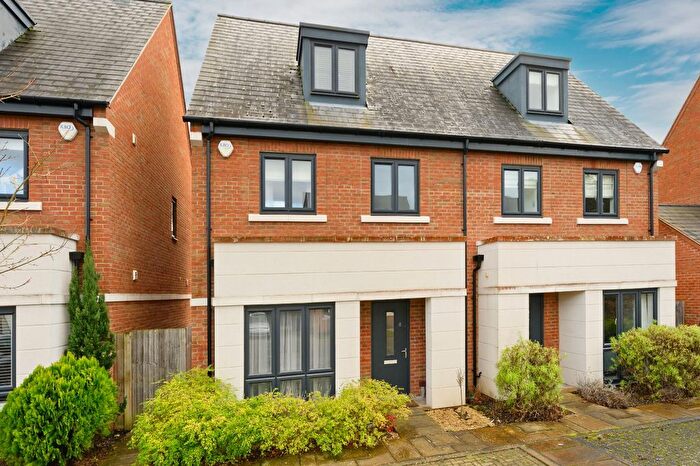
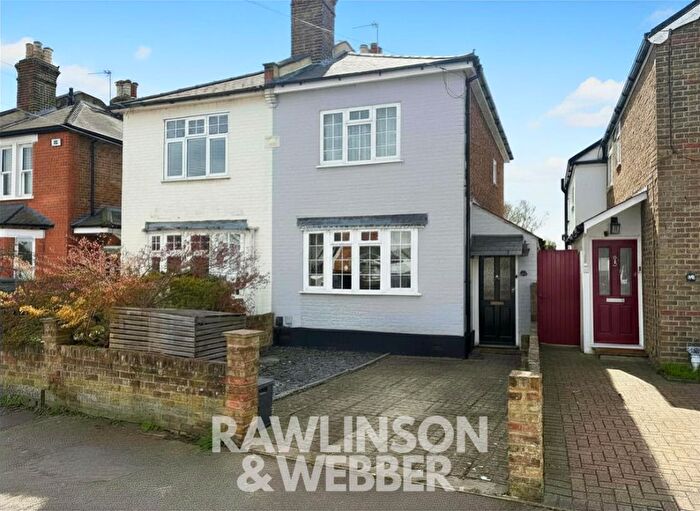
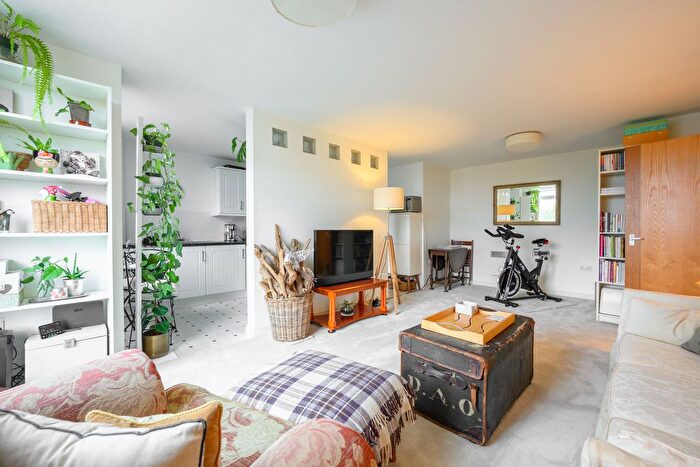
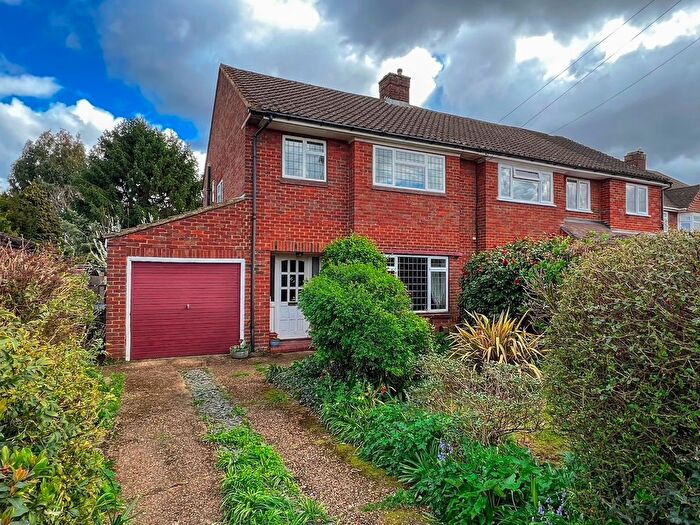
Houses and Flats for sale in KT8, West Molesey, East Molesey, Hampton Court Palace, Bushy Park
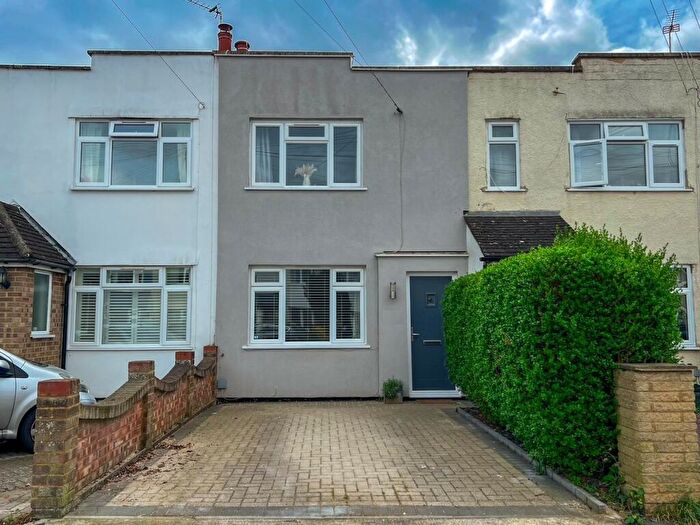
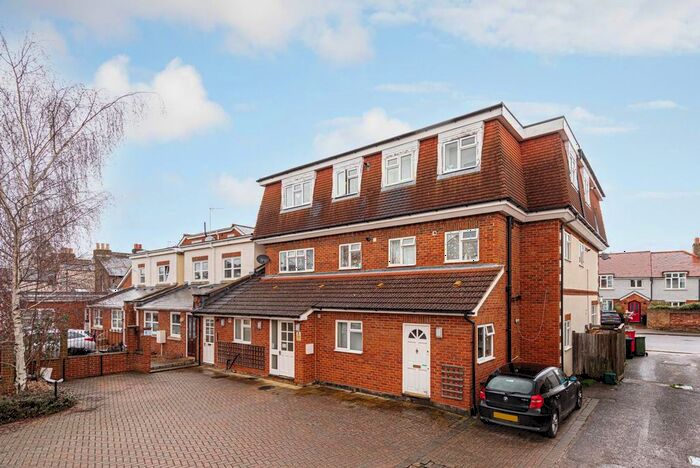
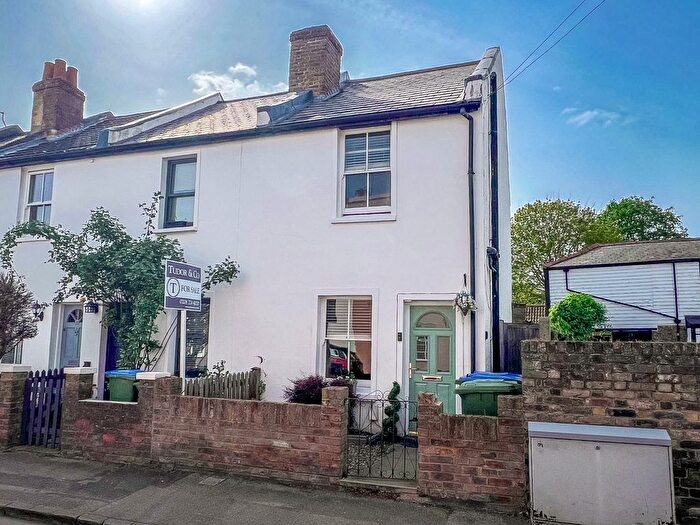

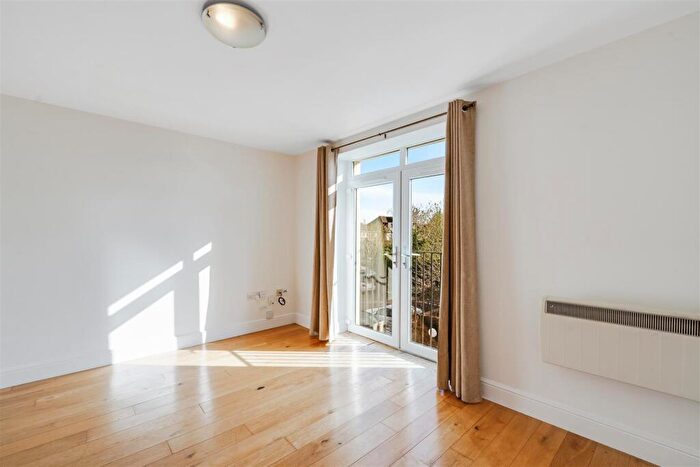
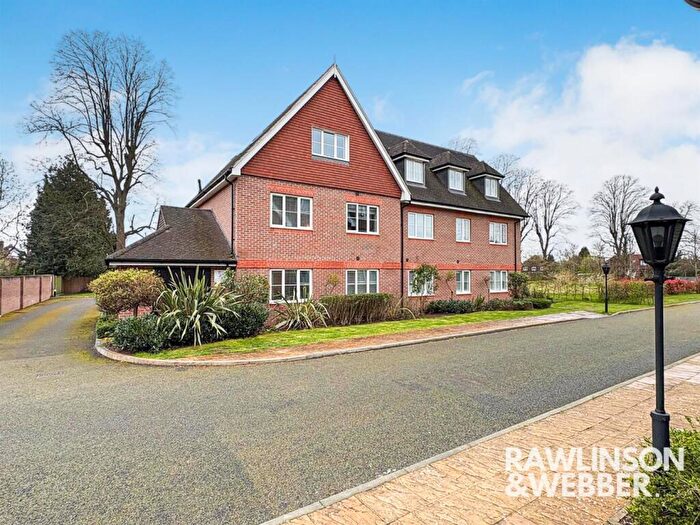
![]()
If you are looking to sell your house, let it out, or receive a property valuation, an expert can help you.
Click the button below to get started.

Frequently Asked Questions about KT8
What is the average price for a property for sale in KT8?
The average price for a property for sale in KT8 is £675,240. There are 222 property listings for sale in KT8.
Which areas are included in the KT8 postcode district?
The main areas within KT8 include West Molesey, East Molesey, Hampton Court Palace and Bushy Park.
What are the most common property types in KT8?
The most common property types in KT8 are Terraced Houses, Semi Detached Houses, Flats and Detached Houses.
What has been the average sold property price in KT8 over the last three years?
Terraced Houses in KT8 have an average sold price of £525,429, while Semi Detached Houses have an average of £704,278. Flats have an average of £408,013 and Detached Houses have an average of £1,271,972. The average sold property price in KT8 over the last three years is approximately £683,013.
Which train stations are available in KT8?
The train station available in KT8 is Hampton Court Station..
Which tube stations are available in KT8?
The tube station available in KT8 is Hampton Court Station.