
Properties for sale in KT
Kingston upon Thames
- Info
- Price Paid By Year
- Property Type Price
House Prices in KT
Properties in KT have an average house price of £691,249 and had 26316 Property Transactions within the last 3 years.
The most expensive property was sold for £19,000,000.
Property Price Paid in KT by Year
The average sold property price by year was:
| Year | Average Sold Price | Sold Properties |
|---|---|---|
| 2026 | £639,455.00 | 3,447 Properties |
| 2025 | £692,359.00 | 8,162 Properties |
| 2024 | £692,212.00 | 7,823 Properties |
| 2023 | £714,773.00 | 6,884 Properties |
| 2022 | £723,440.00 | 9,020 Properties |
| 2021 | £675,812.00 | 11,823 Properties |
| 2020 | £643,559.00 | 7,900 Properties |
| 2019 | £591,641.00 | 8,518 Properties |
| 2018 | £597,808.00 | 8,416 Properties |
| 2017 | £597,725.00 | 8,453 Properties |
| 2016 | £581,238.00 | 9,113 Properties |
| 2015 | £539,285.00 | 9,843 Properties |
| 2014 | £515,310.00 | 10,890 Properties |
| 2013 | £475,818.00 | 10,223 Properties |
| 2012 | £444,753.00 | 8,516 Properties |
| 2011 | £432,493.00 | 8,523 Properties |
| 2010 | £428,562.00 | 8,460 Properties |
| 2009 | £382,453.00 | 7,317 Properties |
| 2008 | £407,597.00 | 6,549 Properties |
| 2007 | £399,020.00 | 13,637 Properties |
| 2006 | £356,807.00 | 14,694 Properties |
| 2005 | £330,544.00 | 10,987 Properties |
| 2004 | £317,579.00 | 12,349 Properties |
| 2003 | £285,096.00 | 11,382 Properties |
| 2002 | £270,278.00 | 13,947 Properties |
| 2001 | £241,553.00 | 13,161 Properties |
| 2000 | £225,624.00 | 11,699 Properties |
| 1999 | £183,232.00 | 13,966 Properties |
| 1998 | £163,023.00 | 11,645 Properties |
| 1997 | £139,419.00 | 13,039 Properties |
| 1996 | £124,963.00 | 11,580 Properties |
| 1995 | £120,230.00 | 9,025 Properties |
Property Price per Property Type in KT
Here you can find historic sold price data in order to help with your property search.
The average Property Paid Price for specific property types in the last three years are:
| Property Type | Average Sold Price | Sold Properties |
|---|---|---|
| Detached House | £1,260,780.00 | 6,021 Detached Houses |
| Flat | £355,740.00 | 7,989 Flats |
| Semi Detached House | £686,166.00 | 6,985 Semi Detached Houses |
| Terraced House | £557,203.00 | 5,321 Terraced Houses |
Houses and Flats for sale in KT, Kingston upon Thames

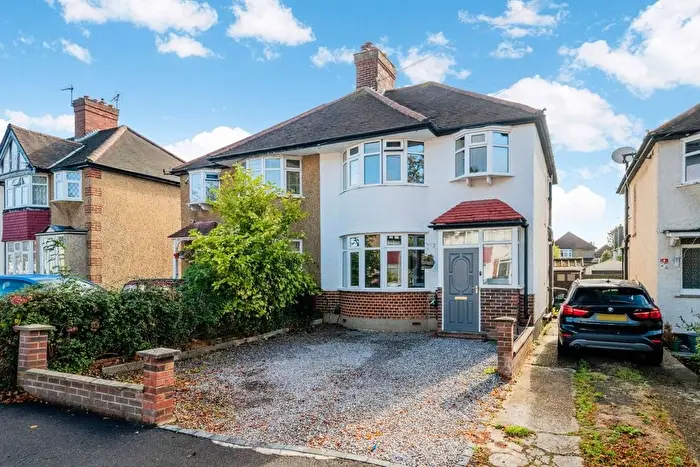
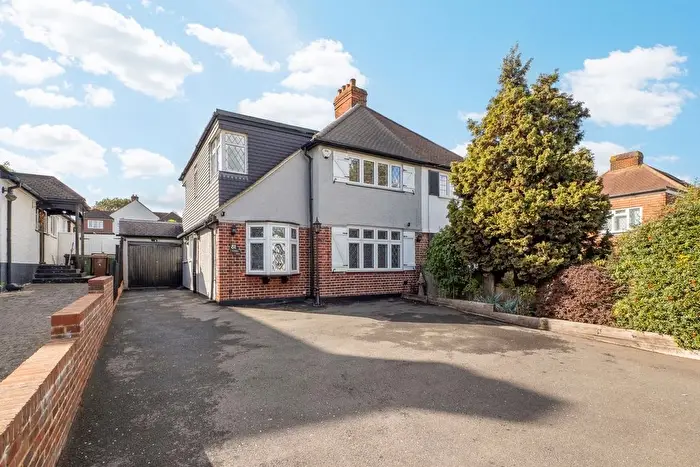
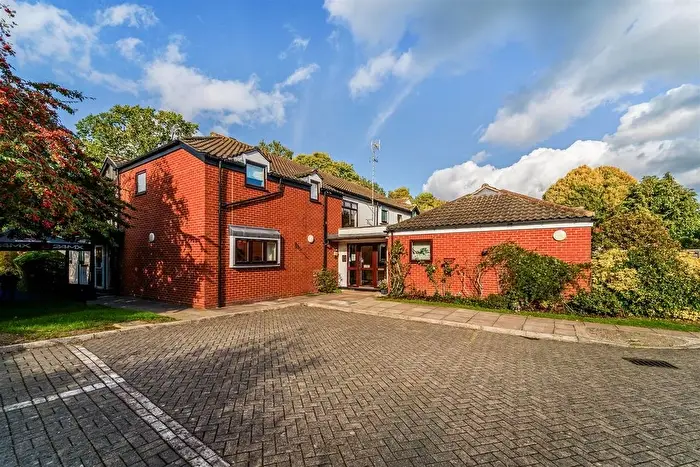
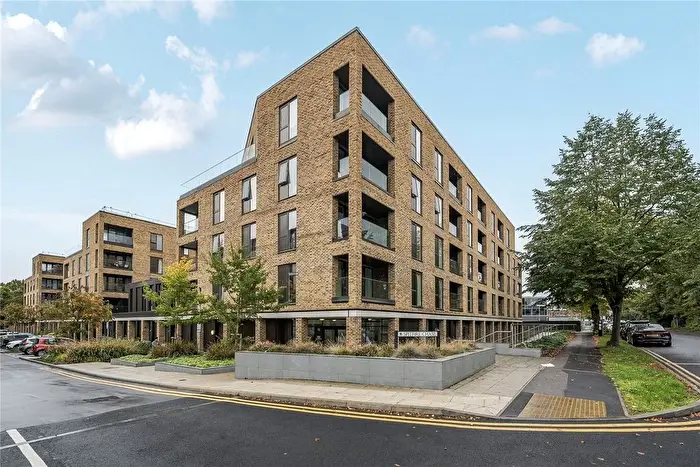
There are 5,134 results. Property prices in KT range from £175k to £6.82M with an average price of £761k.
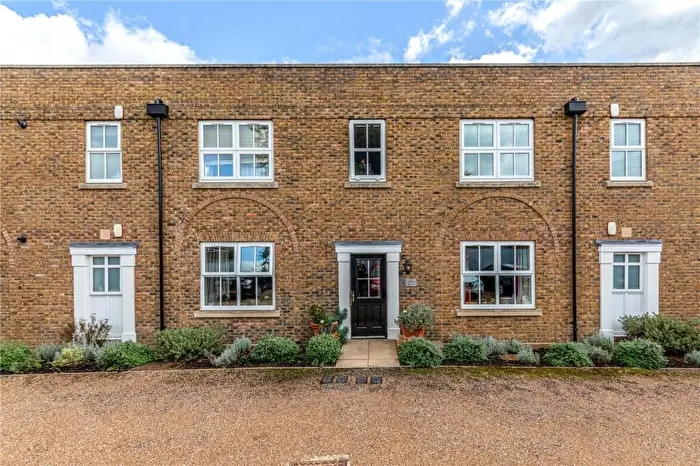

 2 Bedrooms
 2 Bathrooms




If you are looking to sell your house, let it out, or receive a property valuation, an expert can help you.
Click the button below to get started.









Postcode districts in KT, Kingston upon Thames
Navigate through our locations to find the location of your next house in KT, Kingston upon Thames, England for sale or to rent.
Transport in KT, Kingston upon Thames
Please see below transportation links in this area:
-
 Claygate Station
-
Hinchley Wood Station
-
Chessington South Station
-
Esher Station
-
Oxshott Station
-
Chessington North Station
-
Thames Ditton Station
-
Hersham Station
-
Surbiton Station
Frequently asked questions about KT
What is the average price for a property for sale in KT?
The average price for a property for sale in KT is £691,249. This amount is 92% higher than the average price in England. There are 5,134 property listings for sale in KT.
What locations have the most expensive properties for sale in KT?
The locations with the most expensive properties for sale in KT are KT11 at an average of £1,336,758, KT10 at an average of £1,073,833 and KT24 at an average of £1,042,988.
What locations have the most affordable properties for sale in KT?
The locations with the most affordable properties for sale in KT are KT15 at an average of £458,082, KT9 at an average of £462,848 and KT16 at an average of £476,319.
Which train stations are available in or near KT?
Some of the train stations available in or near KT are Claygate, Hinchley Wood and Chessington South.