
Properties for sale in TW16
Sunbury-on-thames
- Info
- Price Paid By Year
- Property Type Price
- Transport
House Prices in TW16
Properties in TW16 have an average house price of £523,149.00 and had 884 Property Transactions within the last 3 years.
The most expensive property was sold for £2,900,000.00.
Property Price Paid in TW16 by Year
The average sold property price by year was:
| Year | Average Sold Price | Sold Properties |
|---|---|---|
| 2026 | £478,461.00 | 13 Properties |
| 2025 | £534,276.00 | 282 Properties |
| 2024 | £516,225.00 | 300 Properties |
| 2023 | £521,491.00 | 289 Properties |
| 2022 | £534,480.00 | 340 Properties |
| 2021 | £497,788.00 | 436 Properties |
| 2020 | £484,004.00 | 269 Properties |
| 2019 | £440,851.00 | 300 Properties |
| 2018 | £478,097.00 | 329 Properties |
| 2017 | £471,427.00 | 383 Properties |
| 2016 | £468,886.00 | 449 Properties |
| 2015 | £378,863.00 | 373 Properties |
| 2014 | £352,647.00 | 438 Properties |
| 2013 | £347,061.00 | 331 Properties |
| 2012 | £316,751.00 | 266 Properties |
| 2011 | £312,538.00 | 260 Properties |
| 2010 | £329,046.00 | 275 Properties |
| 2009 | £287,376.00 | 245 Properties |
| 2008 | £279,796.00 | 224 Properties |
| 2007 | £294,944.00 | 593 Properties |
| 2006 | £272,081.00 | 531 Properties |
| 2005 | £247,049.00 | 334 Properties |
| 2004 | £226,485.00 | 506 Properties |
| 2003 | £228,656.00 | 468 Properties |
| 2002 | £211,385.00 | 553 Properties |
| 2001 | £189,394.00 | 495 Properties |
| 2000 | £163,104.00 | 414 Properties |
| 1999 | £134,262.00 | 457 Properties |
| 1998 | £125,131.00 | 409 Properties |
| 1997 | £102,193.00 | 399 Properties |
| 1996 | £97,003.00 | 408 Properties |
| 1995 | £100,841.00 | 287 Properties |
Property Price per Property Type in TW16
Here you can find historic sold price data in order to help with your property search.
The average Property Paid Price for specific property types in the last three years are:
| Property Type | Average Sold Price | Sold Properties |
|---|---|---|
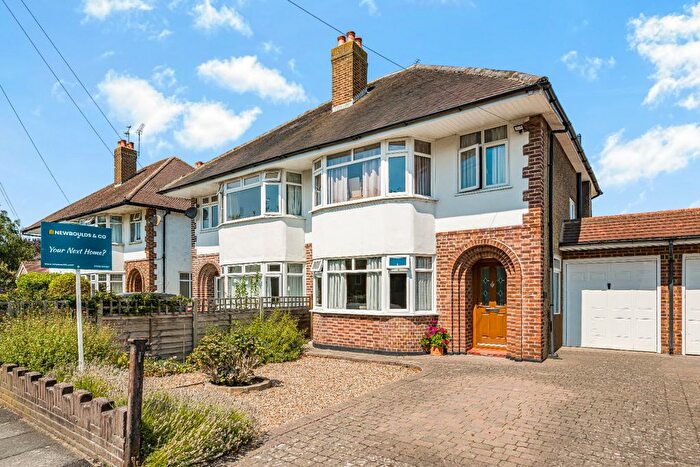
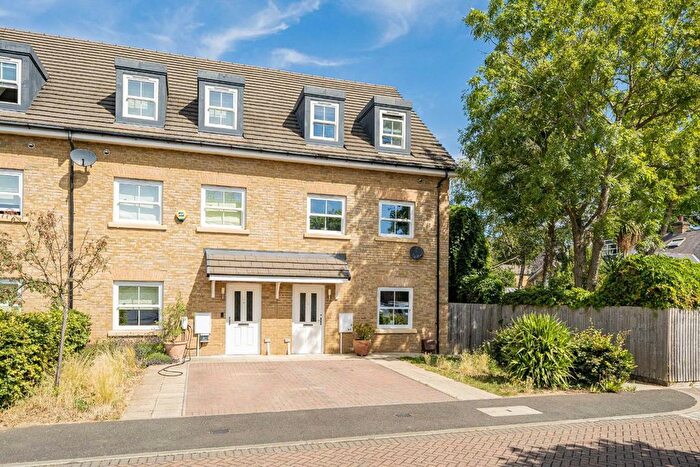
| Semi Detached House | £566,938.00 | 241 Semi Detached Houses |
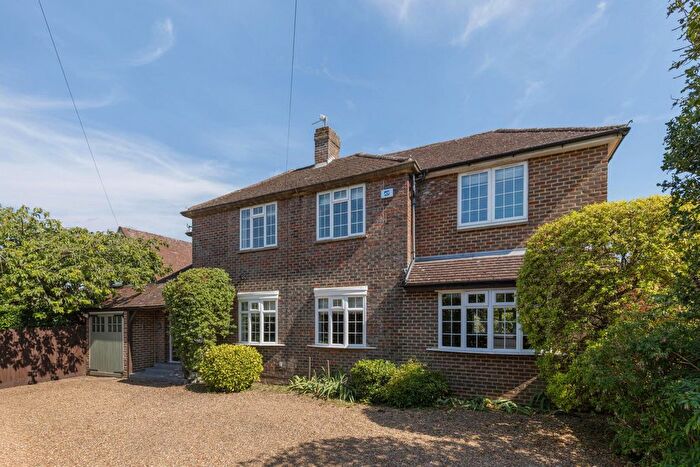
| Detached House | £868,986.00 | 181 Detached Houses |
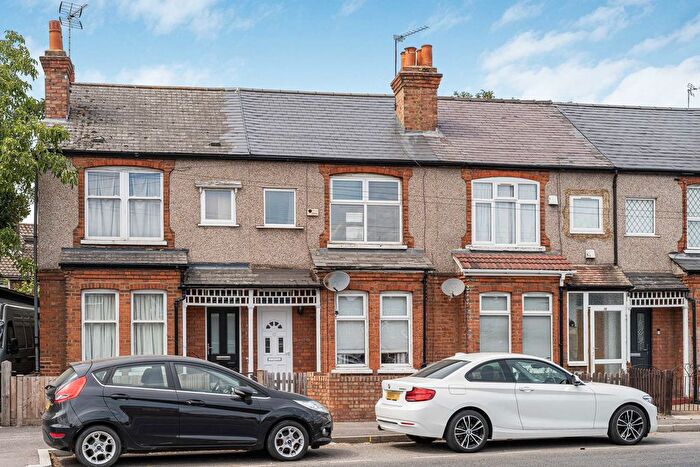
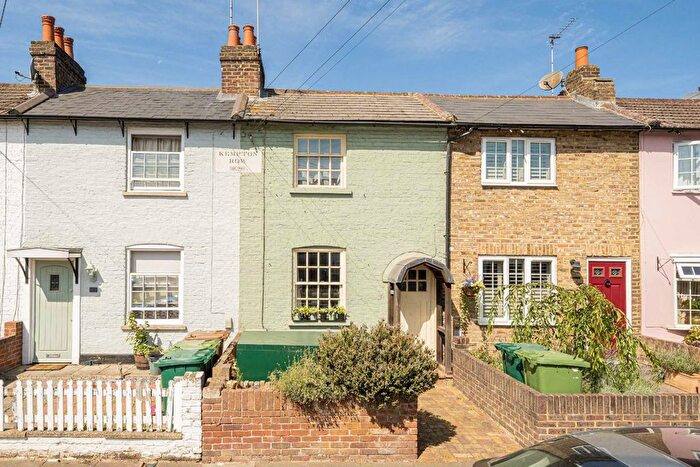
| Terraced House | £467,819.00 | 220 Terraced Houses |
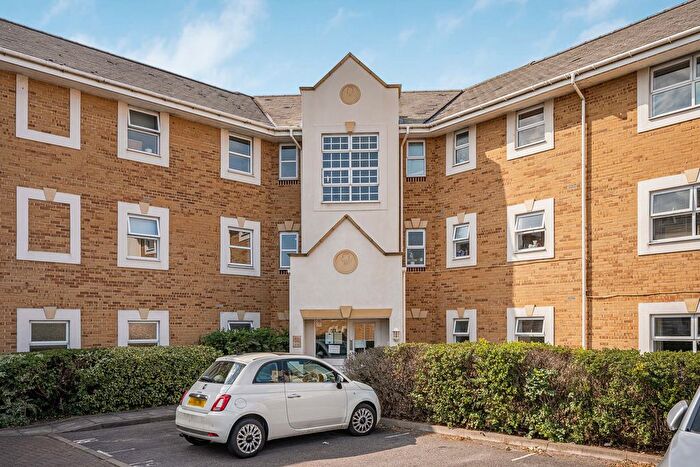
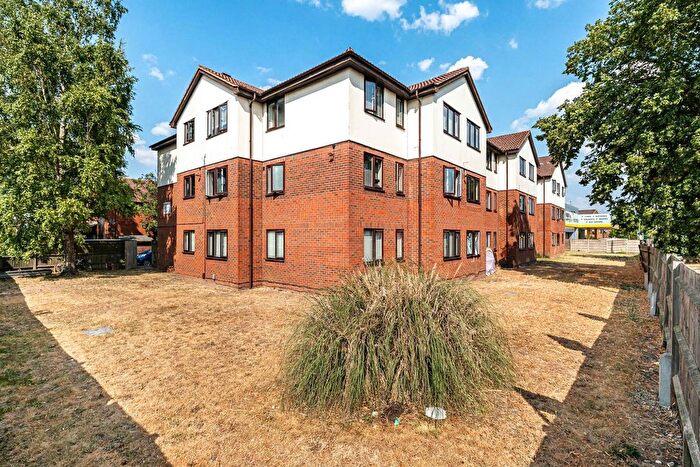
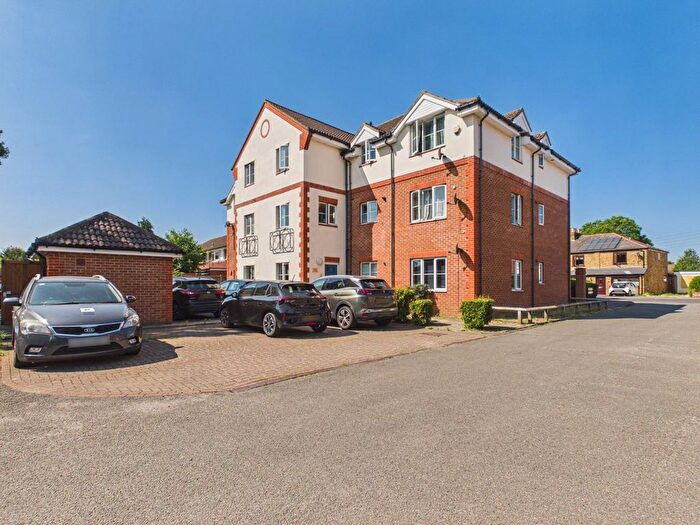
| Flat | £271,179.00 | 242 Flats |

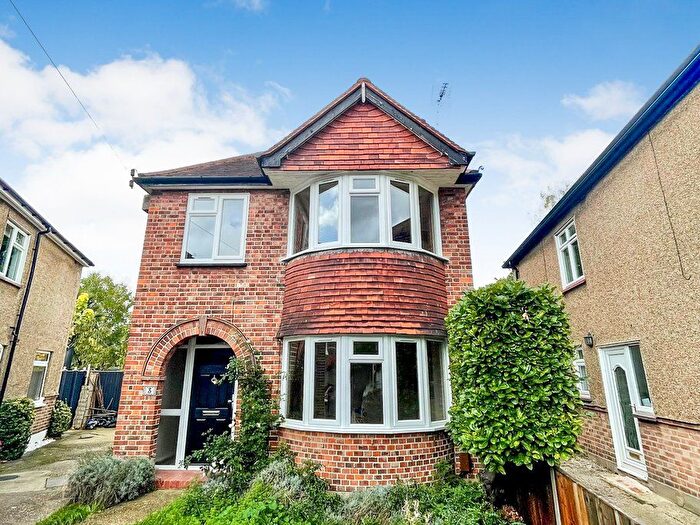
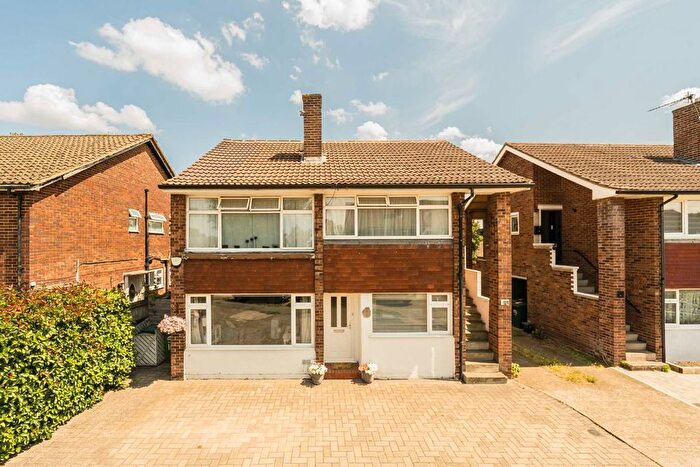
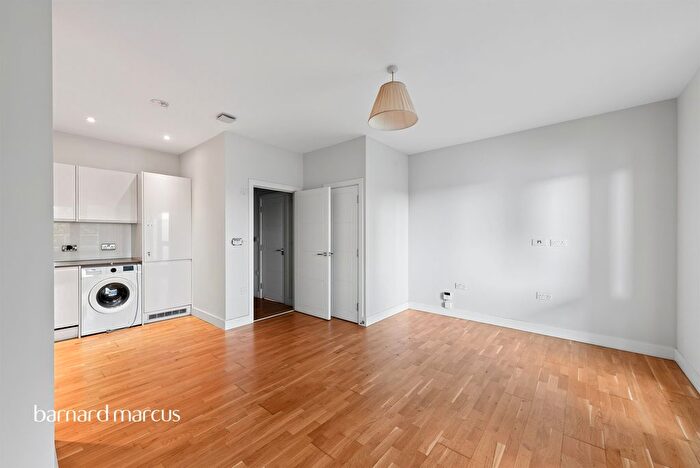
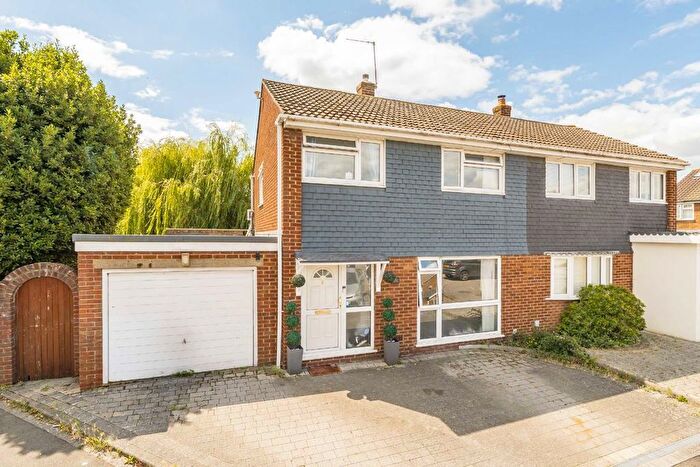
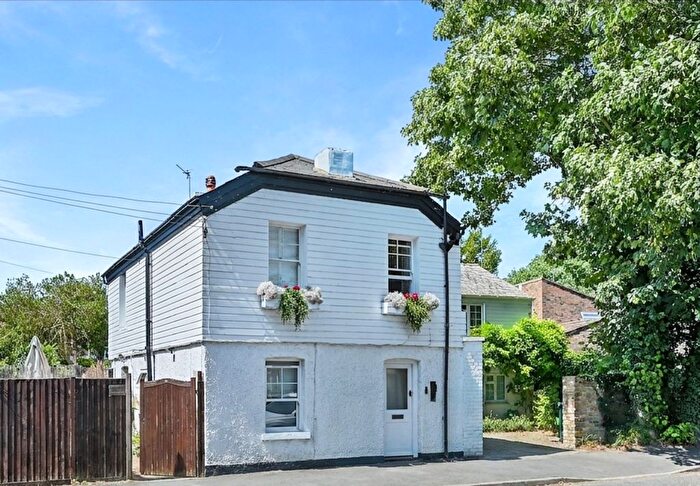
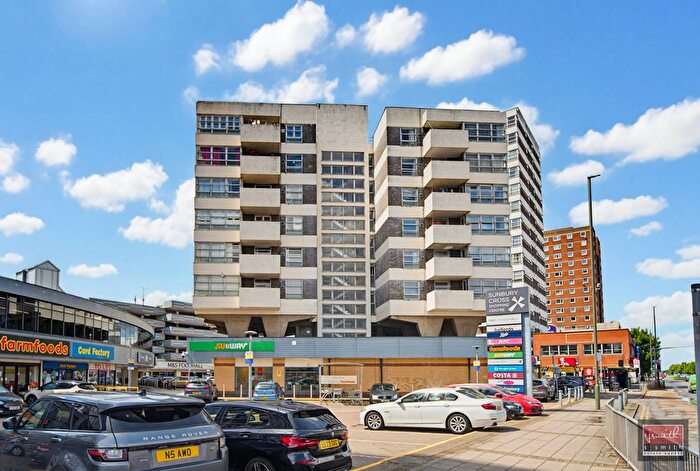
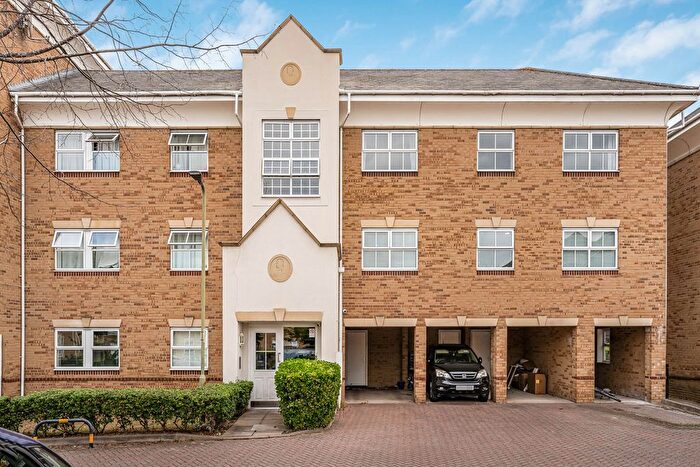
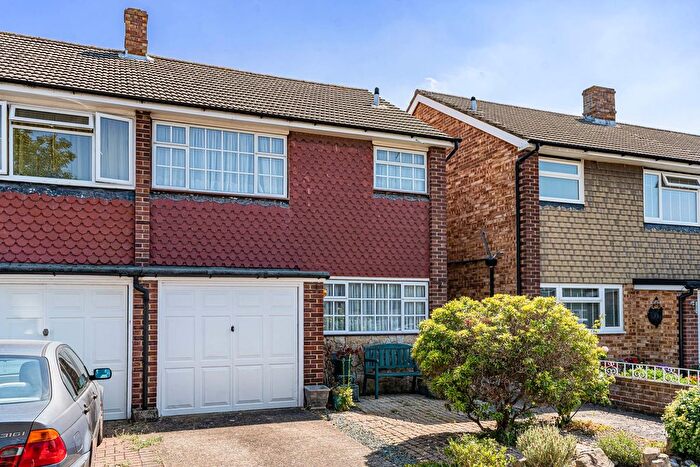
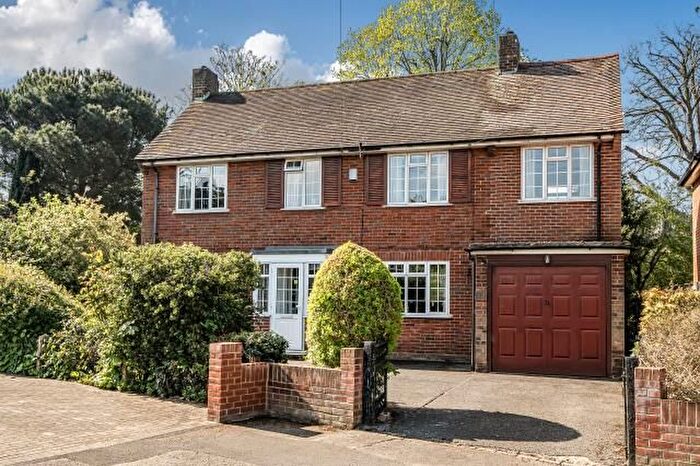
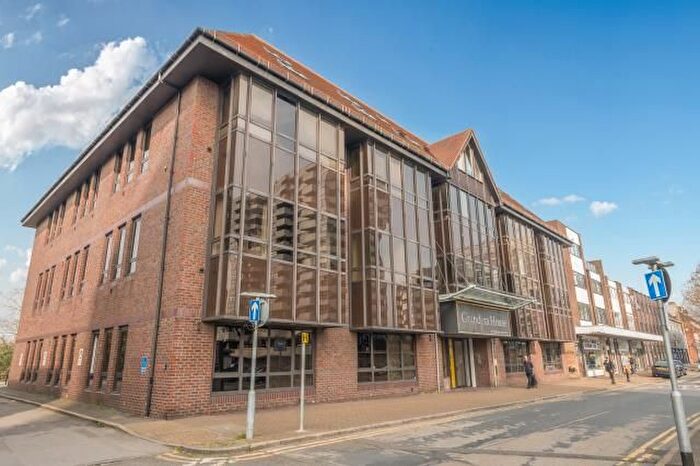
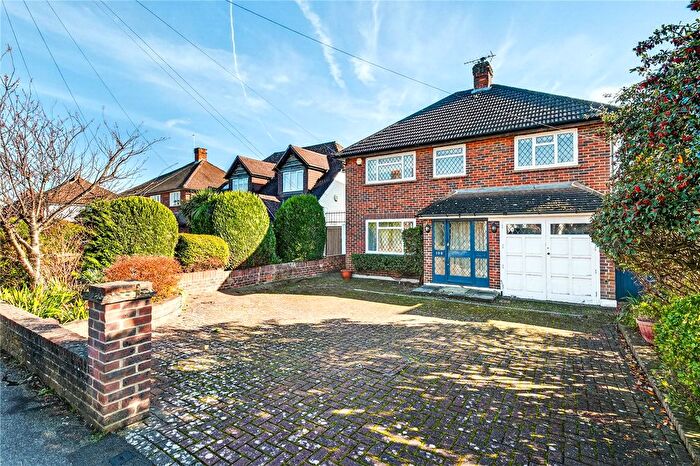
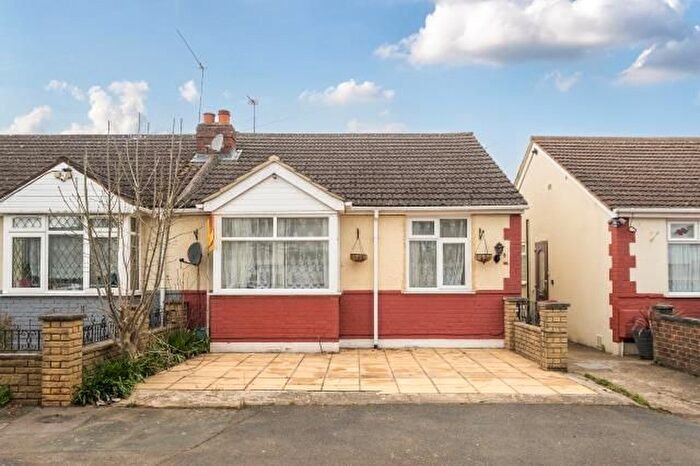
Houses and Flats for sale in TW16, Sunbury-on-thames
There are 30 results. Property prices in TW16 range from £165k to £1.38M with an average price of £507k.
![]()
If you are looking to sell your house, let it out, or receive a property valuation, an expert can help you.
Click the button below to get started.
Frequently Asked Questions about TW16
What is the average price for a property for sale in TW16?
The average price for a property for sale in TW16 is £523,149. There are 30 property listings for sale in TW16.
Which areas are included in the TW16 postcode district?
The main area within TW16 is Sunbury-on-thames.
What are the most common property types in TW16?
The most common property types in TW16 are Flats, Semi Detached Houses, Terraced Houses and Detached Houses.
What has been the average sold property price in TW16 over the last three years?
Flats in TW16 have an average sold price of £271,179, while Semi Detached Houses have an average of £566,938. Terraced Houses have an average of £467,819 and Detached Houses have an average of £868,986. The average sold property price in TW16 over the last three years is approximately £509,654.
Which train stations are available in TW16?
The train stations available in TW16 are Kempton Park Station, Sunbury Station and Upper Halliford Station..