
Properties for sale in KW1
Wick
- Info
- Price Paid By Year
- Transport
House Prices in KW1
Properties in KW1 have an average house price of £121,341.00 and had 170 Property Transactions within the last 3 years.
The most expensive property was sold for £337,500.00.
Property Price Paid in KW1 by Year
The average sold property price by year was:
| Year | Average Sold Price | Sold Properties |
|---|---|---|
| 2025 | £124,657.00 | 59 Properties |
| 2024 | £106,756.00 | 47 Properties |
| 2023 | £128,995.00 | 64 Properties |
| 2022 | £134,676.00 | 164 Properties |
| 2021 | £122,347.00 | 209 Properties |
| 2020 | £116,829.00 | 123 Properties |
| 2019 | £110,552.00 | 156 Properties |
| 2018 | £102,997.00 | 155 Properties |
| 2017 | £104,560.00 | 139 Properties |
| 2016 | £108,224.00 | 166 Properties |
| 2015 | £104,339.00 | 134 Properties |
| 2014 | £95,742.00 | 129 Properties |
| 2013 | £97,560.00 | 132 Properties |
| 2012 | £116,189.00 | 116 Properties |
| 2011 | £90,636.00 | 98 Properties |
| 2010 | £89,946.00 | 111 Properties |
| 2009 | £116,531.00 | 112 Properties |
| 2008 | £87,823.00 | 194 Properties |
| 2007 | £82,240.00 | 227 Properties |
| 2006 | £83,379.00 | 200 Properties |
| 2005 | £56,189.00 | 171 Properties |
| 2004 | £51,843.00 | 208 Properties |
| 2003 | £42,387.00 | 129 Properties |
| 2002 | £48,598.00 | 54 Properties |
| 2001 | £55,772.00 | 40 Properties |
| 2000 | £43,954.00 | 10 Properties |
Transport near KW1

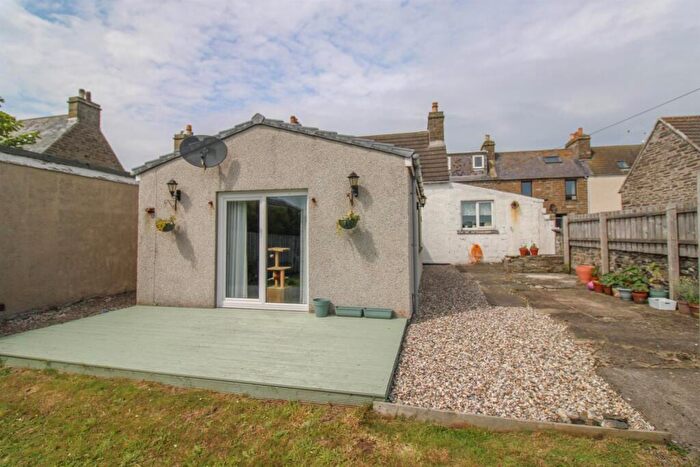
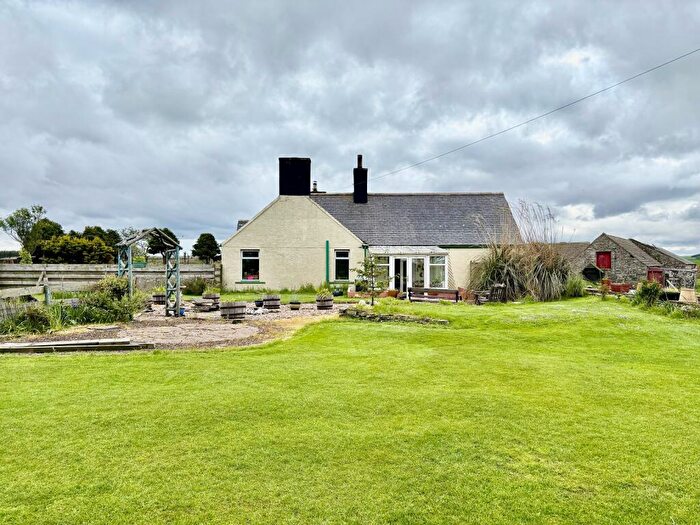
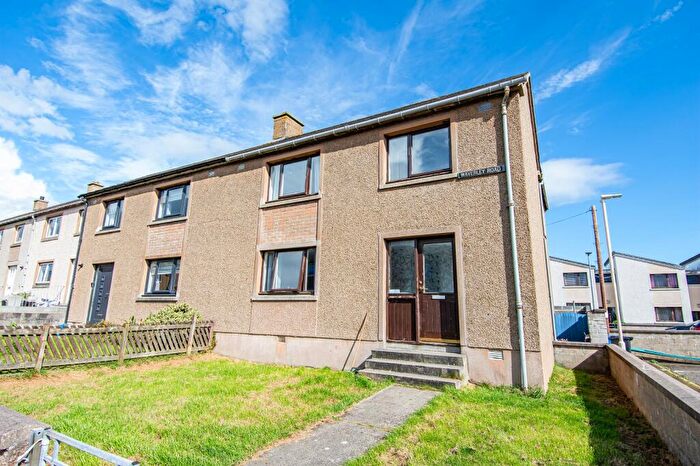
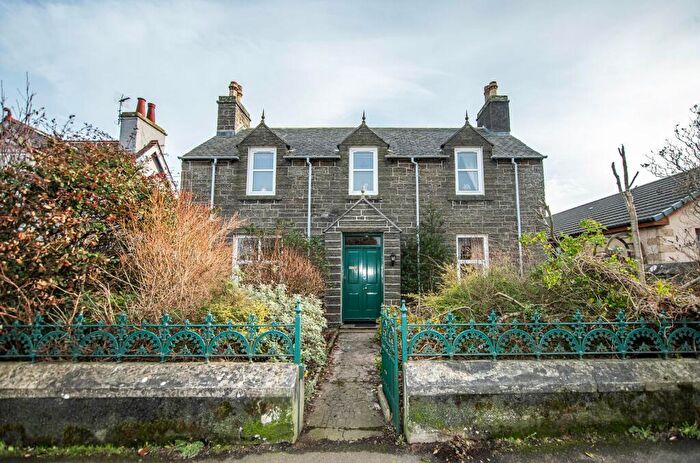
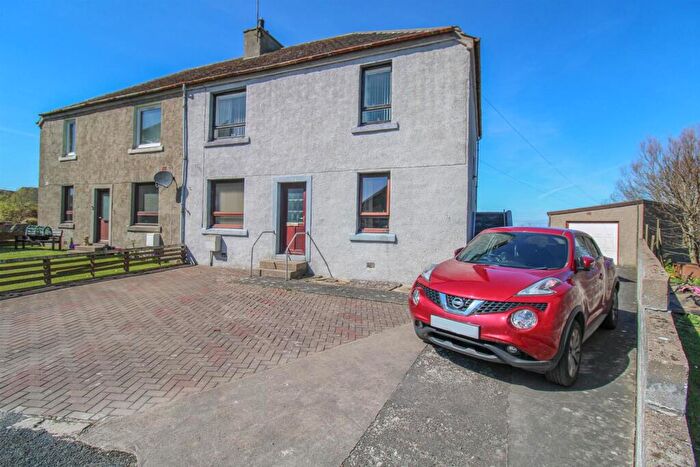
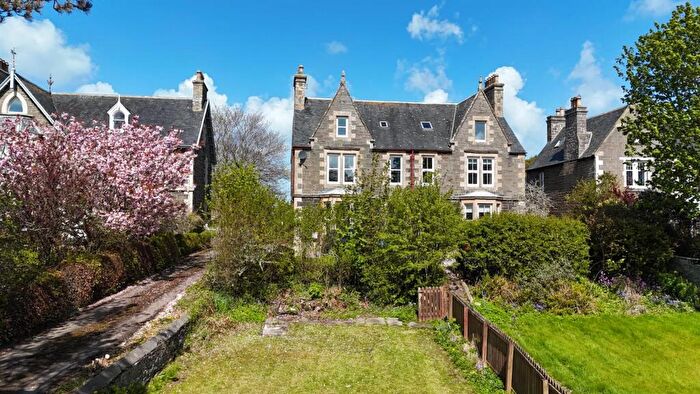
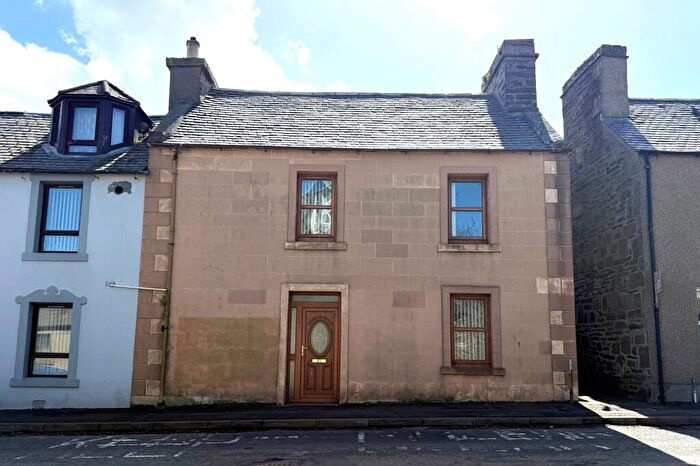
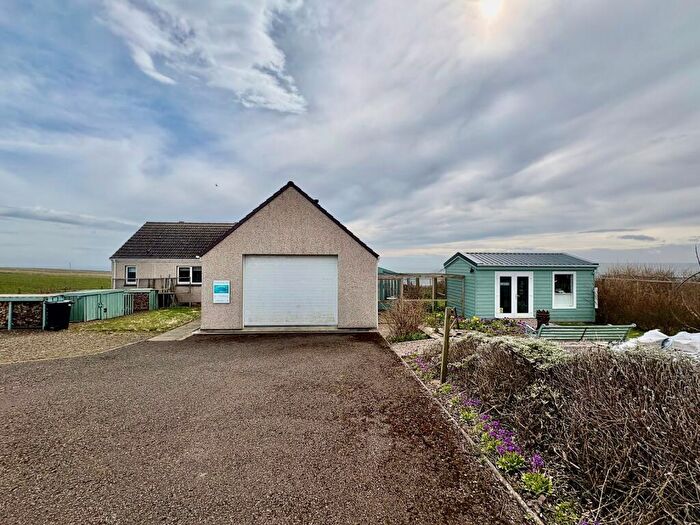
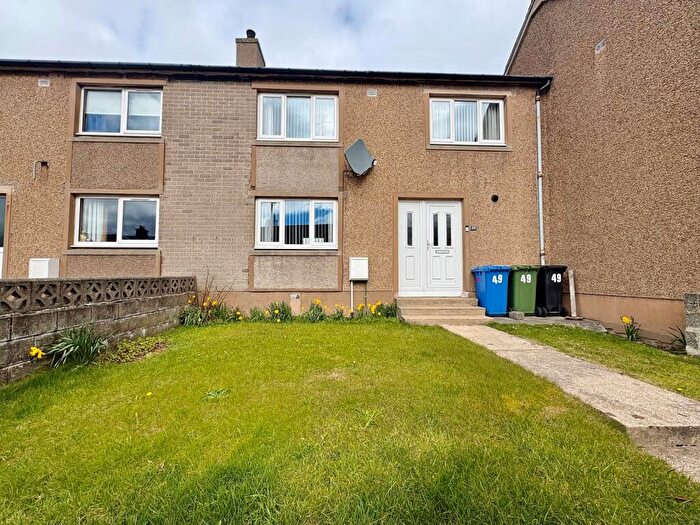
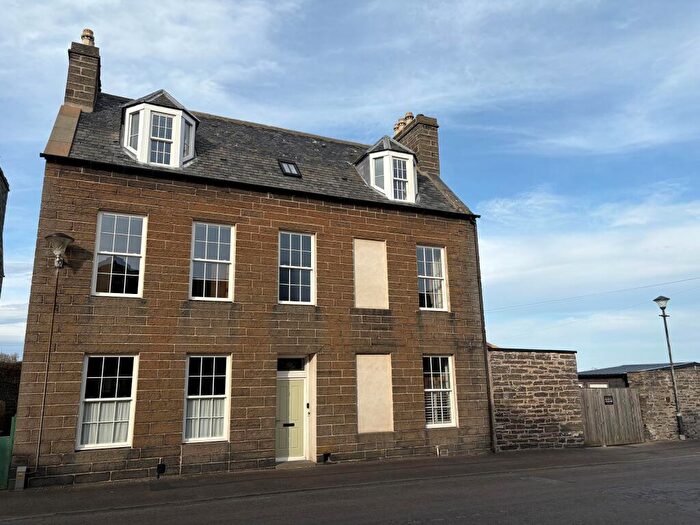
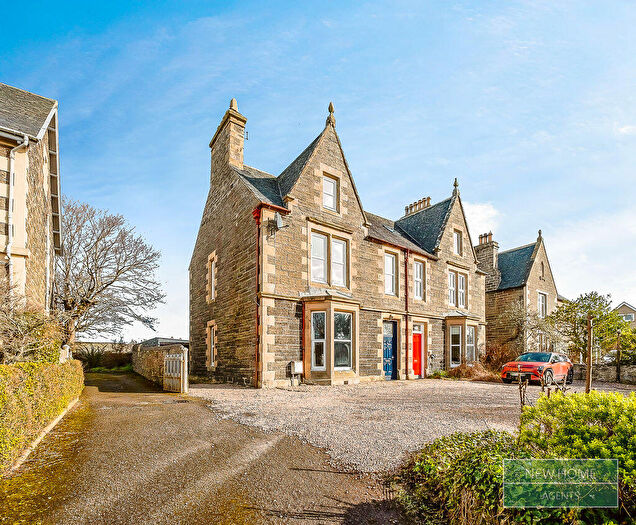
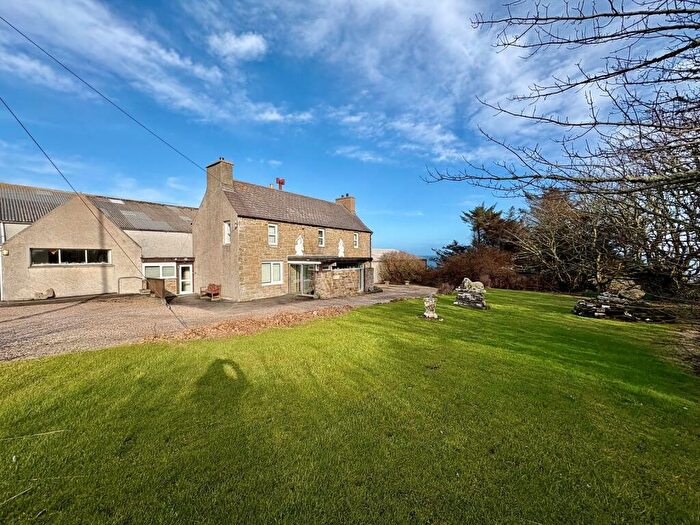
Houses and Flats for sale in KW1, Wick
There are 42 results. Property prices in KW1 range from £52k to £495k with an average price of £208k.

![]()
If you are looking to sell your house, let it out, or receive a property valuation, an expert can help you.
Click the button below to get started.
Frequently Asked Questions about KW1
What is the average price for a property for sale in KW1?
The average price for a property for sale in KW1 is £121,341. There are 42 property listings for sale in KW1.
Which areas are included in the KW1 postcode district?
The main area within KW1 is Wick.
What are the most common property types in KW1?
The most common property types in KW1 are Unknowns.
What has been the average sold property price in KW1 over the last three years?
Unknowns in KW1 have an average sold price of £121,341. The average sold property price in KW1 over the last three years is approximately £120,136.
Which train stations are available in KW1?
The train stations available in KW1 are Altnabreac Station, Dunrobin Castle Station, Forsinard Station, Georgemas Junction Station, Golspie Station, Kinbrace Station, Scotscalder Station, Thurso Station and Wick Station..