
Properties for sale in KW2
Lybster
- Info
- Price Paid By Year
- Transport
House Prices in KW2
Properties in KW2 have no sales history available within the last 3 years.
Property Price Paid in KW2 by Year
Loading ...
The average sold property price by year was:
| Year | Average Sold Price | Sold Properties |
|---|---|---|
| 2021 | £165,666.00 | 3 Properties |
| 2020 | £65,000.00 | 1 Properties |
| 2017 | £102,500.00 | 1 Properties |
| 2016 | £87,500.00 | 2 Properties |
| 2015 | £65,000.00 | 1 Properties |
| 2014 | £140,000.00 | 2 Properties |
| 2010 | £150,000.00 | 1 Properties |
| 2009 | £63,750.00 | 2 Properties |
| 2008 | £135,000.00 | 1 Properties |
| 2007 | £5,000.00 | 1 Properties |
| 2006 | £94,000.00 | 4 Properties |
| 2005 | £33,000.00 | 1 Properties |
| 2004 | £94,000.00 | 1 Properties |
| 2003 | £24,000.00 | 1 Properties |
Transport near KW2

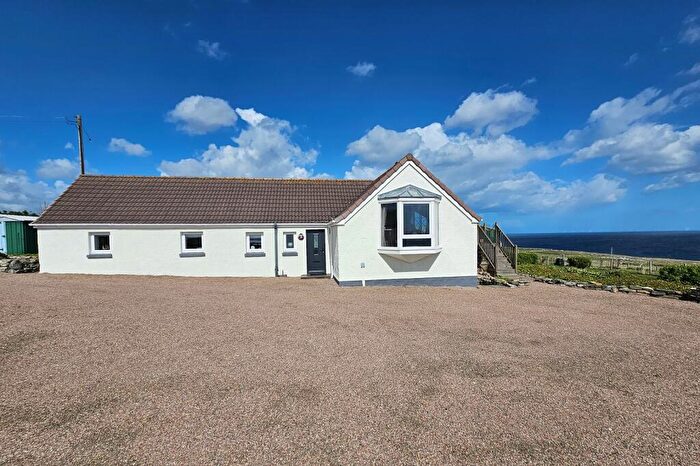
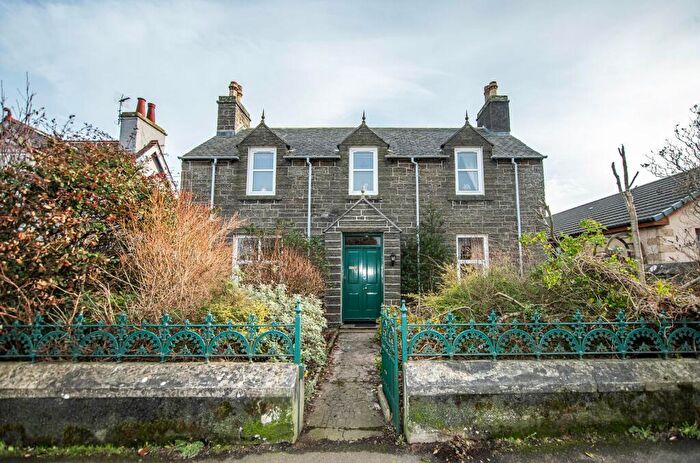
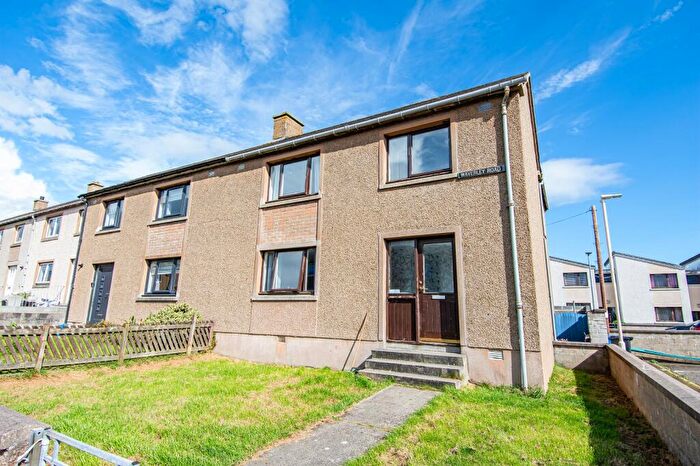
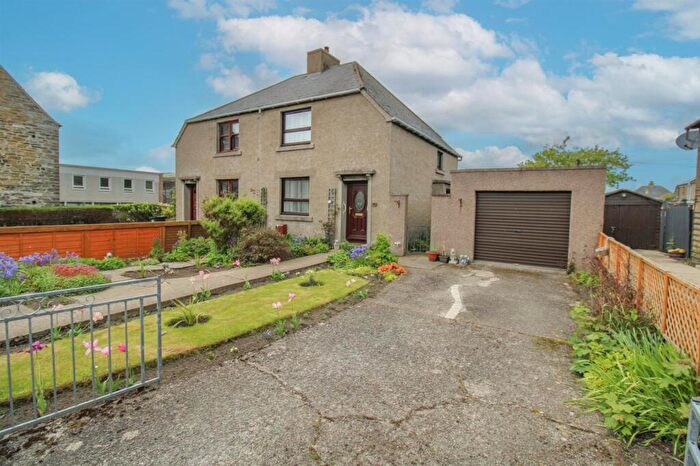
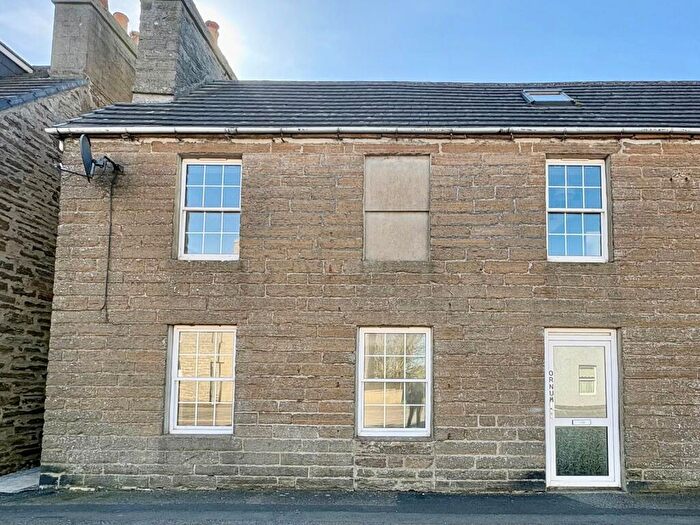
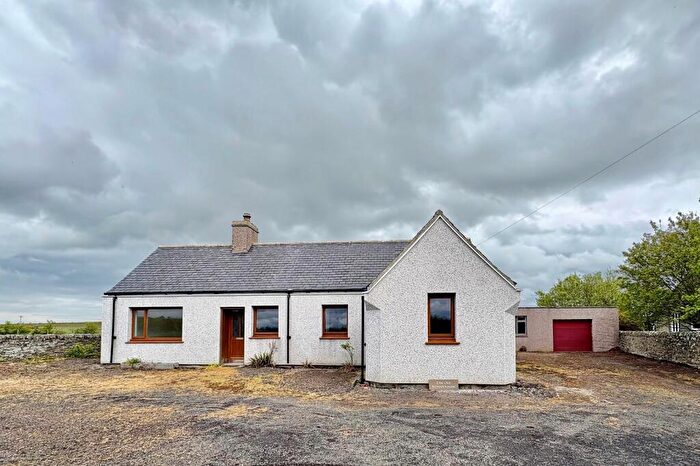
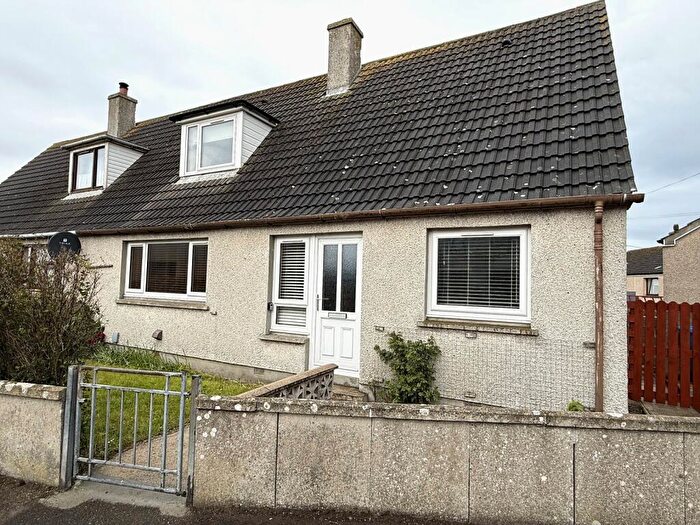
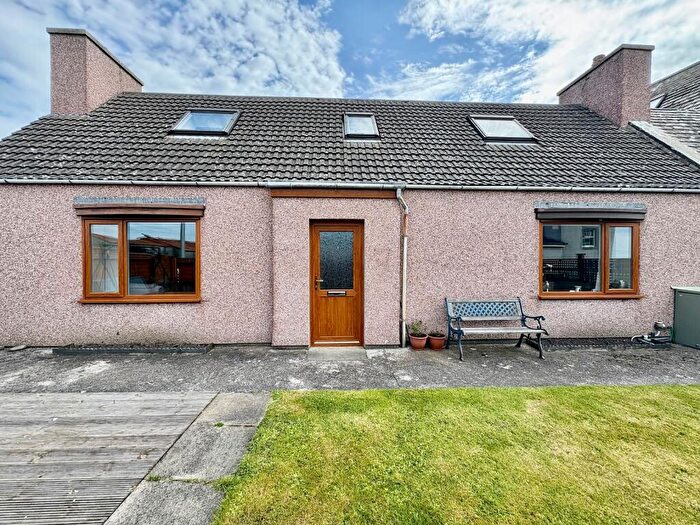
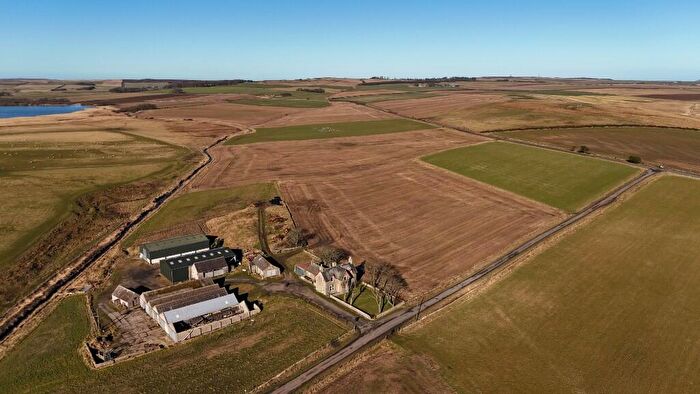
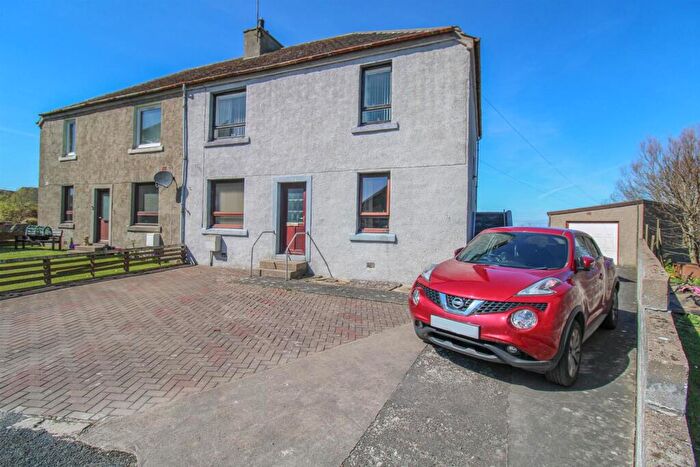
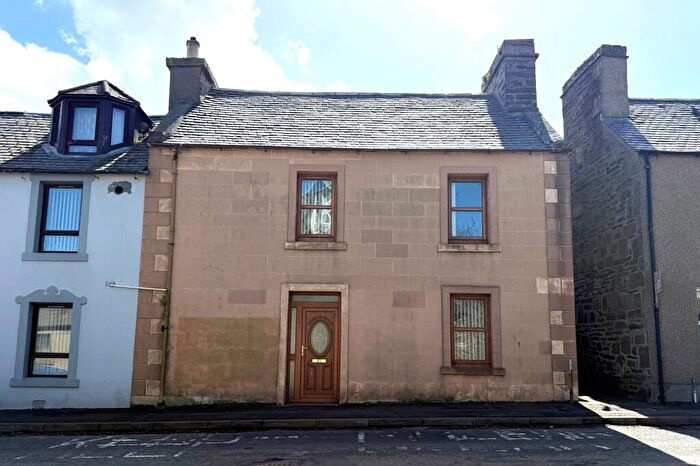
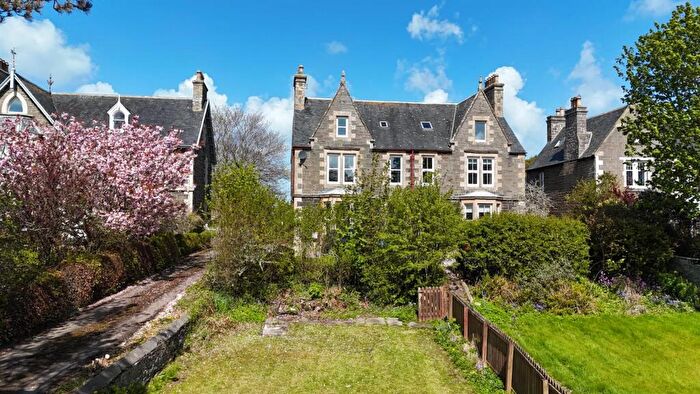
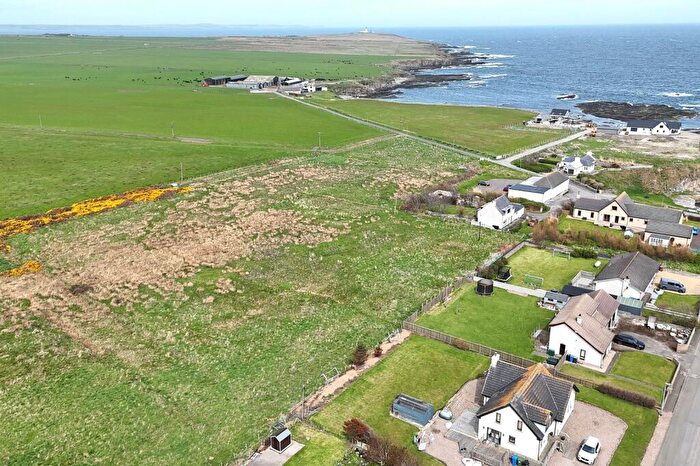
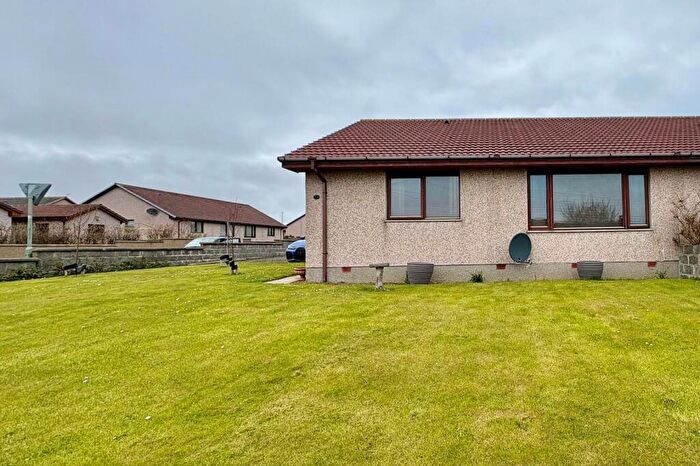
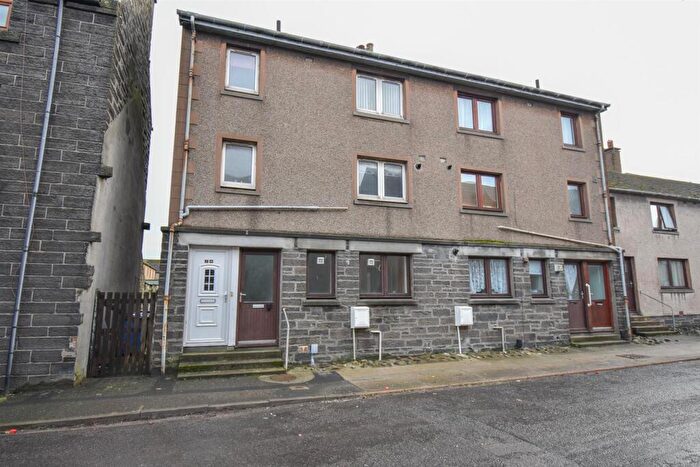
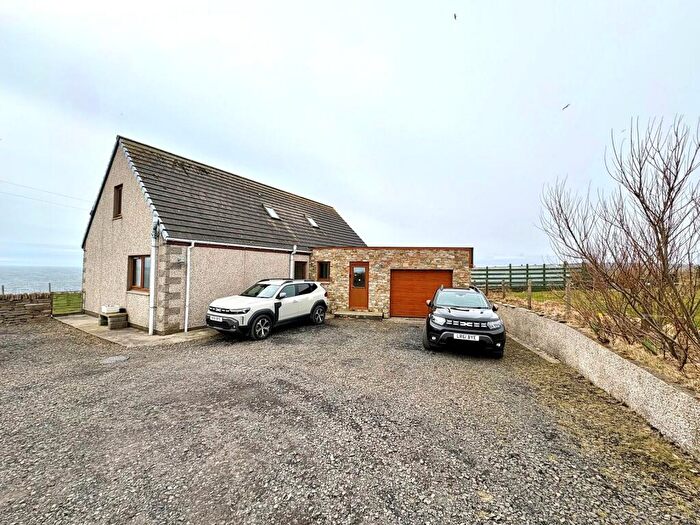
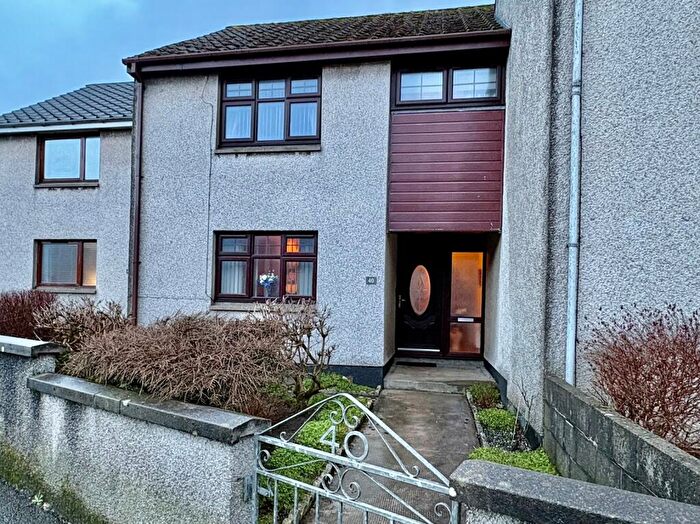
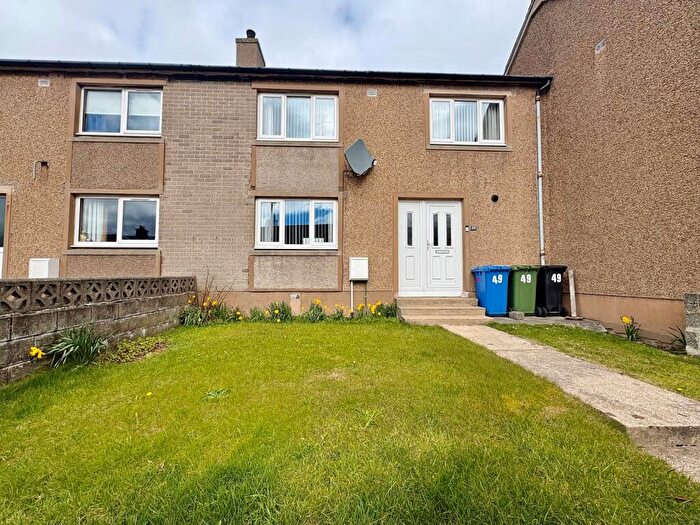
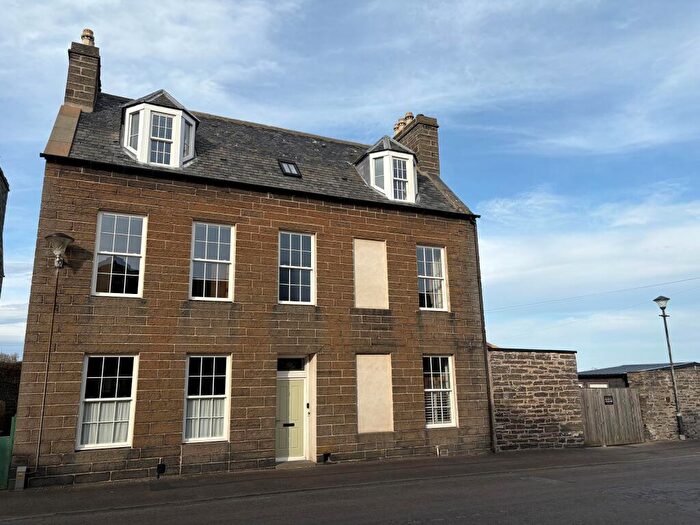
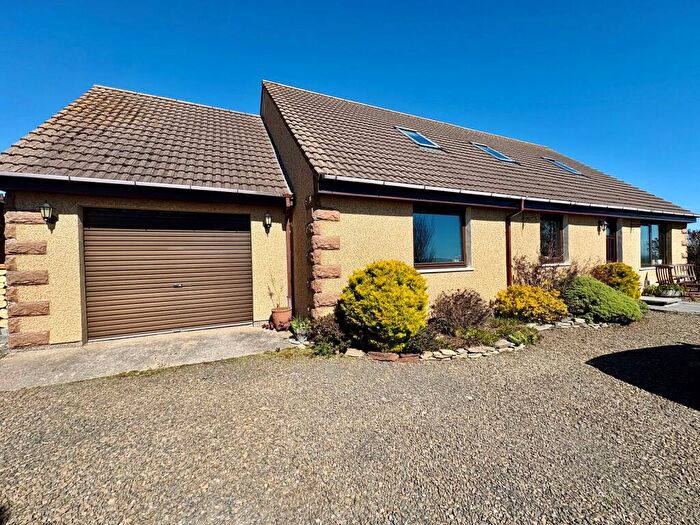
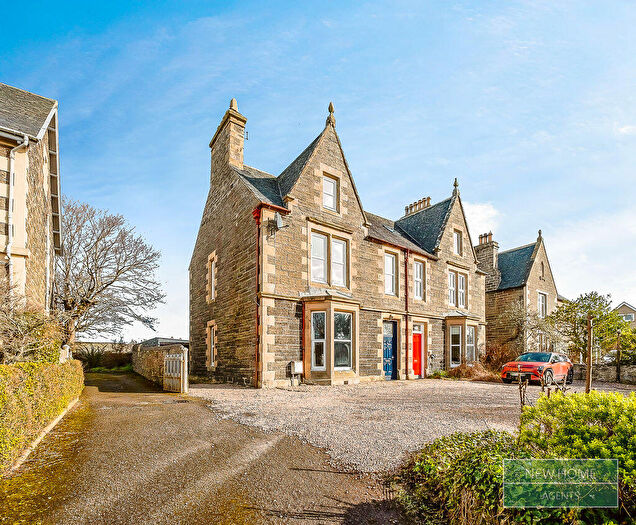
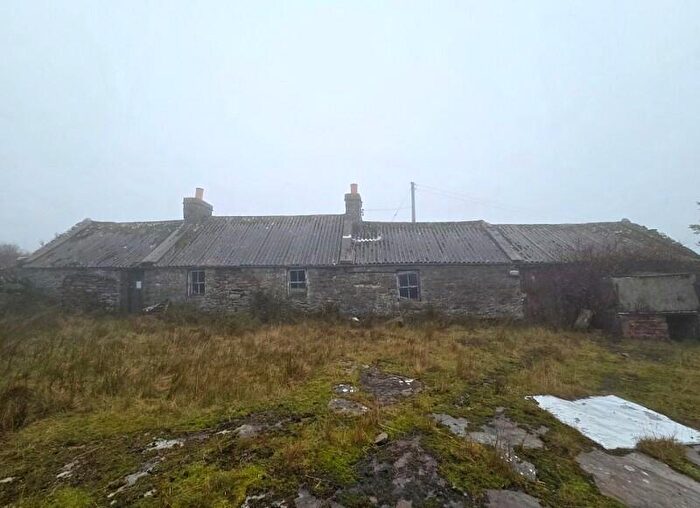
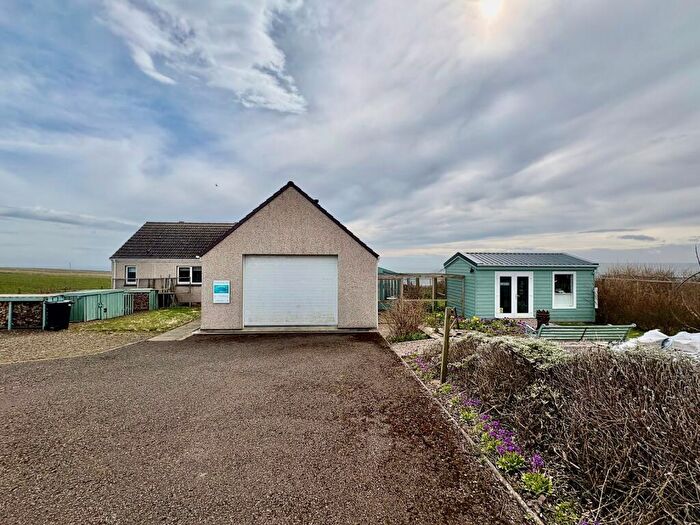
Houses and Flats for sale in KW2, Lybster
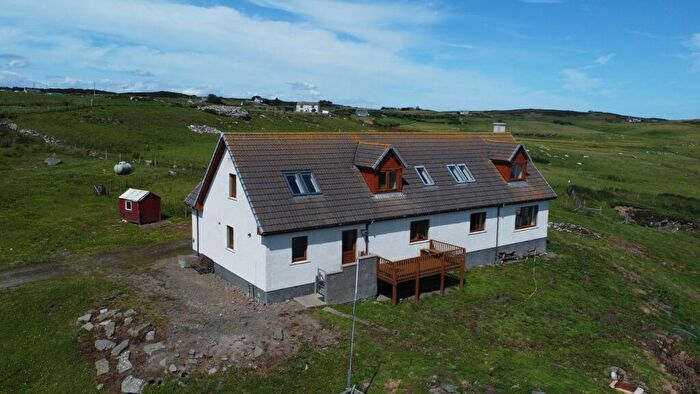
Properties for sale near KW2
![]()
If you are looking to sell your house, let it out, or receive a property valuation, an expert can help you.
Click the button below to get started.
Frequently Asked Questions about KW2
What is the average price for a property for sale in KW2?
The average price for a property for sale in KW2 is £0. There is 1 property listing for sale in KW2.
Which areas are included in the KW2 postcode district?
The main area within KW2 is Lybster.
What are the most common property types in KW2?
The most common property types in KW2 are and .
What has been the average sold property price in KW2 over the last three years?