
Properties for sale in L
Liverpool
- Info
- Price Paid By Year
- Property Type Price
House Prices in L
Properties in L have an average house price of £202,175 and had 39034 Property Transactions within the last 3 years.
The most expensive property was sold for £3,971,025.
Property Price Paid in L by Year
The average sold property price by year was:
| Year | Average Sold Price | Sold Properties |
|---|---|---|
| 2025 | £213,517.00 | 4,753 Properties |
| 2024 | £205,488.00 | 10,651 Properties |
| 2023 | £199,949.00 | 10,679 Properties |
| 2022 | £197,123.00 | 12,951 Properties |
| 2021 | £193,062.00 | 15,090 Properties |
| 2020 | £173,656.00 | 11,727 Properties |
| 2019 | £160,879.00 | 14,758 Properties |
| 2018 | £157,090.00 | 15,025 Properties |
| 2017 | £155,239.00 | 14,198 Properties |
| 2016 | £147,971.00 | 13,259 Properties |
| 2015 | £146,792.00 | 11,890 Properties |
| 2014 | £141,085.00 | 11,059 Properties |
| 2013 | £137,411.00 | 8,758 Properties |
| 2012 | £140,465.00 | 6,623 Properties |
| 2011 | £139,929.00 | 6,717 Properties |
| 2010 | £142,619.00 | 6,485 Properties |
| 2009 | £144,229.00 | 5,959 Properties |
| 2008 | £140,451.00 | 8,462 Properties |
| 2007 | £146,076.00 | 15,786 Properties |
| 2006 | £140,188.00 | 15,856 Properties |
| 2005 | £130,820.00 | 13,190 Properties |
| 2004 | £118,628.00 | 16,504 Properties |
| 2003 | £93,167.00 | 17,273 Properties |
| 2002 | £78,527.00 | 15,439 Properties |
| 2001 | £70,473.00 | 13,189 Properties |
| 2000 | £63,687.00 | 13,005 Properties |
| 1999 | £60,667.00 | 12,588 Properties |
| 1998 | £54,968.00 | 11,847 Properties |
| 1997 | £52,737.00 | 11,499 Properties |
| 1996 | £50,663.00 | 10,913 Properties |
| 1995 | £48,570.00 | 9,856 Properties |
Property Price per Property Type in L
Here you can find historic sold price data in order to help with your property search.
The average Property Paid Price for specific property types in the last three years are:
| Property Type | Average Sold Price | Sold Properties |
|---|---|---|
| Semi Detached House | £231,500.00 | 12,499 Semi Detached Houses |
| Terraced House | £148,360.00 | 16,571 Terraced Houses |
| Flat | £145,333.00 | 5,787 Flats |
| Detached House | £406,672.00 | 4,177 Detached Houses |
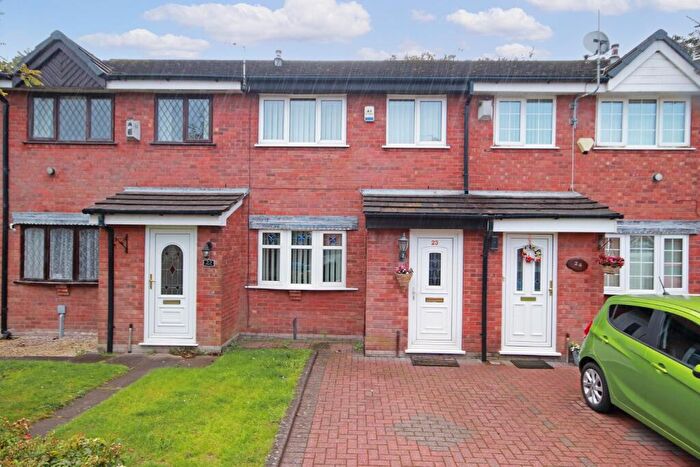
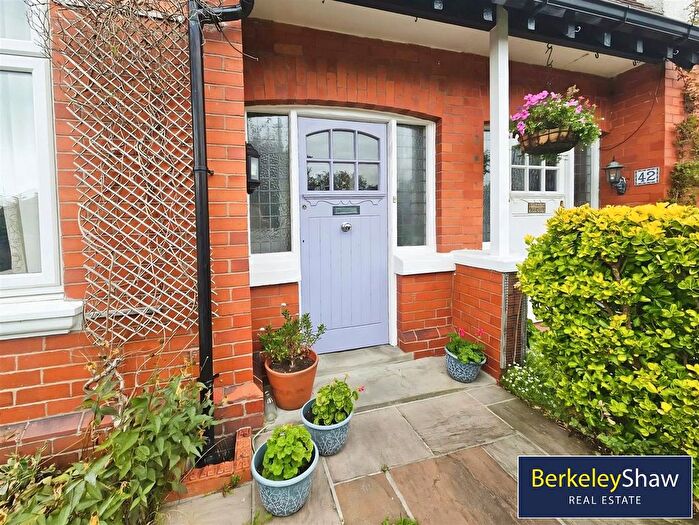
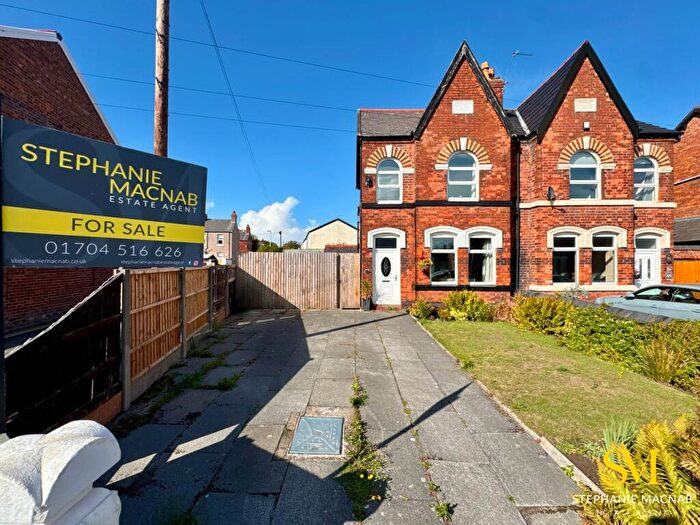
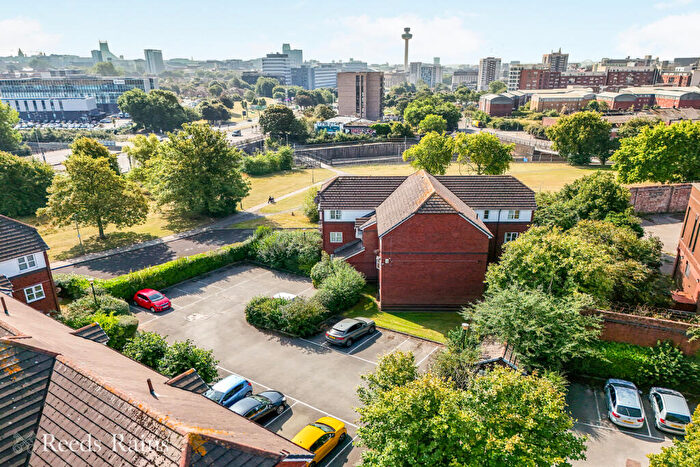
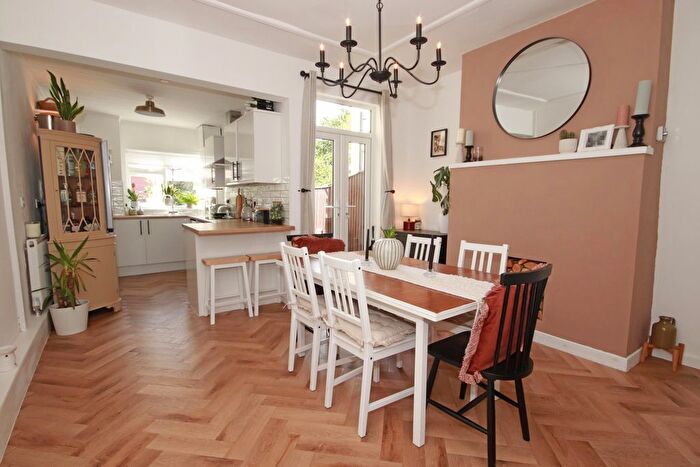
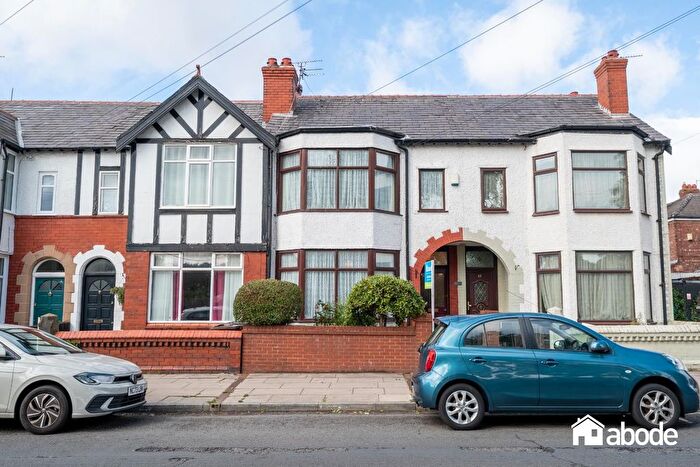
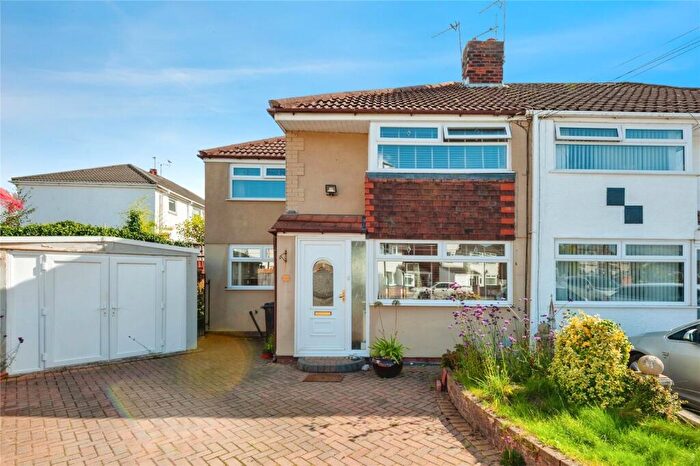
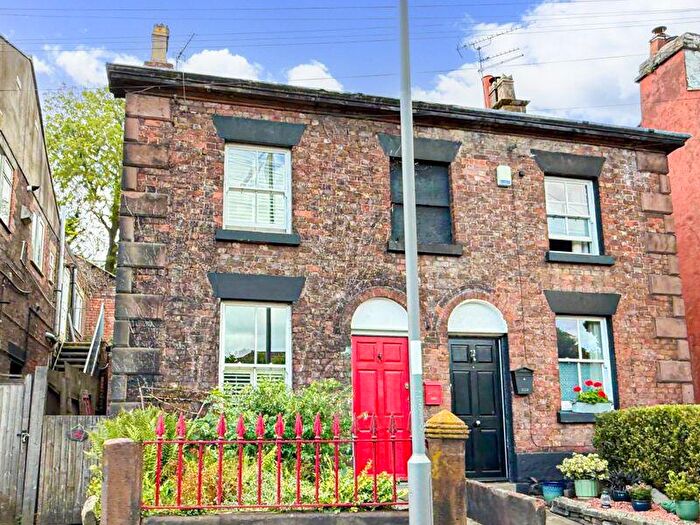
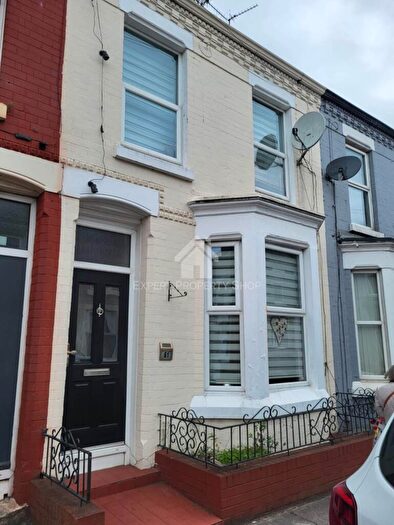
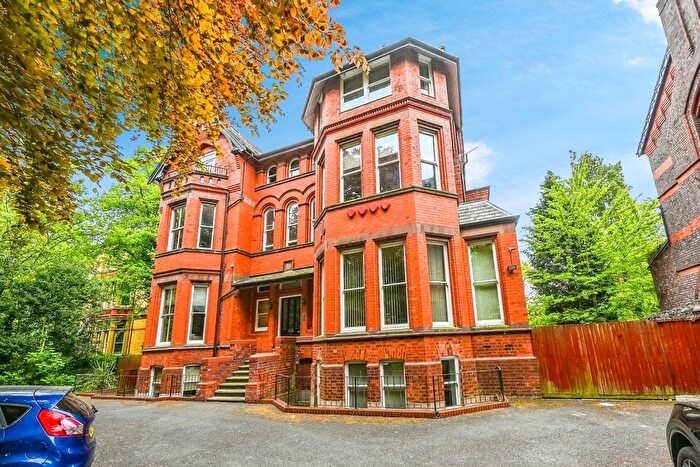
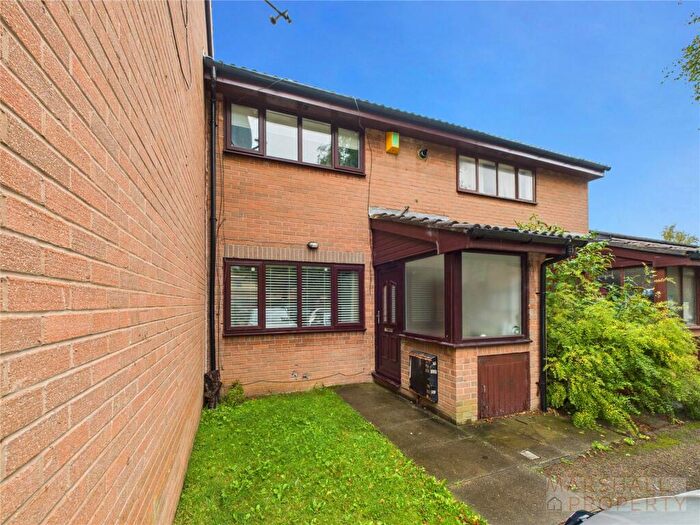
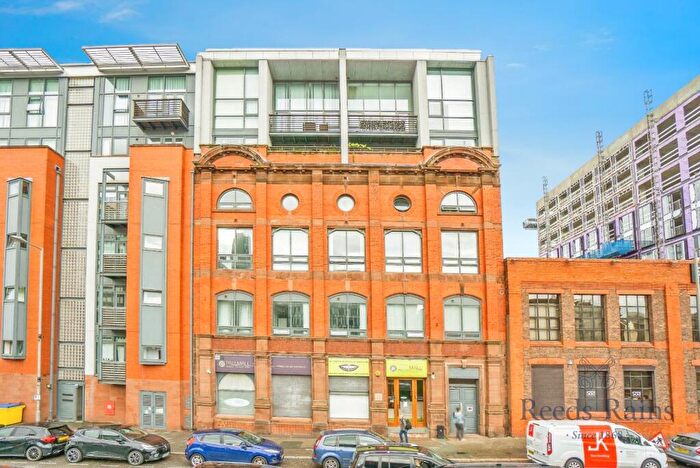
Houses and Flats for sale in L, Liverpool


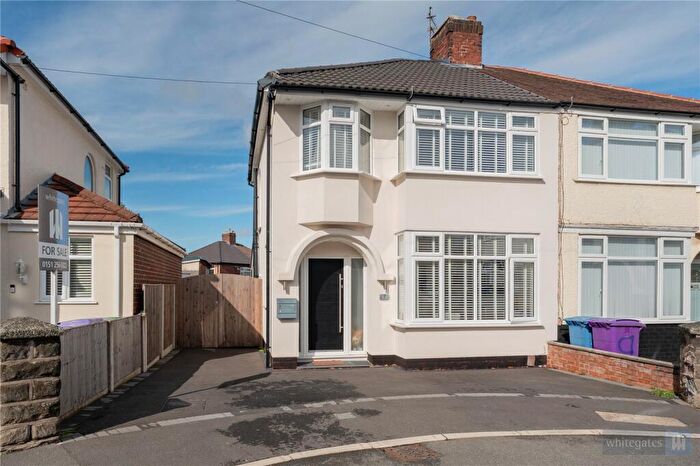
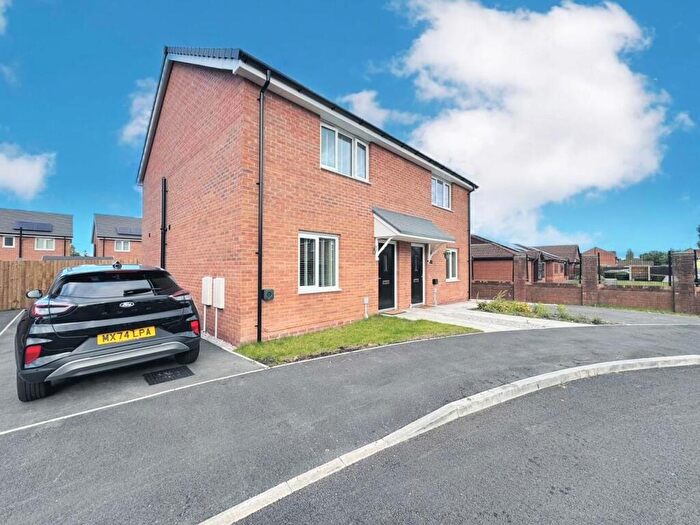
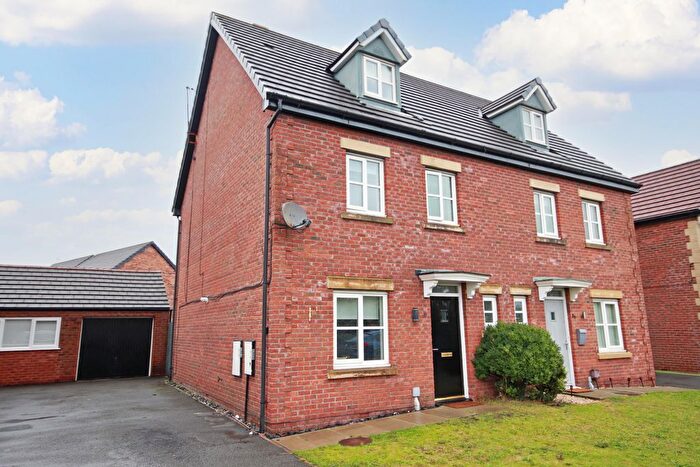
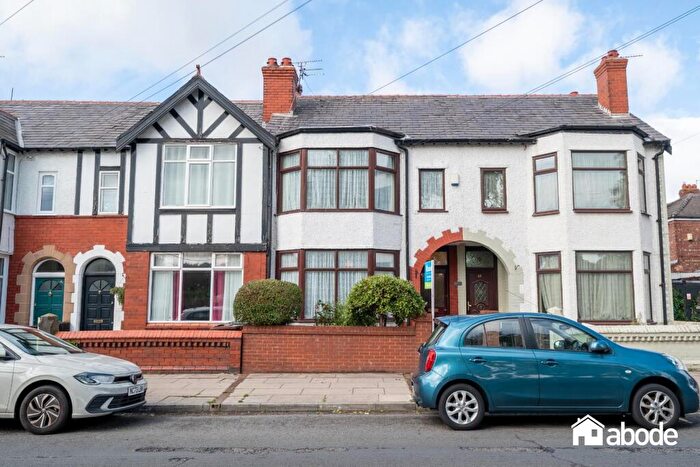
![]()
If you are looking to sell your house, let it out, or receive a property valuation, an expert can help you.
Click the button below to get started.

Postcode districts in L, Liverpool
Navigate through our locations to find the location of your next house in L, Liverpool, England for sale or to rent.
Transport in L, Liverpool
Please see below transportation links in this area:
-
 Rice Lane Station
 -
Fazakerley Station
-
Walton (Merseyside) Station
-
Orrell Park Station
-
Kirkdale Station
-
Aintree Station
-
Wavertree Technology Park Station
-
Bank Hall Station
-
Broad Green Station
-
Sandhills Station
Frequently asked questions about L
What is the average price for a property for sale in L?
The average price for a property for sale in L is £202,175. This amount is 44% lower than the average price in England. There are 5,287 property listings for sale in L.
What locations have the most expensive properties for sale in L?
The locations with the most expensive properties for sale in L are L37 at an average of £376,338, L29 at an average of £363,497 and L18 at an average of £356,323.
What locations have the most affordable properties for sale in L?
The locations with the most affordable properties for sale in L are L4 at an average of £104,484, L28 at an average of £114,906 and L20 at an average of £117,517.
Which train stations are available in or near L?
Some of the train stations available in or near L are Rice Lane, Fazakerley and Walton (Merseyside).