
Properties for sale in L
Liverpool
- Info
- Price Paid By Year
- Property Type Price
House Prices in L
Properties in L have an average house price of £207,246 and had 31814 Property Transactions within the last 3 years.
The most expensive property was sold for £3,971,025.
Property Price Paid in L by Year
The average sold property price by year was:
| Year | Average Sold Price | Sold Properties |
|---|---|---|
| 2026 | £216,386.00 | 186 Properties |
| 2025 | £216,627.00 | 9,560 Properties |
| 2024 | £206,048.00 | 11,365 Properties |
| 2023 | £199,980.00 | 10,703 Properties |
| 2022 | £197,090.00 | 12,979 Properties |
| 2021 | £193,037.00 | 15,095 Properties |
| 2020 | £173,764.00 | 11,733 Properties |
| 2019 | £160,881.00 | 14,758 Properties |
| 2018 | £157,089.00 | 15,025 Properties |
| 2017 | £155,236.00 | 14,199 Properties |
| 2016 | £147,927.00 | 13,259 Properties |
| 2015 | £146,850.00 | 11,899 Properties |
| 2014 | £141,080.00 | 11,060 Properties |
| 2013 | £137,411.00 | 8,758 Properties |
| 2012 | £140,461.00 | 6,622 Properties |
| 2011 | £139,929.00 | 6,717 Properties |
| 2010 | £142,619.00 | 6,485 Properties |
| 2009 | £144,414.00 | 5,960 Properties |
| 2008 | £140,451.00 | 8,462 Properties |
| 2007 | £146,074.00 | 15,785 Properties |
| 2006 | £140,187.00 | 15,859 Properties |
| 2005 | £130,818.00 | 13,193 Properties |
| 2004 | £118,628.00 | 16,505 Properties |
| 2003 | £93,165.00 | 17,272 Properties |
| 2002 | £78,527.00 | 15,439 Properties |
| 2001 | £70,474.00 | 13,188 Properties |
| 2000 | £63,687.00 | 13,005 Properties |
| 1999 | £60,667.00 | 12,588 Properties |
| 1998 | £54,968.00 | 11,847 Properties |
| 1997 | £52,737.00 | 11,499 Properties |
| 1996 | £50,663.00 | 10,913 Properties |
| 1995 | £48,570.00 | 9,856 Properties |
Property Price per Property Type in L
Here you can find historic sold price data in order to help with your property search.
The average Property Paid Price for specific property types in the last three years are:
| Property Type | Average Sold Price | Sold Properties |
|---|---|---|
| Semi Detached House | £236,841.00 | 10,251 Semi Detached Houses |
| Terraced House | £152,457.00 | 13,320 Terraced Houses |
| Detached House | £414,686.00 | 3,477 Detached Houses |
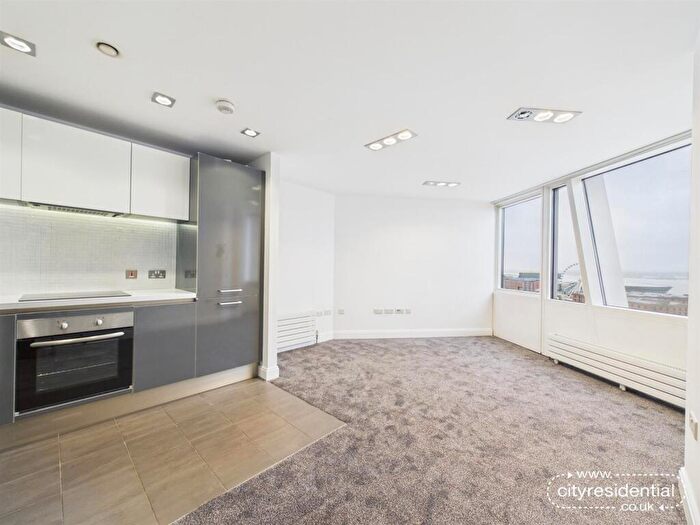
| Flat | £145,379.00 | 4,766 Flats |
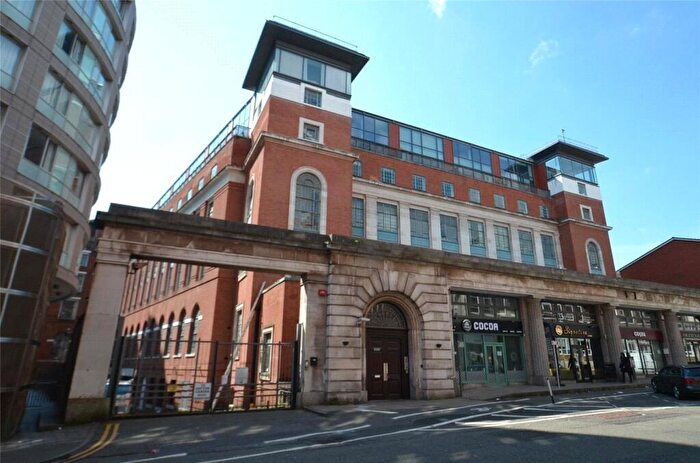
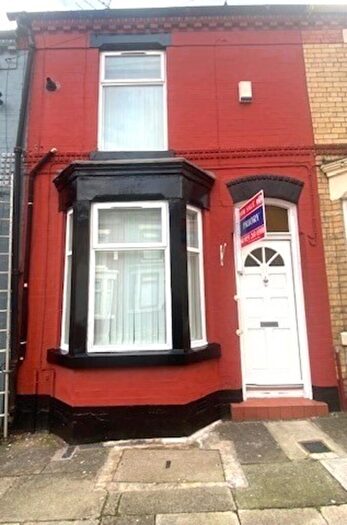
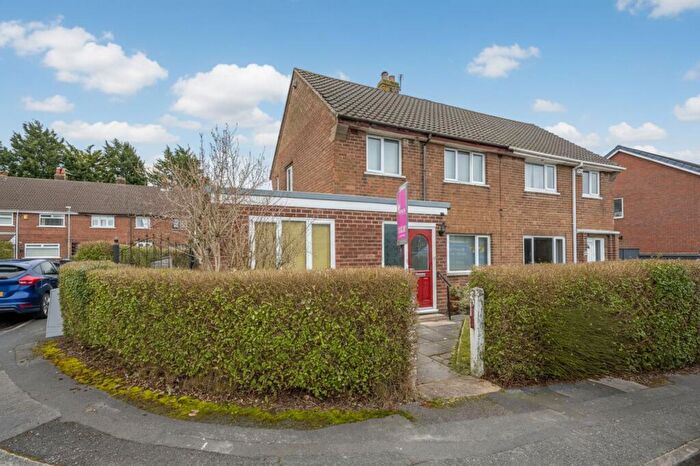
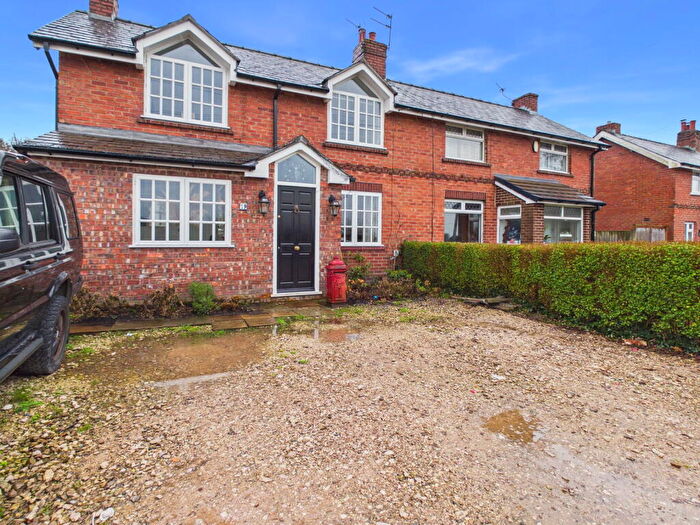
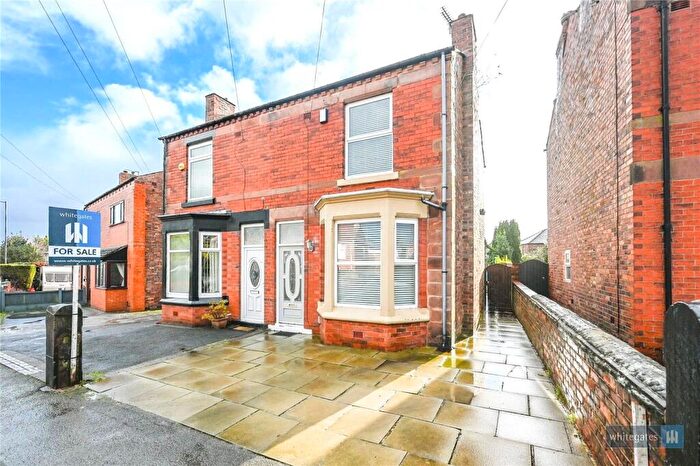
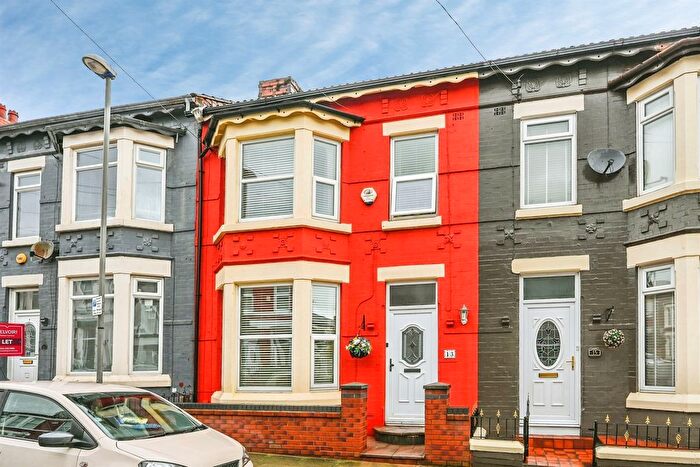
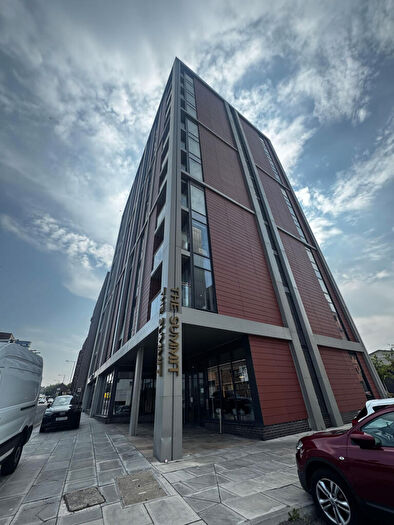
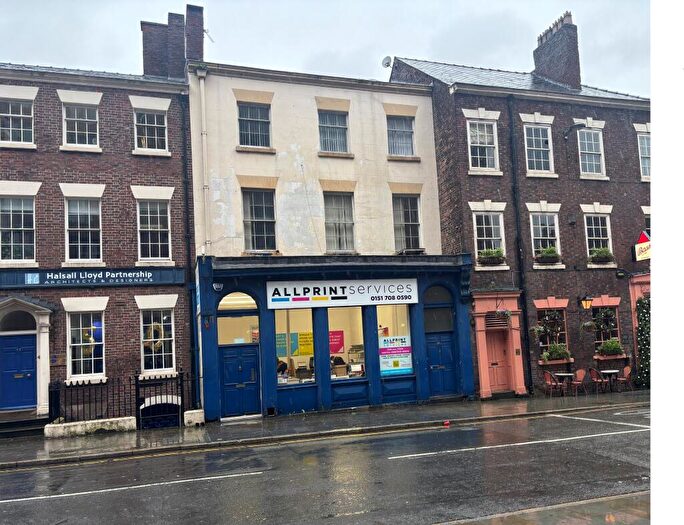
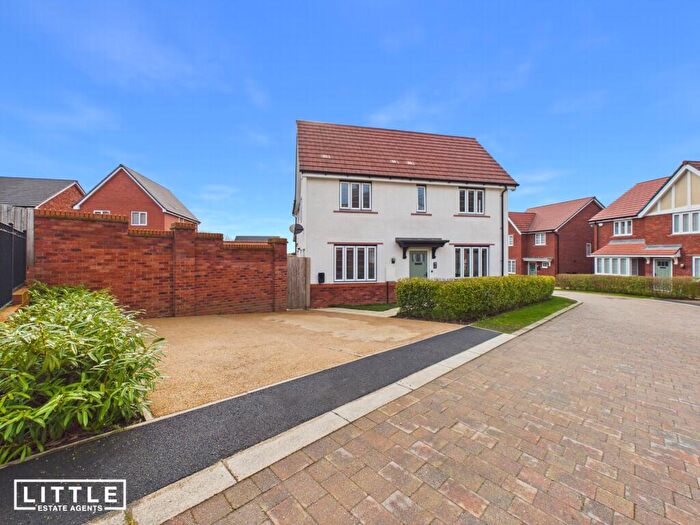
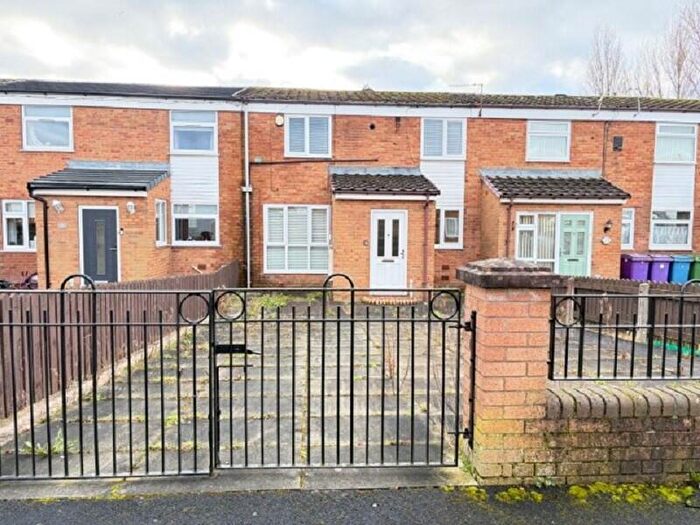
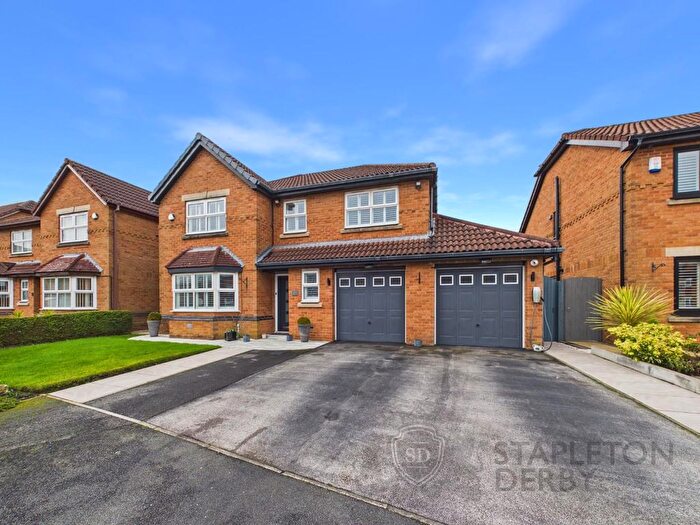
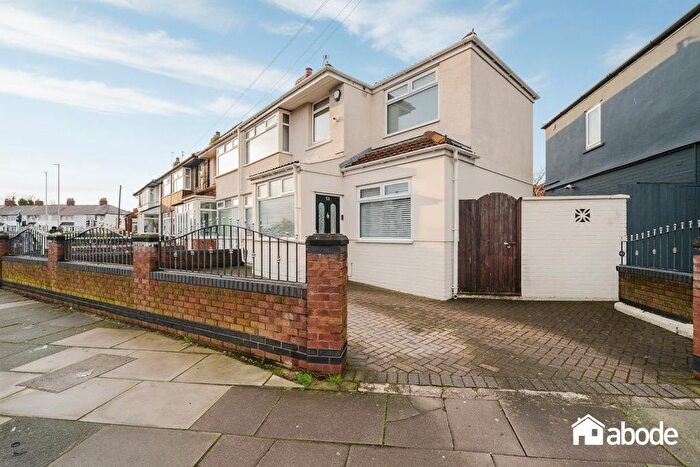
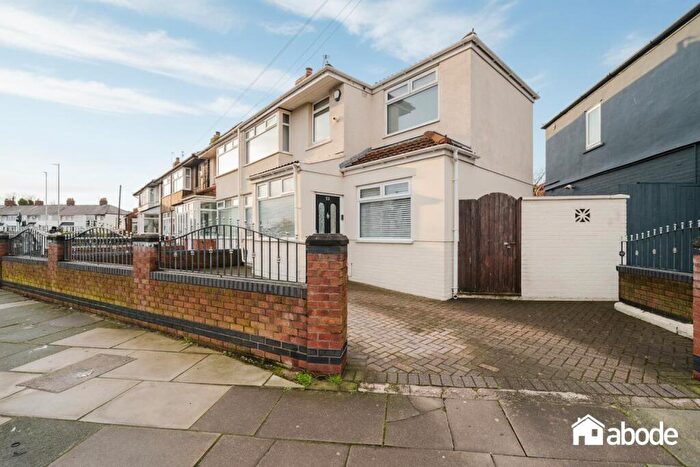
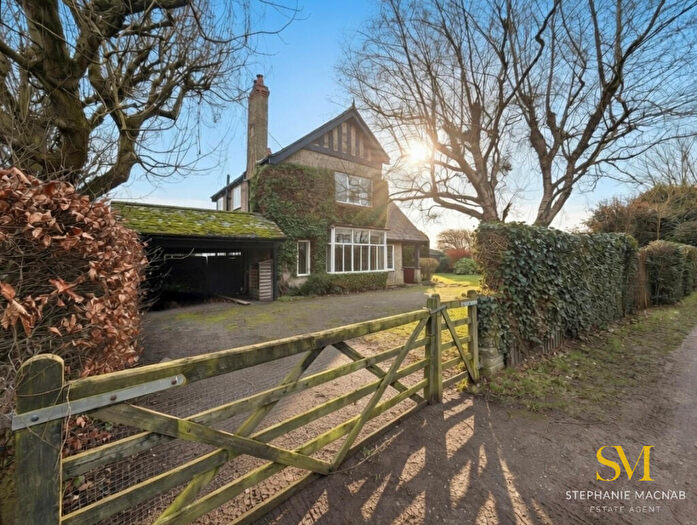
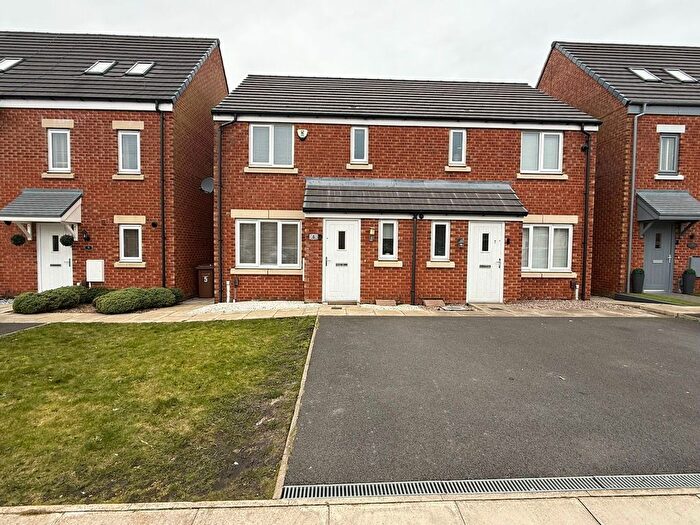
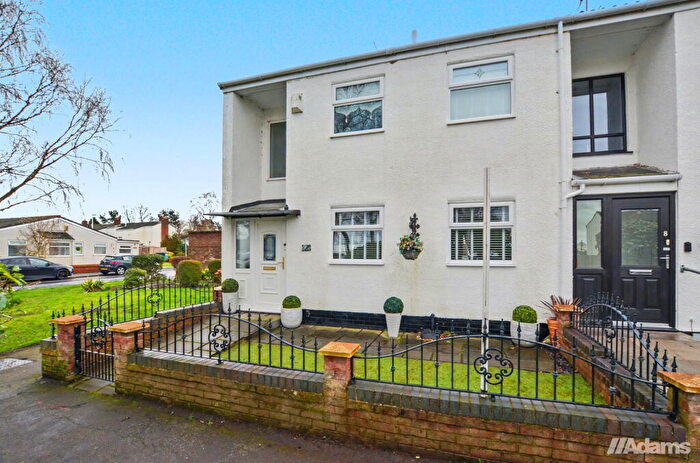
Houses and Flats for sale in L, Liverpool
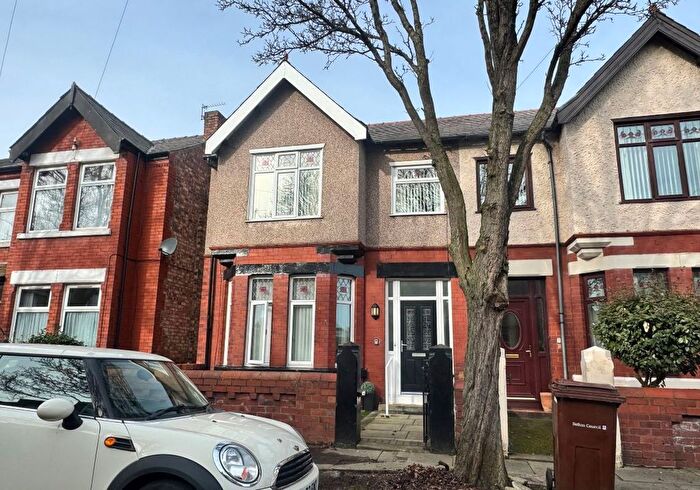
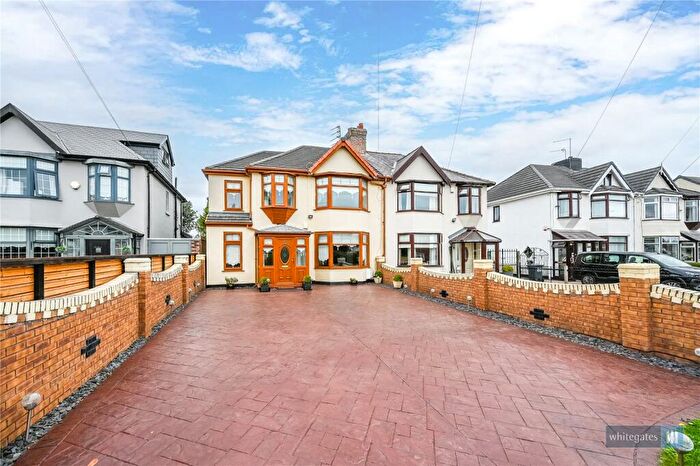
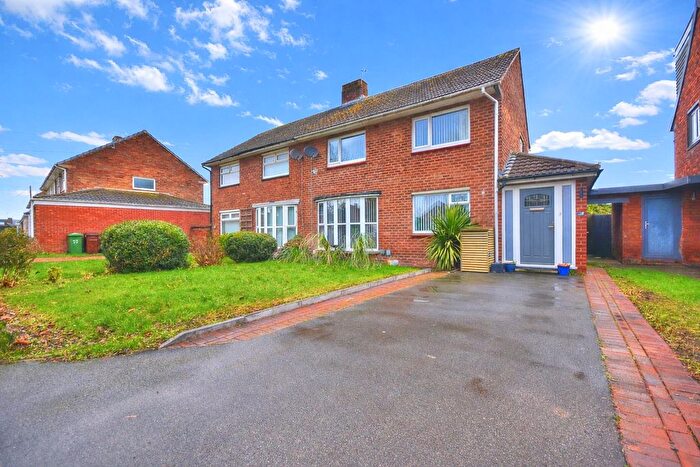
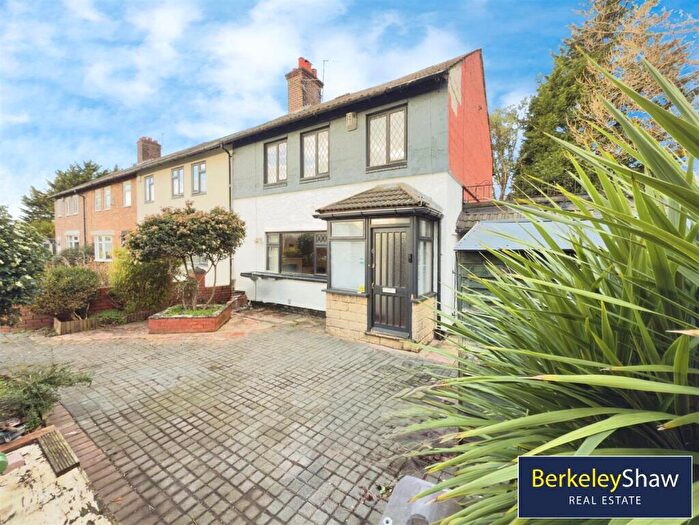
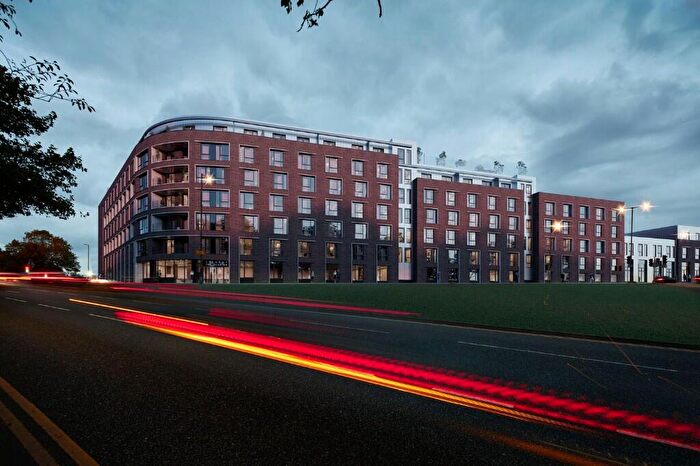
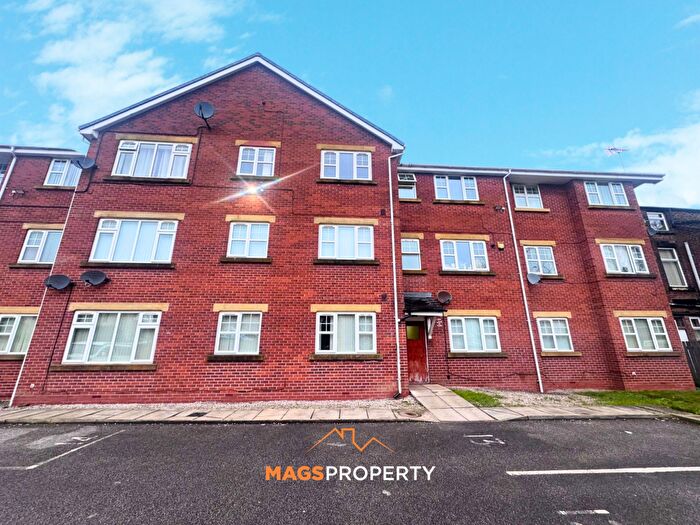
![]()
If you are looking to sell your house, let it out, or receive a property valuation, an expert can help you.
Click the button below to get started.
Postcode districts in L, Liverpool
Navigate through our locations to find the location of your next house in L, Liverpool, England for sale or to rent.
Transport in L, Liverpool
Please see below transportation links in this area:
-
 Rice Lane Station
 -
Fazakerley Station
-
Walton (Merseyside) Station
-
Orrell Park Station
-
Kirkdale Station
-
Aintree Station
-
Wavertree Technology Park Station
-
Bank Hall Station
-
Broad Green Station
-
Sandhills Station
Frequently asked questions about L
What is the average price for a property for sale in L?
The average price for a property for sale in L is £207,246. This amount is 42% lower than the average price in England. There are 4,860 property listings for sale in L.
What locations have the most expensive properties for sale in L?
The locations with the most expensive properties for sale in L are L37 at an average of £379,537, L38 at an average of £372,050 and L18 at an average of £361,277.
What locations have the most affordable properties for sale in L?
The locations with the most affordable properties for sale in L are L4 at an average of £108,201, L28 at an average of £116,049 and L6 at an average of £118,693.
Which train stations are available in or near L?
Some of the train stations available in or near L are Rice Lane, Fazakerley and Walton (Merseyside).