
Properties for sale in LE18
Wigston
- Info
- Price Paid By Year
- Property Type Price
- Transport
House Prices in LE18
Properties in LE18 have an average house price of £256,249.00 and had 1332 Property Transactions within the last 3 years.
The most expensive property was sold for £1,800,000.00.
Property Price Paid in LE18 by Year
The average sold property price by year was:
| Year | Average Sold Price | Sold Properties |
|---|---|---|
| 2026 | £257,227.00 | 35 Properties |
| 2025 | £259,773.00 | 403 Properties |
| 2024 | £249,843.00 | 469 Properties |
| 2023 | £259,896.00 | 425 Properties |
| 2022 | £249,516.00 | 563 Properties |
| 2021 | £238,694.00 | 704 Properties |
| 2020 | £226,610.00 | 486 Properties |
| 2019 | £219,056.00 | 601 Properties |
| 2018 | £196,572.00 | 540 Properties |
| 2017 | £185,210.00 | 524 Properties |
| 2016 | £175,119.00 | 636 Properties |
| 2015 | £162,124.00 | 608 Properties |
| 2014 | £147,124.00 | 561 Properties |
| 2013 | £136,937.00 | 434 Properties |
| 2012 | £139,831.00 | 376 Properties |
| 2011 | £138,030.00 | 349 Properties |
| 2010 | £139,066.00 | 359 Properties |
| 2009 | £130,095.00 | 354 Properties |
| 2008 | £137,960.00 | 323 Properties |
| 2007 | £151,515.00 | 640 Properties |
| 2006 | £142,948.00 | 740 Properties |
| 2005 | £140,275.00 | 586 Properties |
| 2004 | £133,631.00 | 692 Properties |
| 2003 | £112,280.00 | 726 Properties |
| 2002 | £88,101.00 | 805 Properties |
| 2001 | £68,584.00 | 720 Properties |
| 2000 | £61,781.00 | 651 Properties |
| 1999 | £57,248.00 | 681 Properties |
| 1998 | £56,832.00 | 590 Properties |
| 1997 | £52,447.00 | 590 Properties |
| 1996 | £48,268.00 | 535 Properties |
| 1995 | £47,168.00 | 440 Properties |
Property Price per Property Type in LE18
Here you can find historic sold price data in order to help with your property search.
The average Property Paid Price for specific property types in the last three years are:
| Property Type | Average Sold Price | Sold Properties |
|---|---|---|
| Semi Detached House | £253,950.00 | 717 Semi Detached Houses |
| Detached House | £362,799.00 | 242 Detached Houses |
| Terraced House | £202,058.00 | 325 Terraced Houses |
| Flat | £120,322.00 | 48 Flats |
Transport near LE18

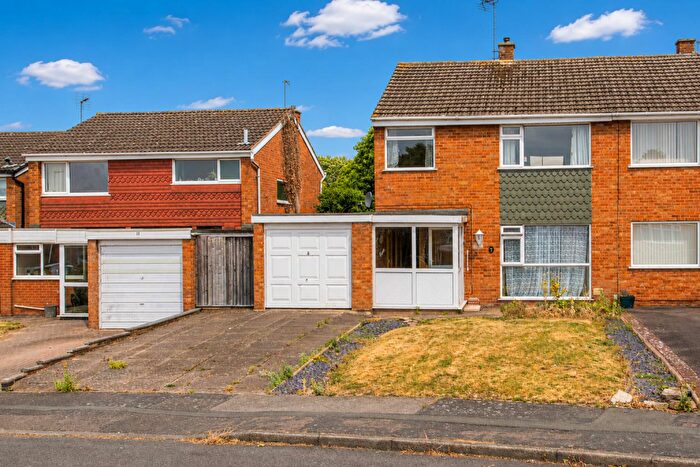
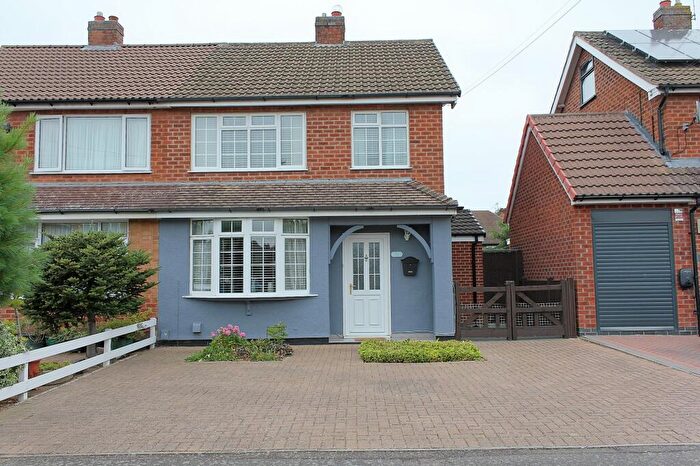
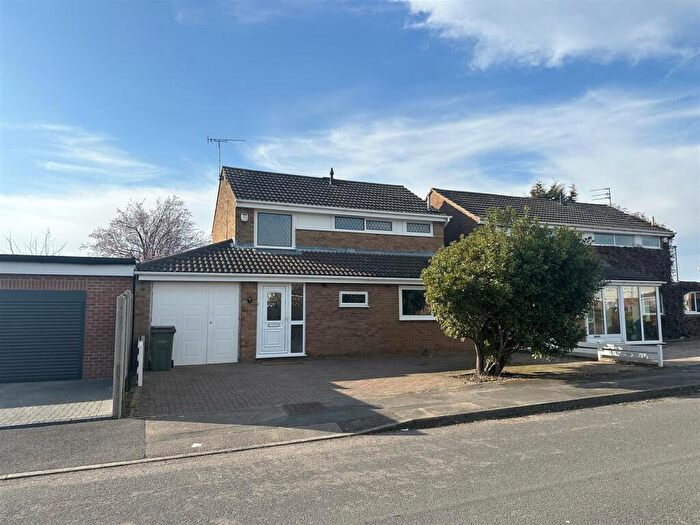
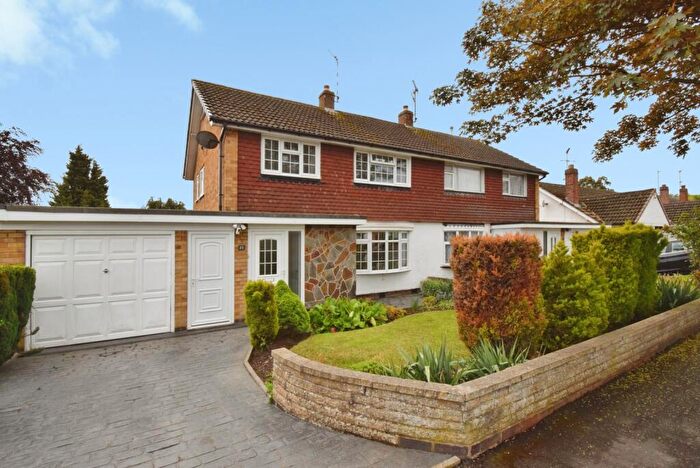
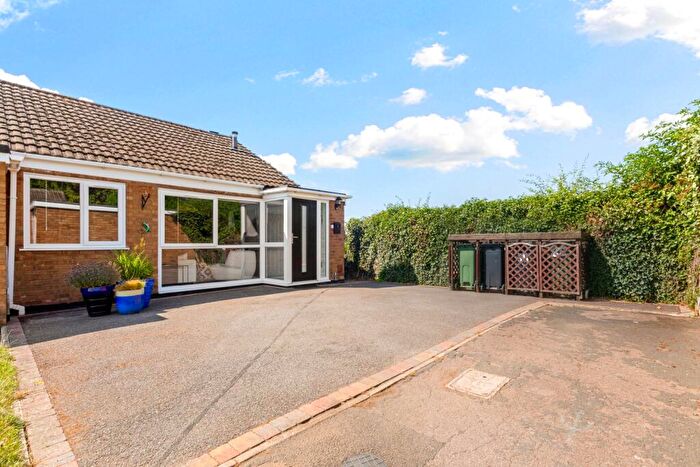
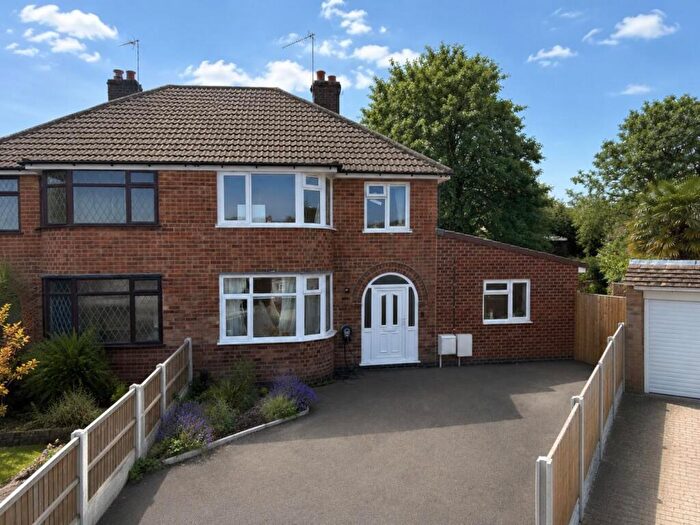
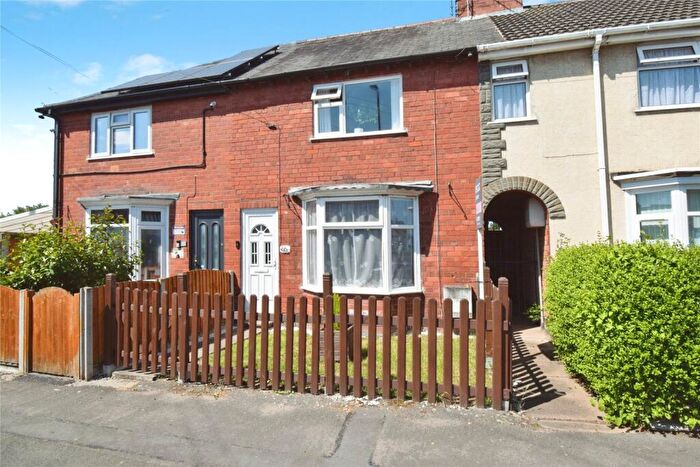
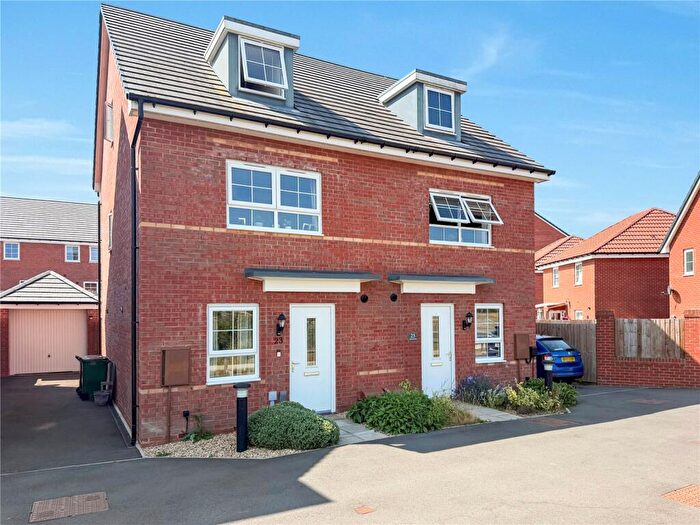
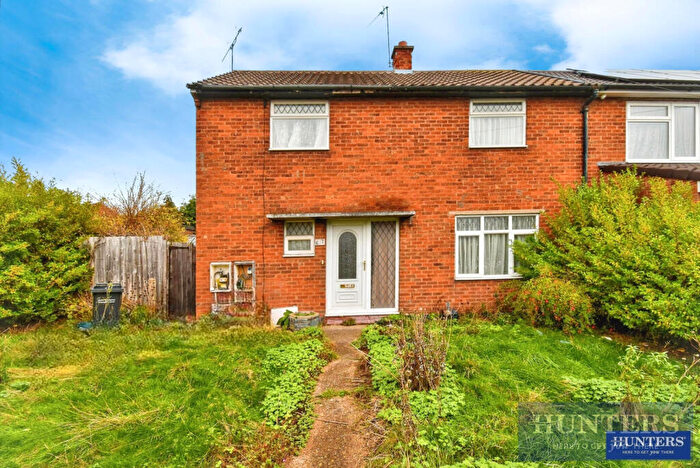
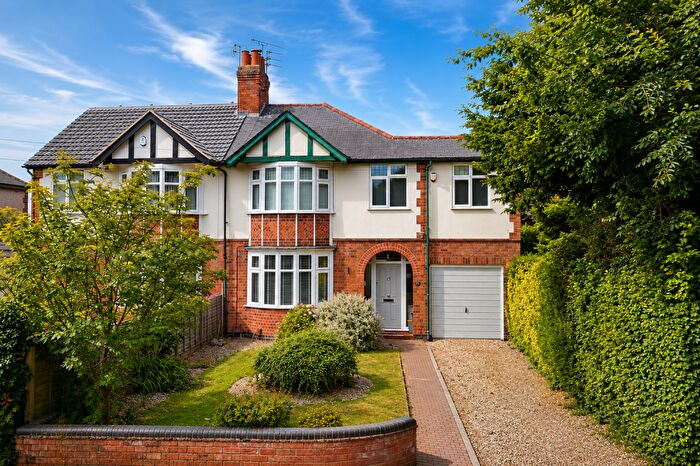
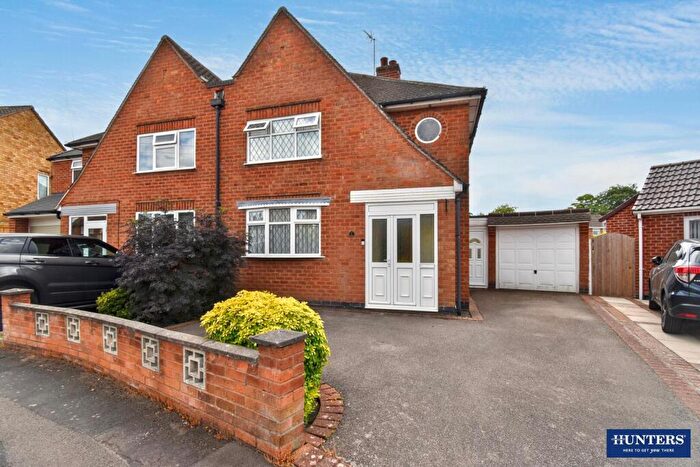
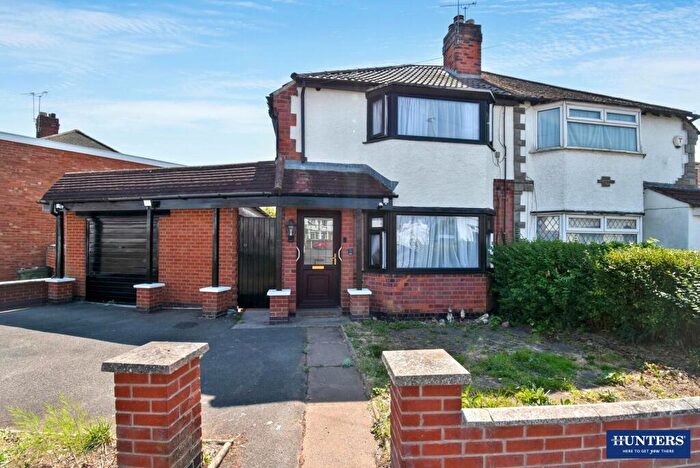
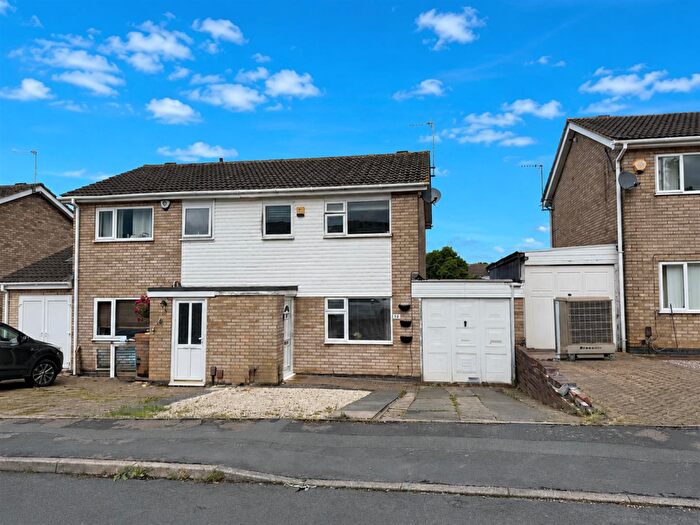
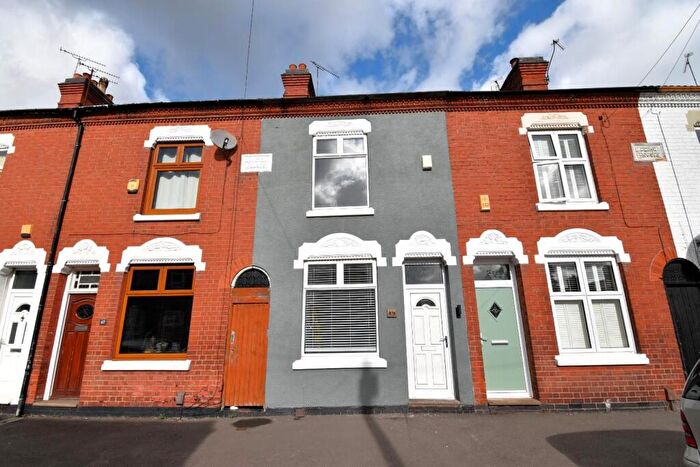
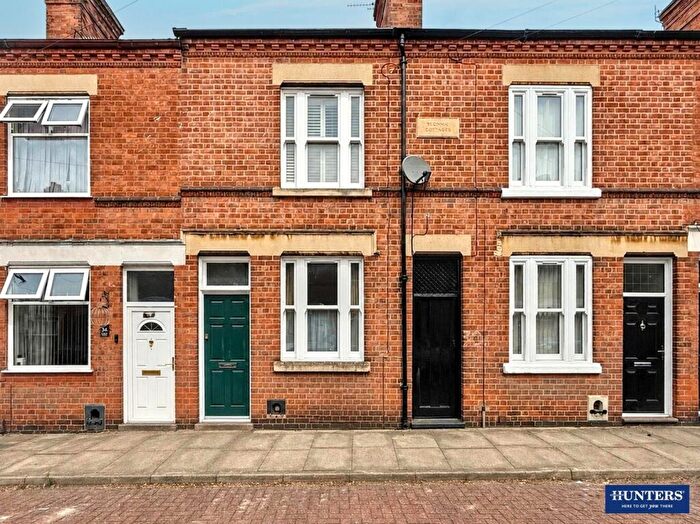
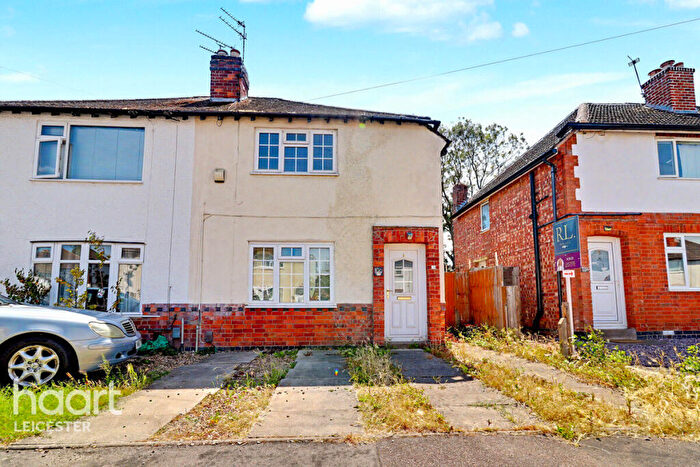
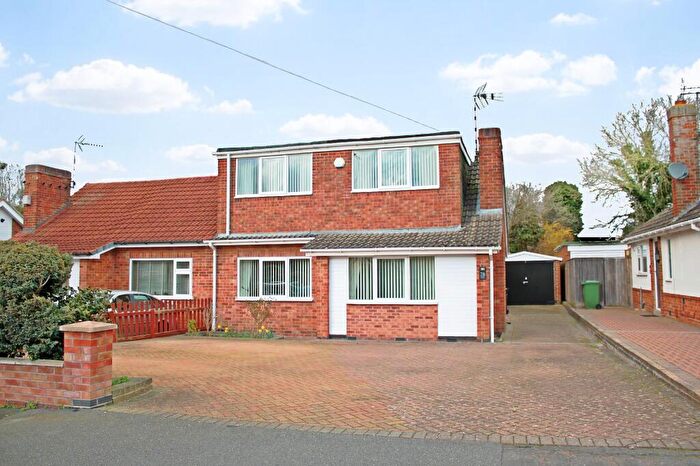
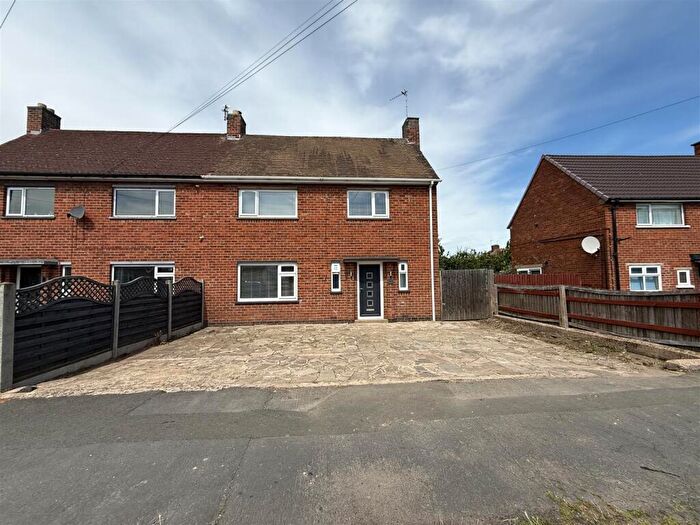
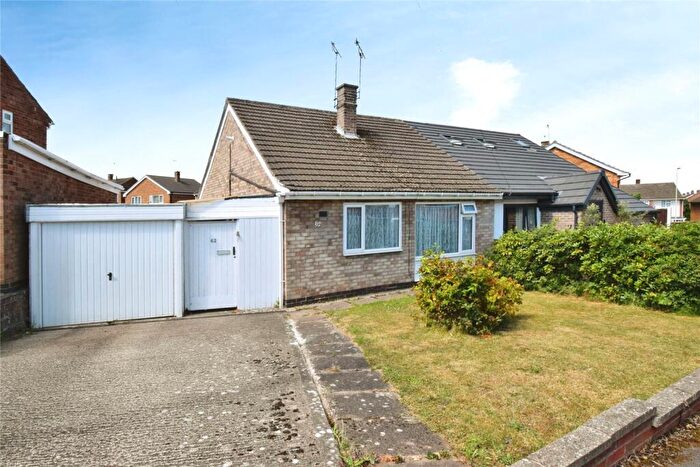
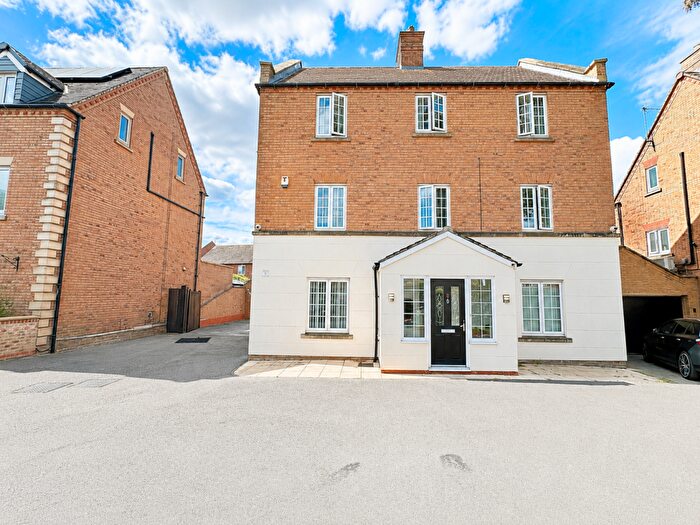
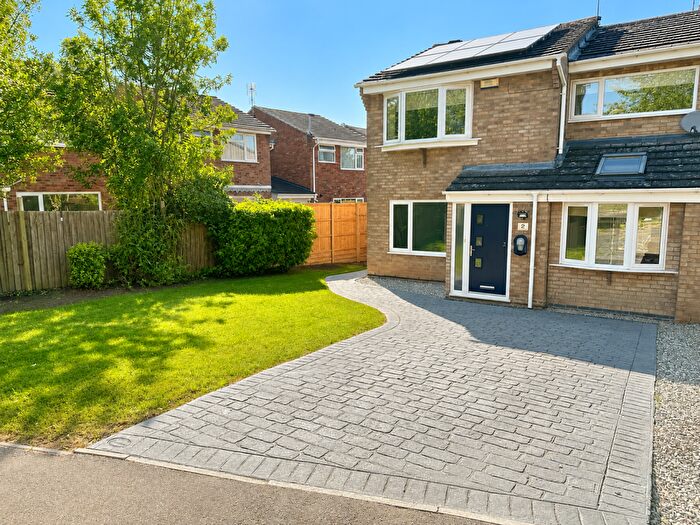
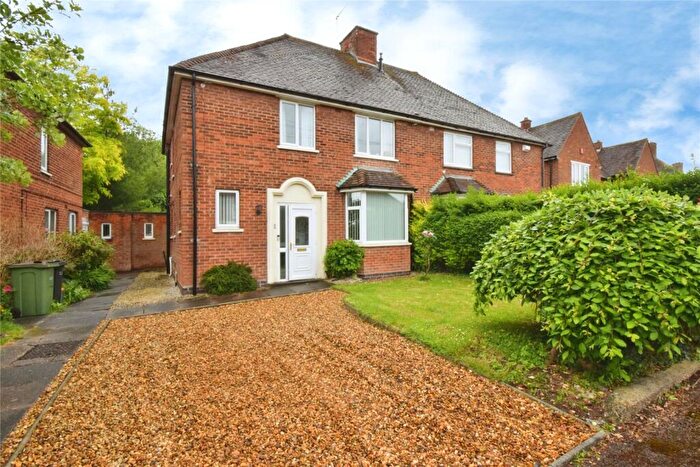
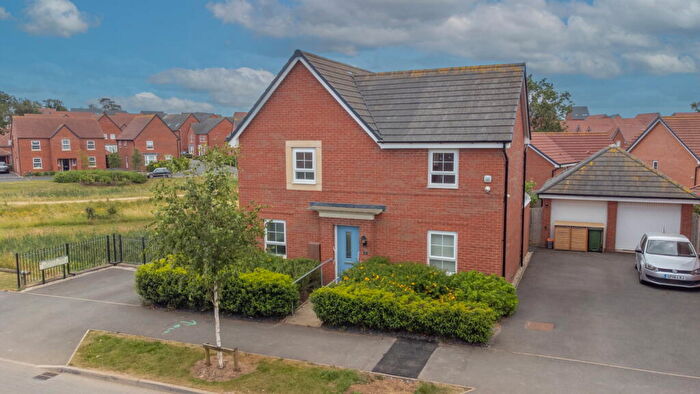
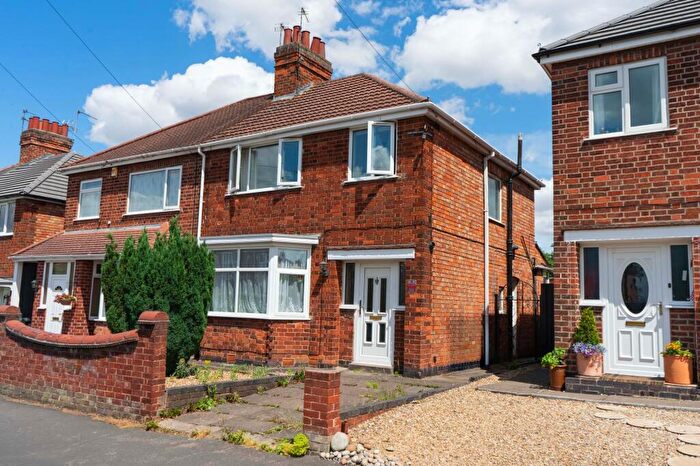
Houses and Flats for sale in LE18, Wigston
There are 199 results. Property prices in LE18 range from £58k to £1.25M with an average price of £313k.
![]()
If you are looking to sell your house, let it out, or receive a property valuation, an expert can help you.
Click the button below to get started.
Frequently Asked Questions about LE18
What is the average price for a property for sale in LE18?
The average price for a property for sale in LE18 is £256,249. There are 199 property listings for sale in LE18.
Which areas are included in the LE18 postcode district?
The main area within LE18 is Wigston.
What are the most common property types in LE18?
The most common property types in LE18 are Semi Detached Houses, Terraced Houses, Detached Houses and Flats.
What has been the average sold property price in LE18 over the last three years?
Semi Detached Houses in LE18 have an average sold price of £253,950, while Terraced Houses have an average of £202,058. Detached Houses have an average of £362,799 and Flats have an average of £120,322. The average sold property price in LE18 over the last three years is approximately £255,614.
Which train stations are available in LE18?
The train station available in LE18 is South Wigston Station..