
Properties for sale in LE
Leicester
- Info
- Price Paid By Year
- Property Type Price
House Prices in LE
Properties in LE have an average house price of £295,656 and had 37709 Property Transactions within the last 3 years.
The most expensive property was sold for £29,000,000.
Property Price Paid in LE by Year
The average sold property price by year was:
| Year | Average Sold Price | Sold Properties |
|---|---|---|
| 2026 | £278,673.00 | 930 Properties |
| 2025 | £301,087.00 | 12,409 Properties |
| 2024 | £293,473.00 | 12,762 Properties |
| 2023 | £293,613.00 | 11,608 Properties |
| 2022 | £292,168.00 | 14,733 Properties |
| 2021 | £276,284.00 | 18,678 Properties |
| 2020 | £261,171.00 | 14,214 Properties |
| 2019 | £243,043.00 | 16,776 Properties |
| 2018 | £238,283.00 | 17,764 Properties |
| 2017 | £225,901.00 | 17,811 Properties |
| 2016 | £211,505.00 | 18,043 Properties |
| 2015 | £202,000.00 | 17,478 Properties |
| 2014 | £192,909.00 | 17,108 Properties |
| 2013 | £181,973.00 | 13,407 Properties |
| 2012 | £177,407.00 | 11,133 Properties |
| 2011 | £178,861.00 | 10,981 Properties |
| 2010 | £179,909.00 | 11,144 Properties |
| 2009 | £167,726.00 | 10,714 Properties |
| 2008 | £177,092.00 | 10,583 Properties |
| 2007 | £183,408.00 | 20,307 Properties |
| 2006 | £171,604.00 | 21,239 Properties |
| 2005 | £166,779.00 | 16,918 Properties |
| 2004 | £157,281.00 | 19,898 Properties |
| 2003 | £136,907.00 | 20,390 Properties |
| 2002 | £111,839.00 | 22,321 Properties |
| 2001 | £91,393.00 | 21,207 Properties |
| 2000 | £81,677.00 | 19,328 Properties |
| 1999 | £75,241.00 | 19,731 Properties |
| 1998 | £69,034.00 | 17,026 Properties |
| 1997 | £64,975.00 | 17,186 Properties |
| 1996 | £60,740.00 | 15,989 Properties |
| 1995 | £58,882.00 | 13,803 Properties |
Property Price per Property Type in LE
Here you can find historic sold price data in order to help with your property search.
The average Property Paid Price for specific property types in the last three years are:
| Property Type | Average Sold Price | Sold Properties |
|---|---|---|
| Semi Detached House | £264,049.00 | 13,653 Semi Detached Houses |
| Terraced House | £218,207.00 | 9,758 Terraced Houses |
| Detached House | £432,639.00 | 11,606 Detached Houses |
| Flat | £146,127.00 | 2,692 Flats |
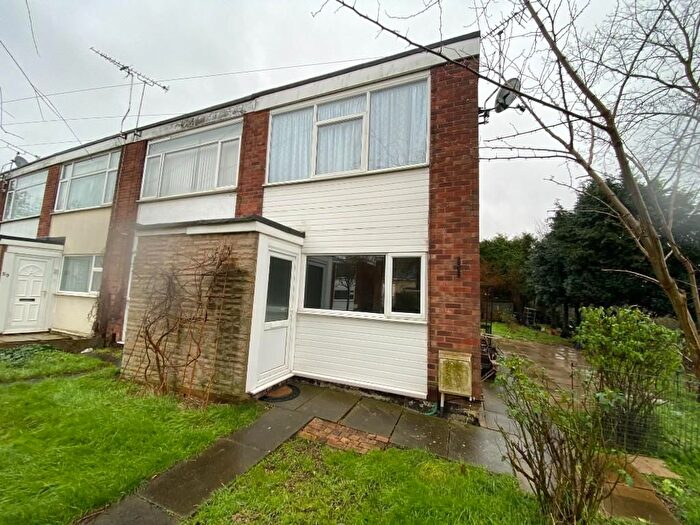
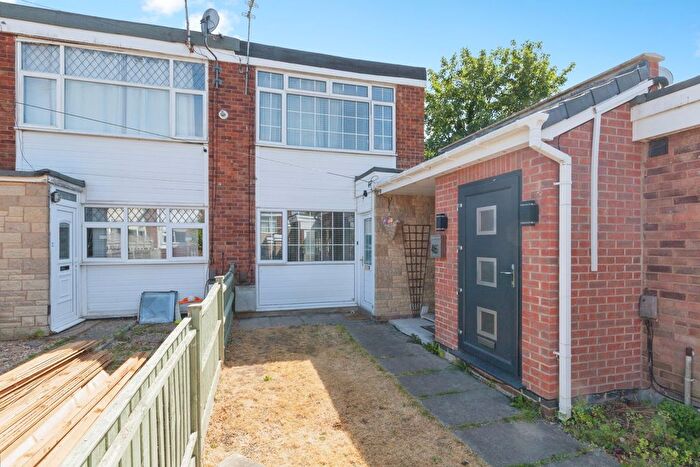
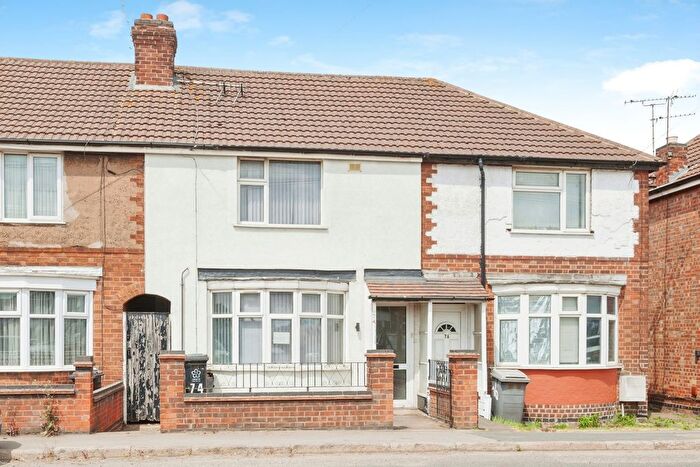
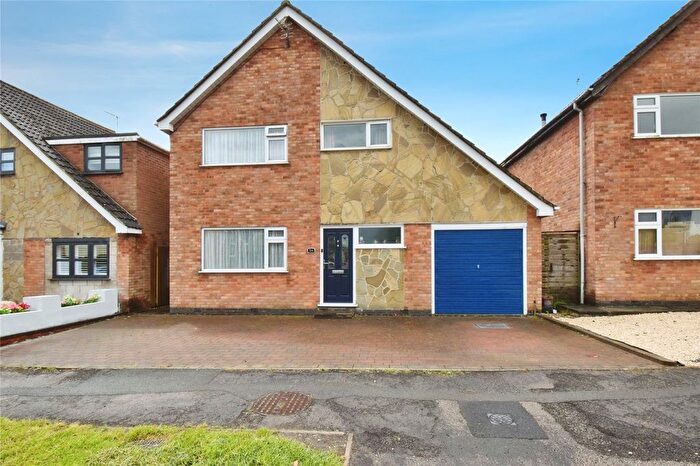
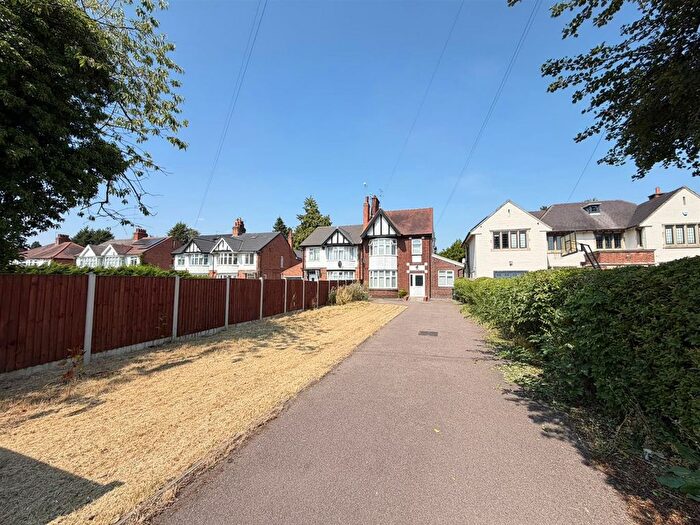
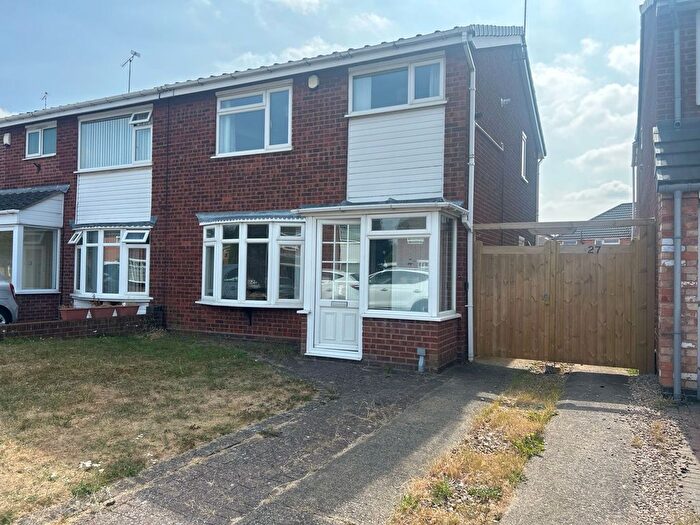
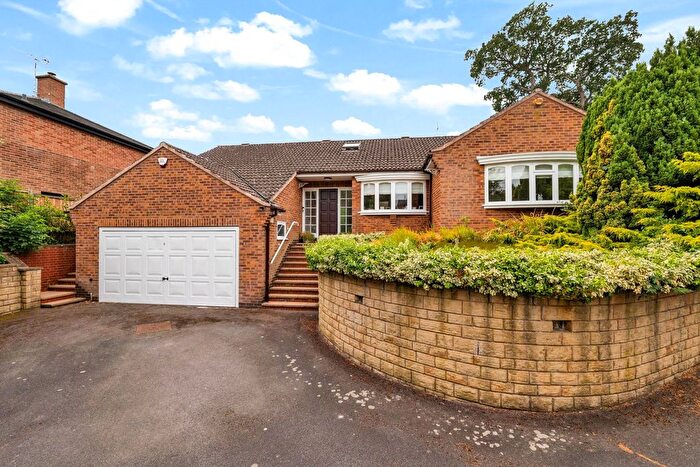
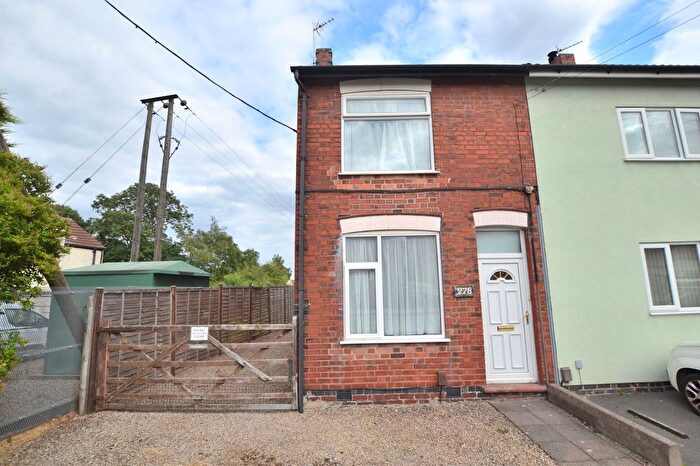
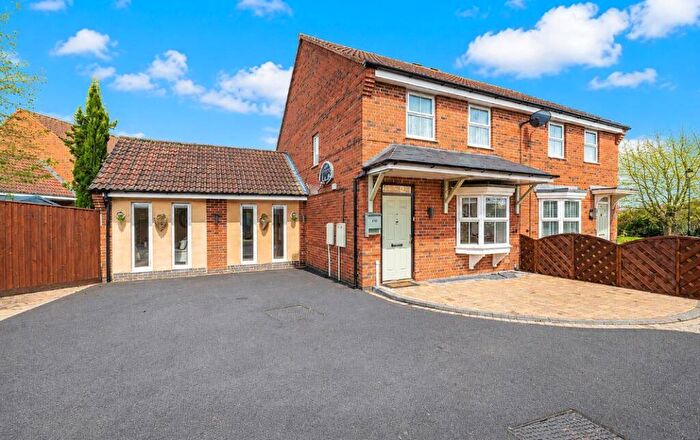
Houses and Flats for sale in LE, Leicester
There are 6,287 results. Property prices in LE range from £10k to £6M with an average price of £370k.
![]()
If you are looking to sell your house, let it out, or receive a property valuation, an expert can help you.
Click the button below to get started.


Postcode districts in LE, Leicester
Navigate through our locations to find the location of your next house in LE, Leicester, England for sale or to rent.
Transport in LE, Leicester
Please see below transportation links in this area:

Frequently asked questions about LE
What is the average price for a property for sale in LE?
The average price for a property for sale in LE is £295,656. This amount is 18% lower than the average price in England. There are 6,287 property listings for sale in LE.
What locations have the most expensive properties for sale in LE?
The locations with the most expensive properties for sale in LE are LE15 at an average of £411,151, LE16 at an average of £390,093 and LE17 at an average of £388,902.
What locations have the most affordable properties for sale in LE?
The locations with the most affordable properties for sale in LE are LE1 at an average of £151,227, LE3 at an average of £238,891 and LE13 at an average of £245,945.
Which train stations are available in or near LE?
Some of the train stations available in or near LE are Leicester, Syston and South Wigston.