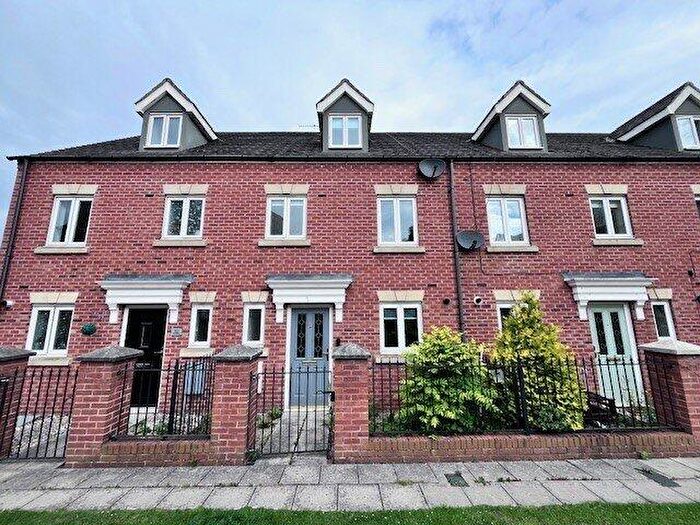
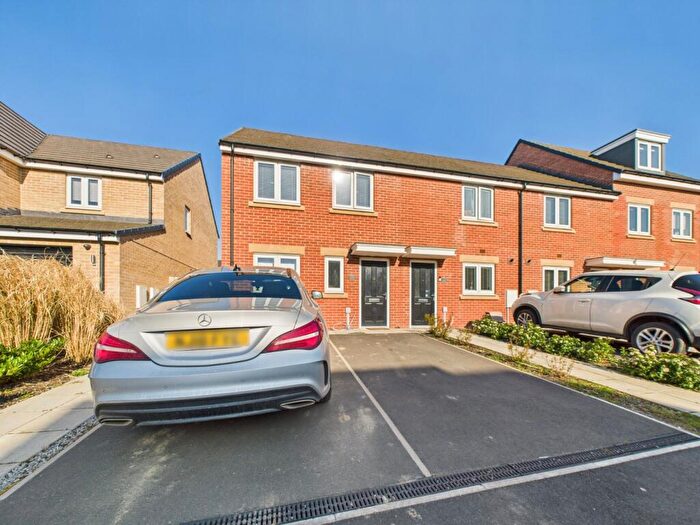
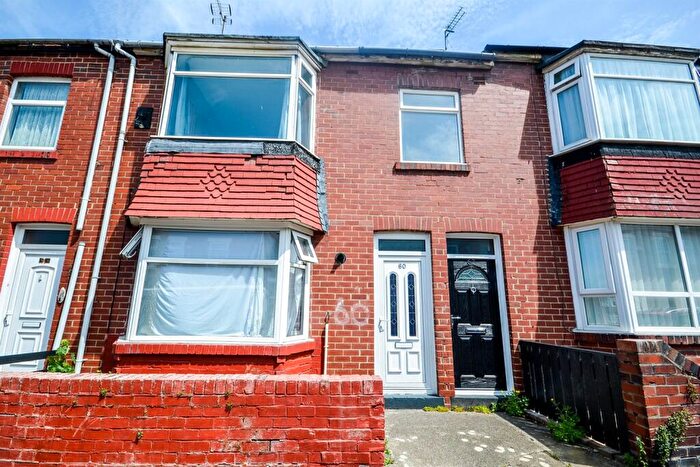
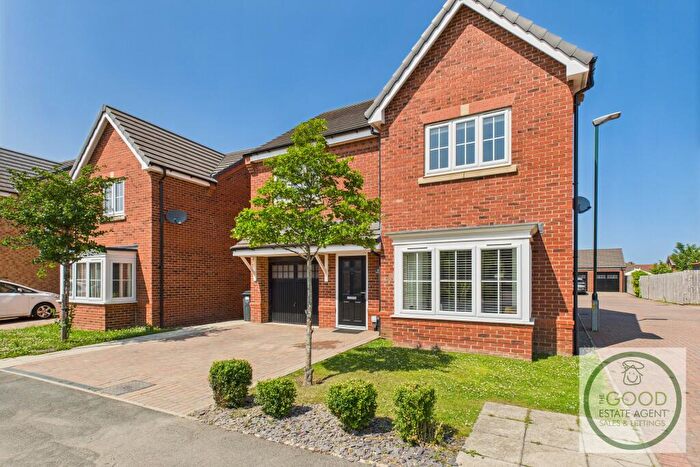
Properties for sale in NE31
Hebburn
- Info
- Price Paid By Year
- Property Type Price
- Transport
House Prices in NE31
Properties in NE31 have an average house price of £164,706.00 and had 1094 Property Transactions within the last 3 years.
The most expensive property was sold for £560,000.00.
Property Price Paid in NE31 by Year
The average sold property price by year was:
| Year | Average Sold Price | Sold Properties |
|---|---|---|
| 2025 | £175,302.00 | 60 Properties |
| 2024 | £168,030.00 | 296 Properties |
| 2023 | £162,483.00 | 309 Properties |
| 2022 | £162,531.00 | 429 Properties |
| 2021 | £158,946.00 | 449 Properties |
| 2020 | £150,109.00 | 323 Properties |
| 2019 | £160,580.00 | 402 Properties |
| 2018 | £161,130.00 | 435 Properties |
| 2017 | £156,685.00 | 443 Properties |
| 2016 | £141,880.00 | 405 Properties |
| 2015 | £131,819.00 | 341 Properties |
| 2014 | £129,535.00 | 326 Properties |
| 2013 | £104,912.00 | 217 Properties |
| 2012 | £115,052.00 | 167 Properties |
| 2011 | £113,932.00 | 159 Properties |
| 2010 | £122,187.00 | 165 Properties |
| 2009 | £116,763.00 | 161 Properties |
| 2008 | £120,765.00 | 202 Properties |
| 2007 | £117,105.00 | 439 Properties |
| 2006 | £111,873.00 | 443 Properties |
| 2005 | £99,351.00 | 309 Properties |
| 2004 | £91,854.00 | 346 Properties |
| 2003 | £66,194.00 | 372 Properties |
| 2002 | £47,725.00 | 380 Properties |
| 2001 | £45,368.00 | 270 Properties |
| 2000 | £50,452.00 | 305 Properties |
| 1999 | £42,127.00 | 234 Properties |
| 1998 | £42,593.00 | 252 Properties |
| 1997 | £41,316.00 | 210 Properties |
| 1996 | £40,205.00 | 262 Properties |
| 1995 | £40,716.00 | 228 Properties |
Property Price per Property Type in NE31
Here you can find historic sold price data in order to help with your property search.
The average Property Paid Price for specific property types in the last three years are:
| Property Type | Average Sold Price | Sold Properties |
|---|---|---|
| Semi Detached House | £168,578.00 | 390 Semi Detached Houses |
| Detached House | £296,252.00 | 188 Detached Houses |
| Terraced House | £134,189.00 | 343 Terraced Houses |
| Flat | £73,527.00 | 173 Flats |
Transport near NE31
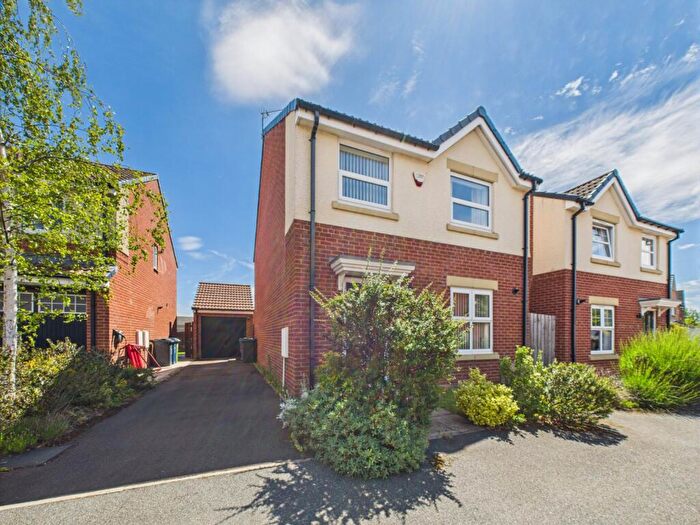
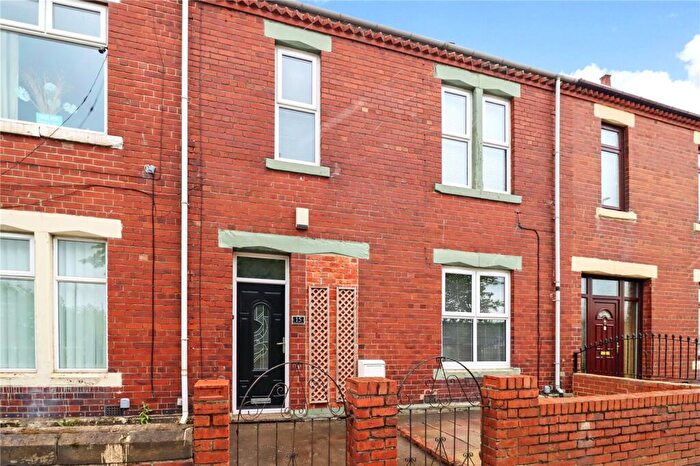
Houses and Flats for sale in NE31, Hebburn
Frequently Asked Questions about NE31
What is the average price for a property for sale in NE31?
The average price for a property for sale in NE31 is £164,706. There are 136 property listings for sale in NE31.
Which areas are included in the NE31 postcode district?
The main area within NE31 is Hebburn.
What are the most common property types in NE31?
The most common property types in NE31 are Semi Detached Houses, Terraced Houses, Detached Houses and Flats.
What has been the average sold property price in NE31 over the last three years?
Semi Detached Houses in NE31 have an average sold price of £168,578, while Terraced Houses have an average of £134,189. Detached Houses have an average of £296,252 and Flats have an average of £73,527. The average sold property price in NE31 over the last three years is approximately £168,605.


