
Properties for sale in NE
Newcastle upon Tyne
- Info
- Price Paid By Year
- Property Type Price
House Prices in NE
Properties in NE have an average house price of £209,532 and had 45635 Property Transactions within the last 3 years.
The most expensive property was sold for £6,000,000.
Property Price Paid in NE by Year
The average sold property price by year was:
| Year | Average Sold Price | Sold Properties |
|---|---|---|
| 2025 | £217,215.00 | 12,825 Properties |
| 2024 | £208,278.00 | 16,805 Properties |
| 2023 | £204,692.00 | 16,005 Properties |
| 2022 | £202,675.00 | 18,620 Properties |
| 2021 | £199,313.00 | 21,871 Properties |
| 2020 | £189,571.00 | 16,992 Properties |
| 2019 | £179,862.00 | 19,079 Properties |
| 2018 | £178,421.00 | 19,530 Properties |
| 2017 | £173,461.00 | 19,668 Properties |
| 2016 | £170,434.00 | 18,797 Properties |
| 2015 | £164,443.00 | 18,306 Properties |
| 2014 | £158,274.00 | 17,862 Properties |
| 2013 | £154,161.00 | 14,238 Properties |
| 2012 | £153,089.00 | 11,881 Properties |
| 2011 | £150,674.00 | 12,070 Properties |
| 2010 | £159,603.00 | 11,426 Properties |
| 2009 | £154,650.00 | 11,039 Properties |
| 2008 | £158,012.00 | 12,914 Properties |
| 2007 | £155,882.00 | 26,475 Properties |
| 2006 | £149,205.00 | 26,240 Properties |
| 2005 | £137,551.00 | 21,978 Properties |
| 2004 | £129,576.00 | 25,088 Properties |
| 2003 | £107,683.00 | 26,393 Properties |
| 2002 | £85,897.00 | 25,932 Properties |
| 2001 | £72,878.00 | 23,514 Properties |
| 2000 | £66,592.00 | 21,483 Properties |
| 1999 | £63,341.00 | 20,800 Properties |
| 1998 | £59,653.00 | 19,449 Properties |
| 1997 | £56,835.00 | 19,084 Properties |
| 1996 | £53,612.00 | 17,282 Properties |
| 1995 | £51,820.00 | 14,796 Properties |
Property Price per Property Type in NE
Here you can find historic sold price data in order to help with your property search.
The average Property Paid Price for specific property types in the last three years are:
| Property Type | Average Sold Price | Sold Properties |
|---|---|---|
| Semi Detached House | £210,139.00 | 14,074 Semi Detached Houses |
| Terraced House | £178,734.00 | 15,802 Terraced Houses |
| Detached House | £385,169.00 | 7,061 Detached Houses |
| Flat | £121,919.00 | 8,698 Flats |
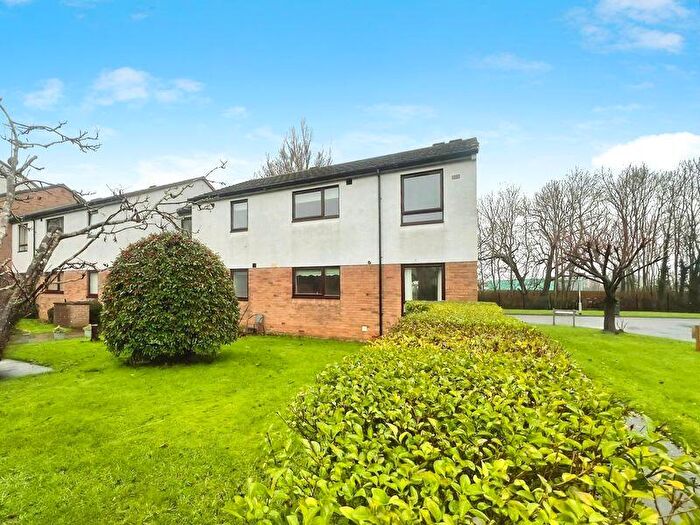
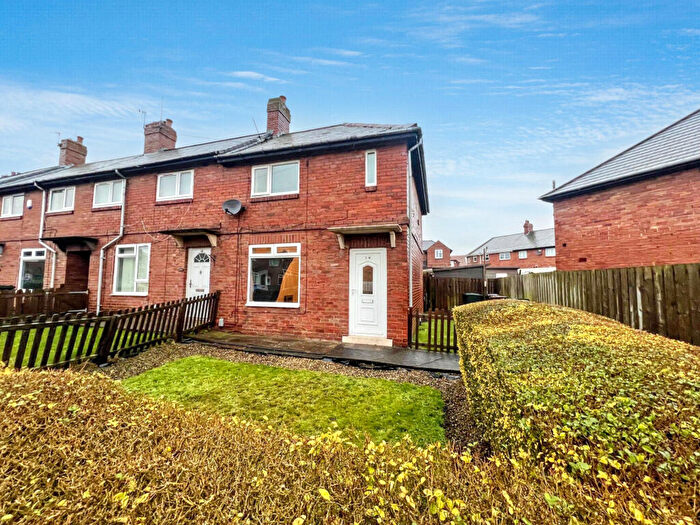
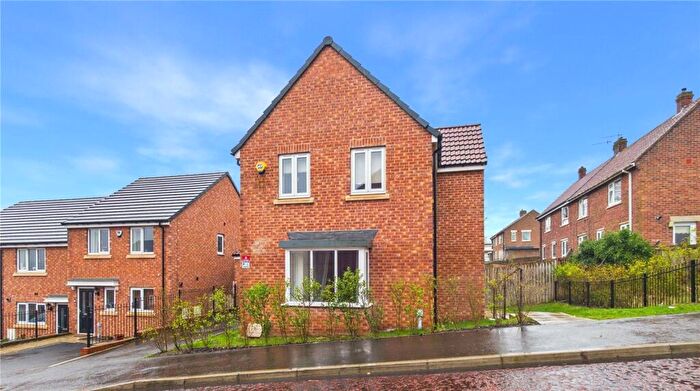
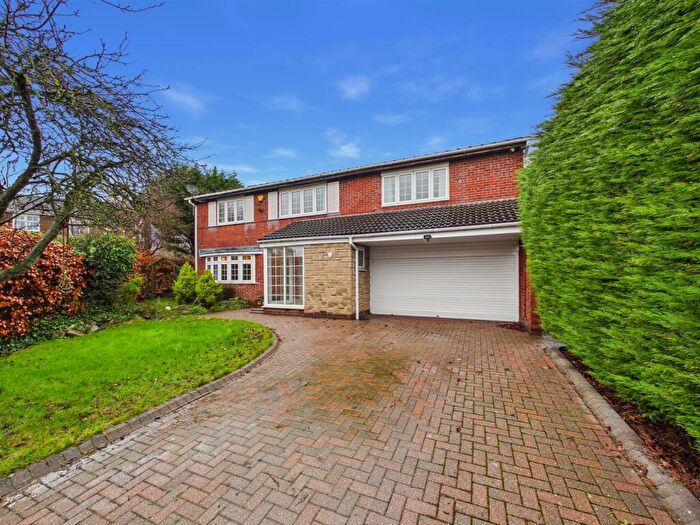
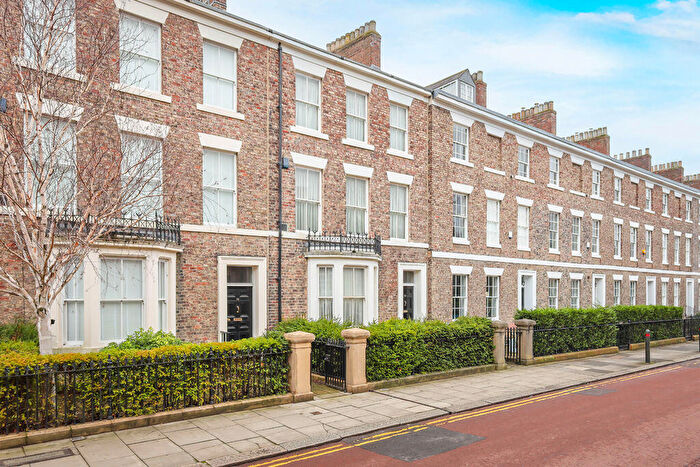
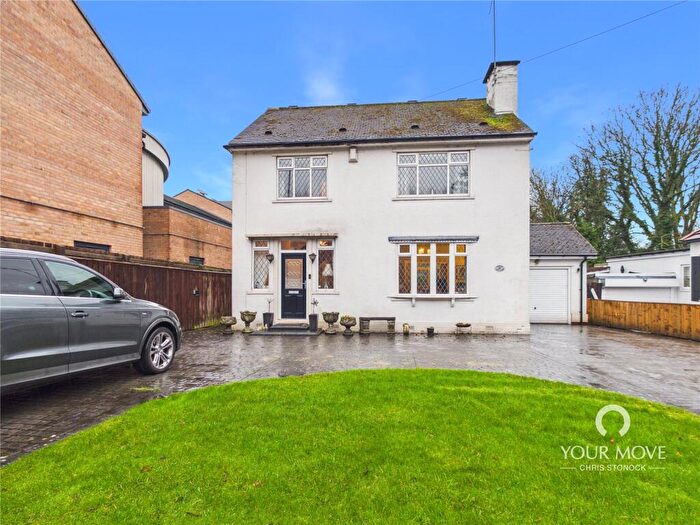
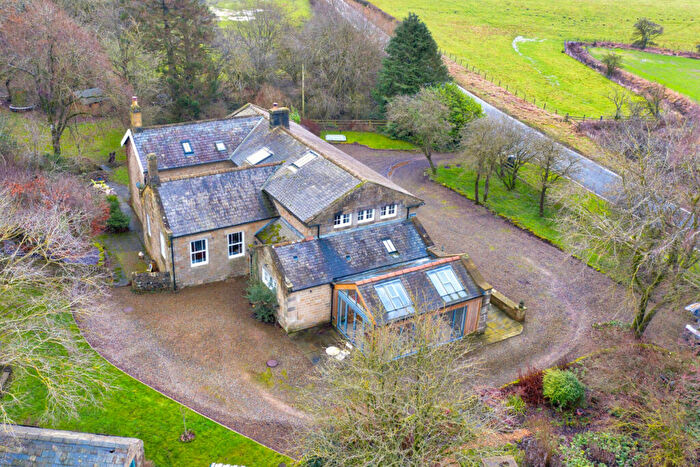
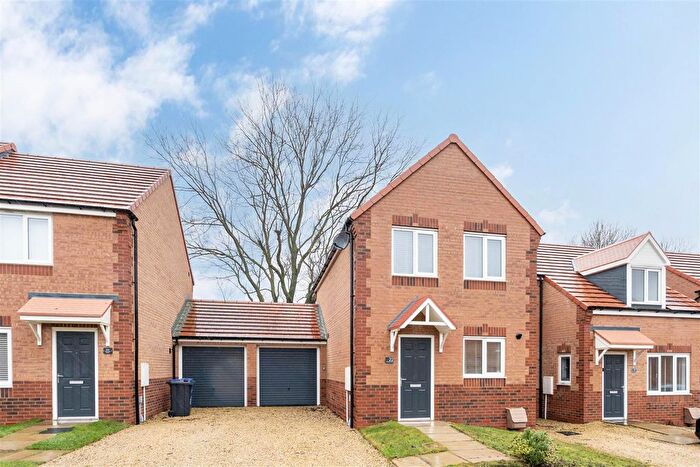
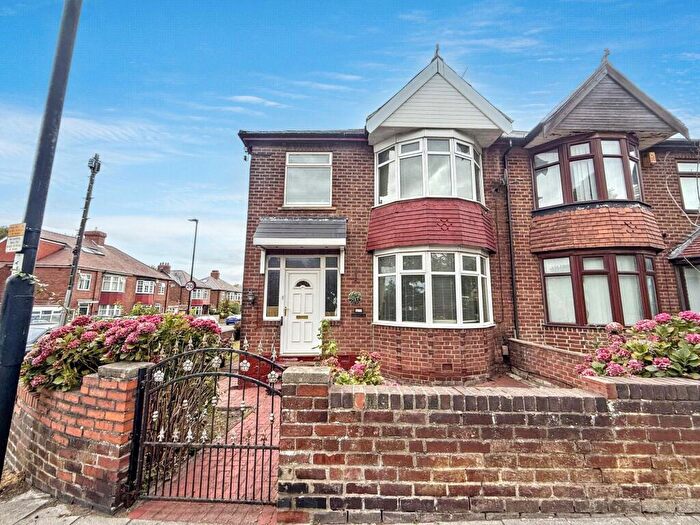
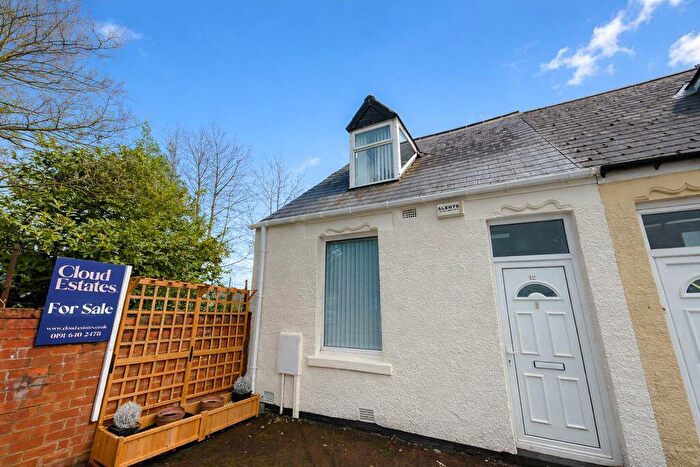
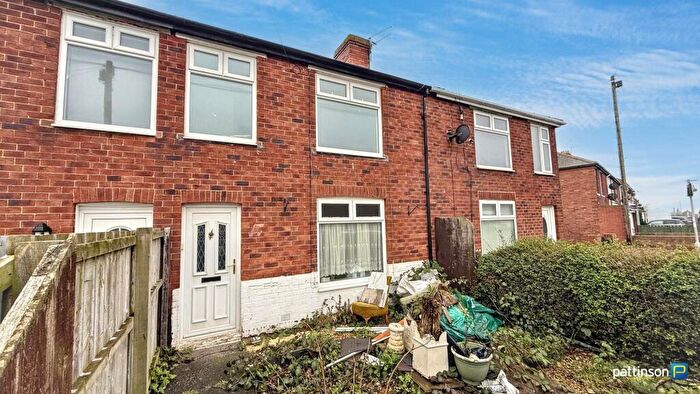
Houses and Flats for sale in NE, Newcastle upon Tyne
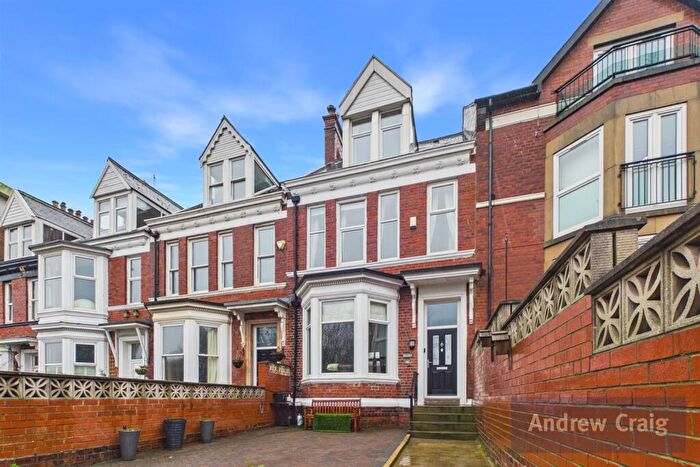
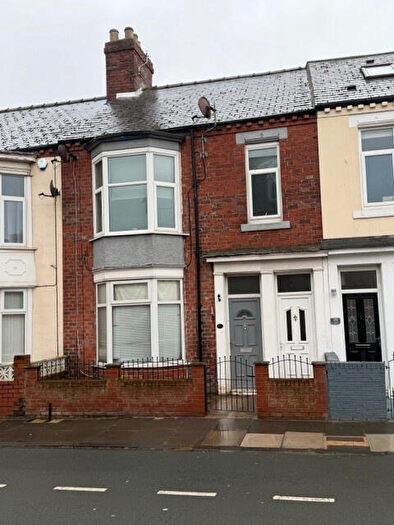

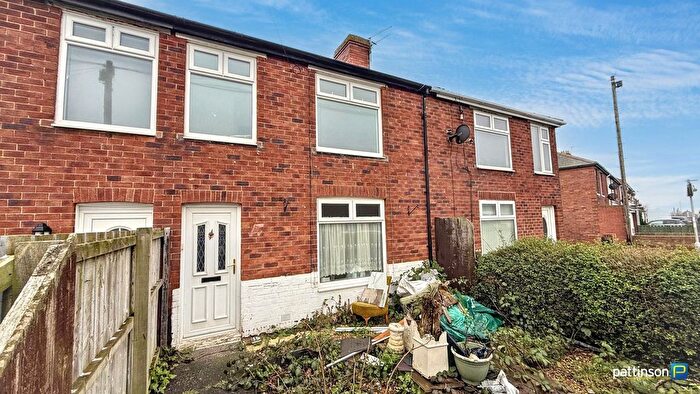
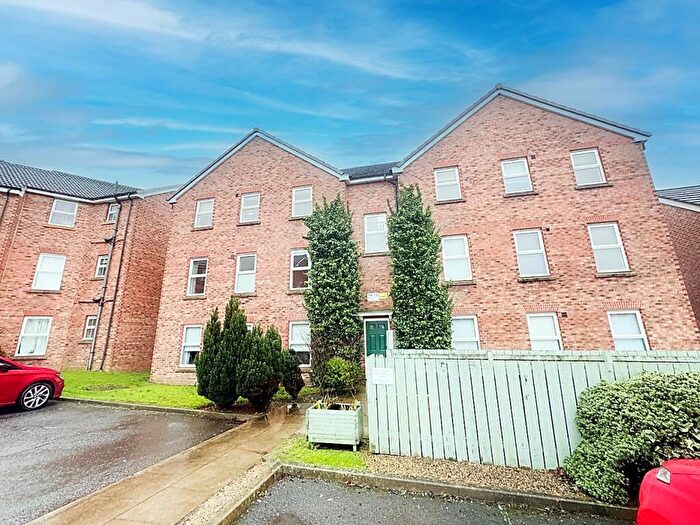
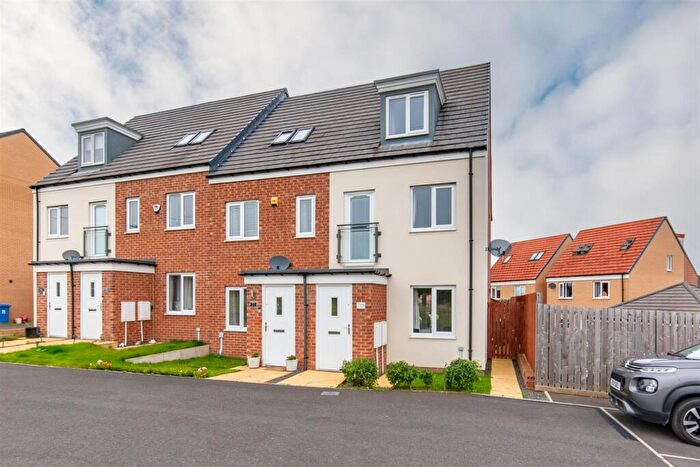
![]()
If you are looking to sell your house, let it out, or receive a property valuation, an expert can help you.
Click the button below to get started.
Postcode districts in NE, Newcastle upon Tyne
Navigate through our locations to find the location of your next house in NE, Newcastle upon Tyne, England for sale or to rent.
- NE17
- NE18
- NE1
- NE10
- NE11
- NE12
- NE13
- NE15
- NE16
- NE19
- NE2
- NE20
- NE21
- NE22
- NE23
- NE24
- NE25
- NE26
- NE27
- NE28
- NE29
- NE3
- NE30
- NE31
- NE32
- NE33
- NE34
- NE35
- NE36
- NE37
- NE38
- NE39
- NE4
- NE40
- NE41
- NE42
- NE43
- NE44
- NE45
- NE46
- NE47
- NE48
- NE49
- NE5
- NE6
- NE61
- NE62
- NE63
- NE64
- NE65
- NE66
- NE67
- NE68
- NE69
- NE7
- NE70
- NE71
- NE8
- NE9
- NE82
- NE83
- NE85
- NE88
- NE92
- NE98
- NE99
Transport in NE, Newcastle upon Tyne
Please see below transportation links in this area:
-
 Cramlington Station
 -
Manors Station
-
Newcastle Station
-
MetroCentre Station
-
Blaydon Station
-
Dunston Station
-
Heworth Station
-
Wylam Station
-
Morpeth Station
-
Pegswood Station
Frequently asked questions about NE
What is the average price for a property for sale in NE?
The average price for a property for sale in NE is £209,532. This amount is 42% lower than the average price in England. There are 5,028 property listings for sale in NE.
What locations have the most expensive properties for sale in NE?
The locations with the most expensive properties for sale in NE are NE69 at an average of £553,358, NE20 at an average of £543,679 and NE44 at an average of £496,386.
What locations have the most affordable properties for sale in NE?
The locations with the most affordable properties for sale in NE are NE17 at an average of £102,433, NE63 at an average of £120,948 and NE37 at an average of £124,970.
Which train stations are available in or near NE?
Some of the train stations available in or near NE are Cramlington, Manors and Newcastle.