
Properties for sale in OL2
Heyside, Royton, Shaw
- Info
- Price Paid By Year
- Property Type Price
- Transport
House Prices in OL2
Properties in OL2 have an average house price of £208,790.00 and had 1740 Property Transactions within the last 3 years.
The most expensive property was sold for £775,000.00.
Property Price Paid in OL2 by Year
The average sold property price by year was:
| Year | Average Sold Price | Sold Properties |
|---|---|---|
| 2026 | £198,525.00 | 39 Properties |
| 2025 | £219,448.00 | 570 Properties |
| 2024 | £208,373.00 | 645 Properties |
| 2023 | £197,666.00 | 486 Properties |
| 2022 | £196,609.00 | 640 Properties |
| 2021 | £187,001.00 | 797 Properties |
| 2020 | £169,233.00 | 582 Properties |
| 2019 | £149,602.00 | 686 Properties |
| 2018 | £145,089.00 | 661 Properties |
| 2017 | £147,439.00 | 714 Properties |
| 2016 | £144,164.00 | 683 Properties |
| 2015 | £131,055.00 | 590 Properties |
| 2014 | £127,226.00 | 553 Properties |
| 2013 | £127,327.00 | 471 Properties |
| 2012 | £121,944.00 | 321 Properties |
| 2011 | £124,790.00 | 385 Properties |
| 2010 | £128,709.00 | 410 Properties |
| 2009 | £124,790.00 | 339 Properties |
| 2008 | £138,863.00 | 549 Properties |
| 2007 | £138,493.00 | 895 Properties |
| 2006 | £132,402.00 | 973 Properties |
| 2005 | £125,676.00 | 726 Properties |
| 2004 | £113,727.00 | 771 Properties |
| 2003 | £84,529.00 | 851 Properties |
| 2002 | £72,154.00 | 934 Properties |
| 2001 | £61,823.00 | 793 Properties |
| 2000 | £57,329.00 | 763 Properties |
| 1999 | £54,009.00 | 847 Properties |
| 1998 | £54,303.00 | 775 Properties |
| 1997 | £54,386.00 | 820 Properties |
| 1996 | £48,043.00 | 695 Properties |
| 1995 | £47,640.00 | 616 Properties |
Property Price per Property Type in OL2
Here you can find historic sold price data in order to help with your property search.
The average Property Paid Price for specific property types in the last three years are:
| Property Type | Average Sold Price | Sold Properties |
|---|---|---|
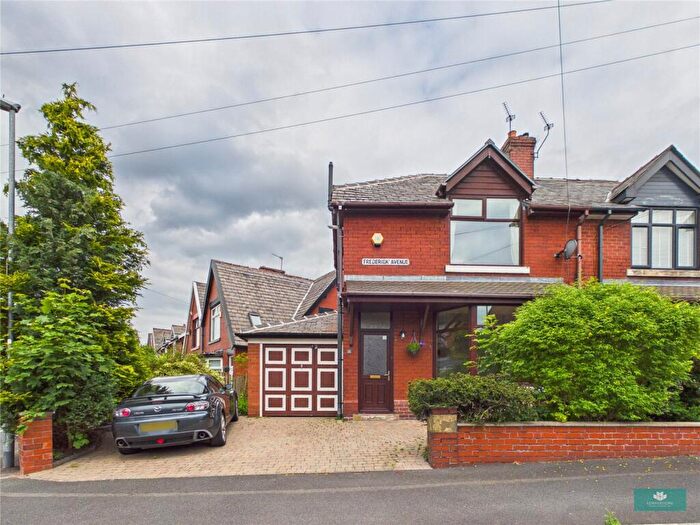
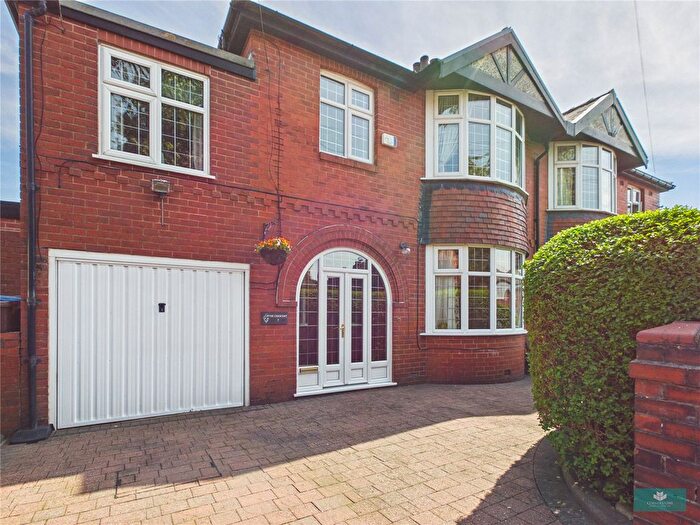
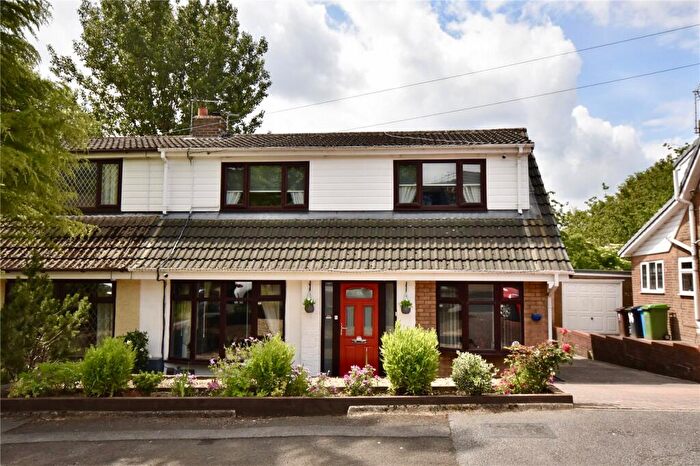
| Semi Detached House | £233,123.00 | 695 Semi Detached Houses |
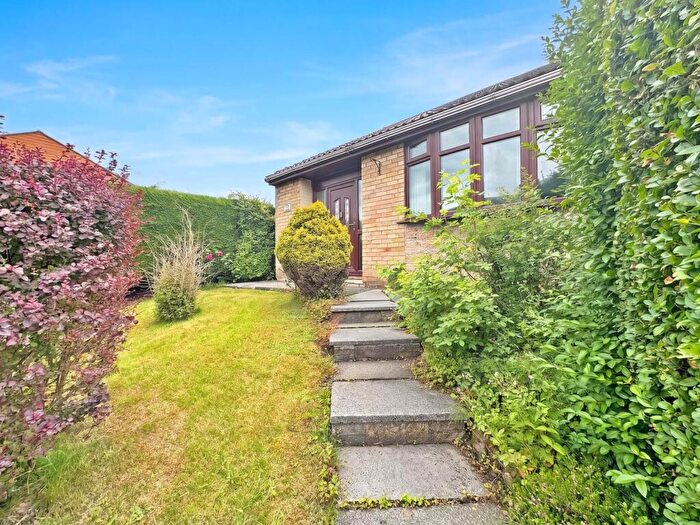
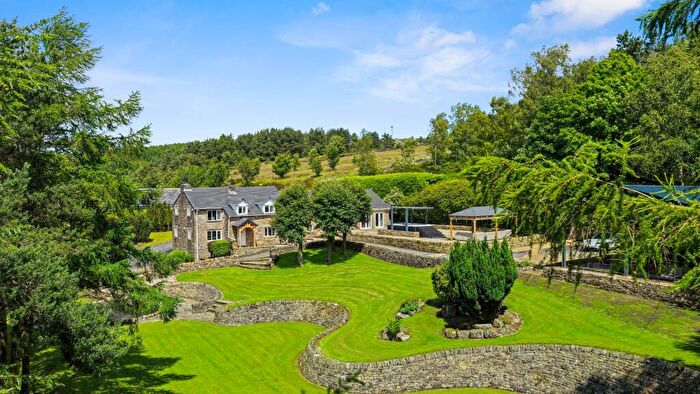
| Detached House | £339,339.00 | 205 Detached Houses |
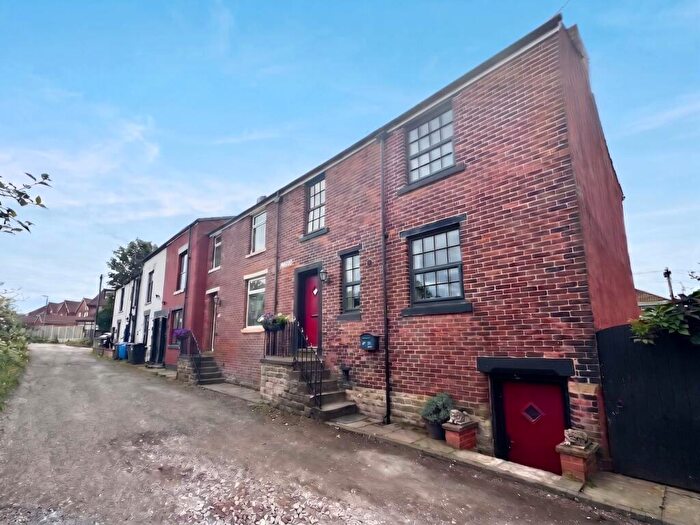
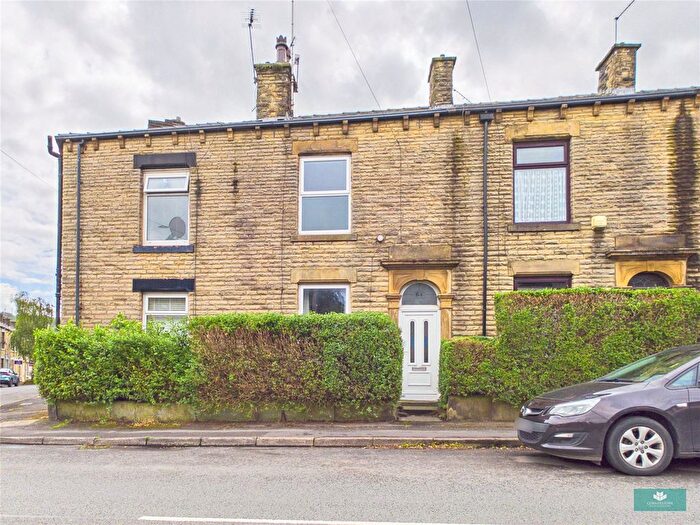
| Terraced House | £159,897.00 | 752 Terraced Houses |
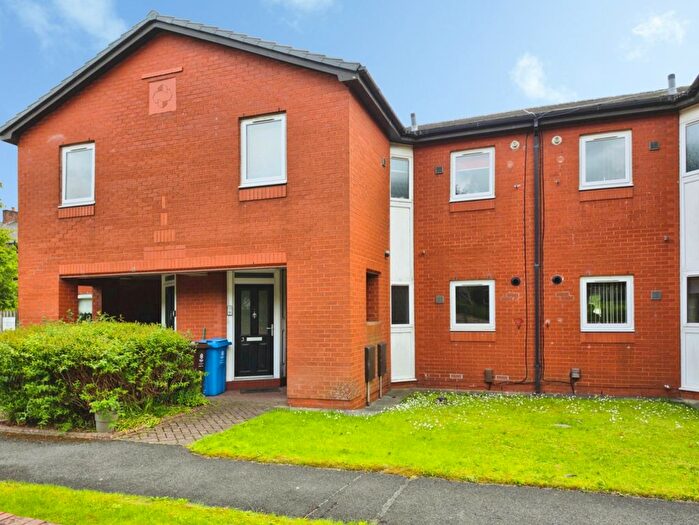
| Flat | £130,300.00 | 88 Flats |

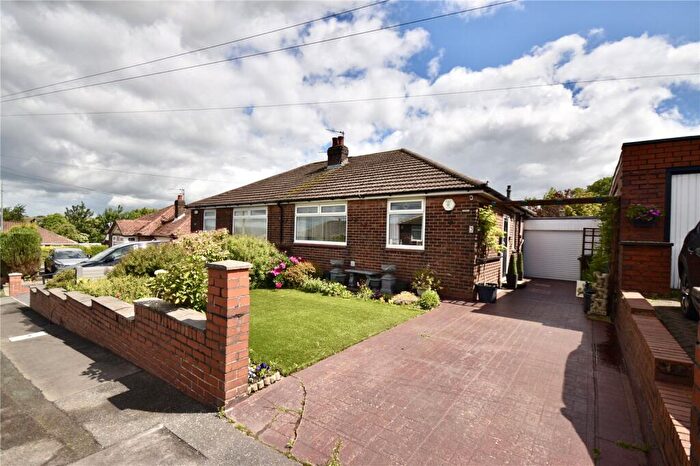
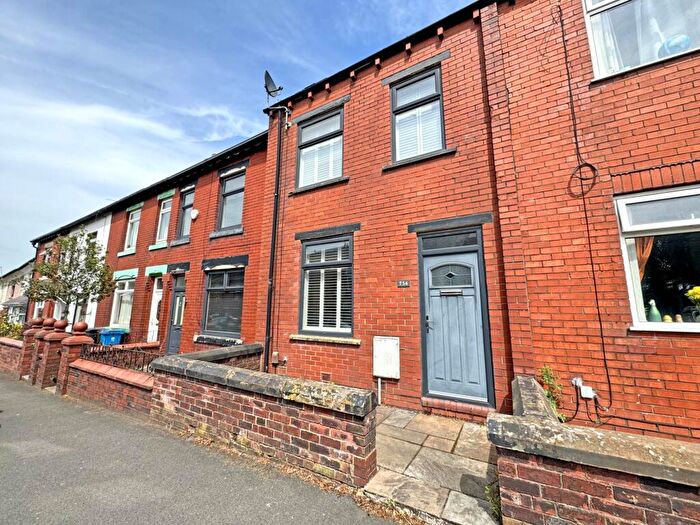
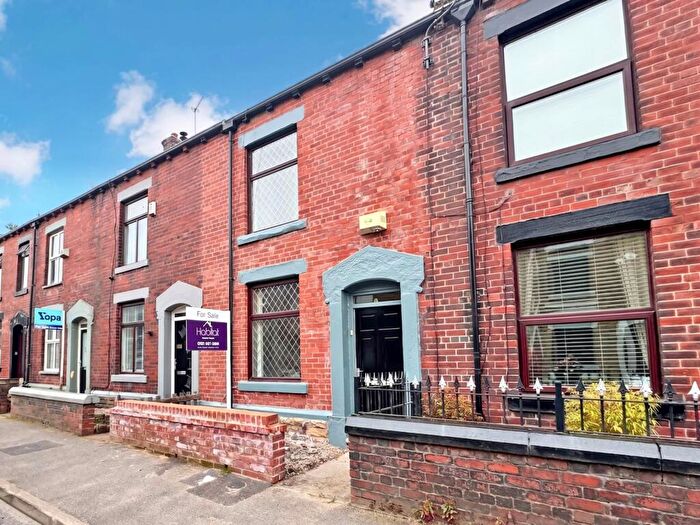
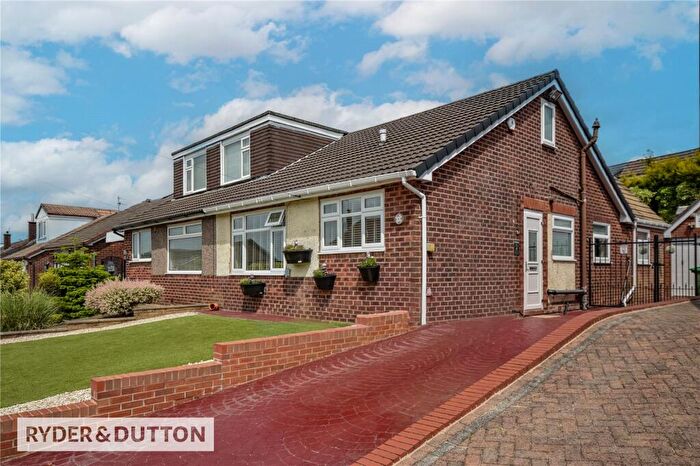
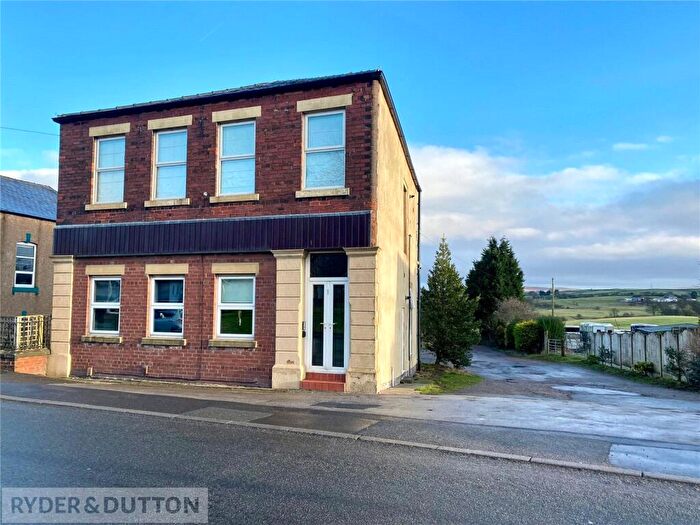
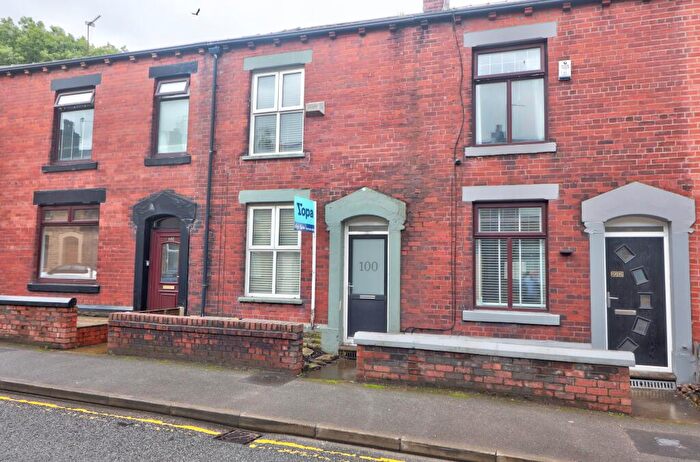
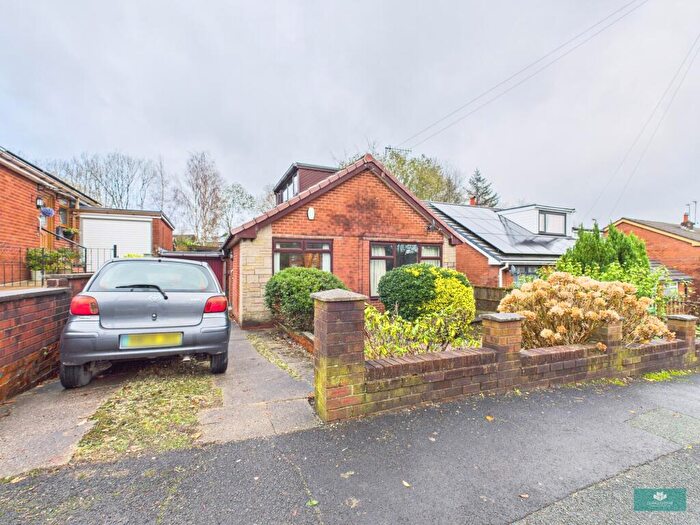
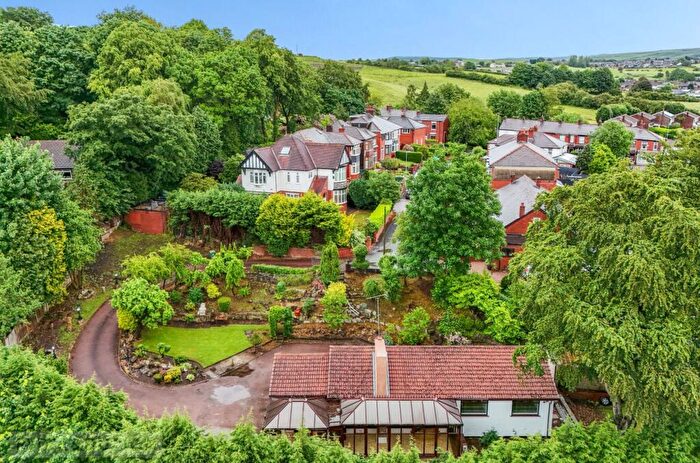
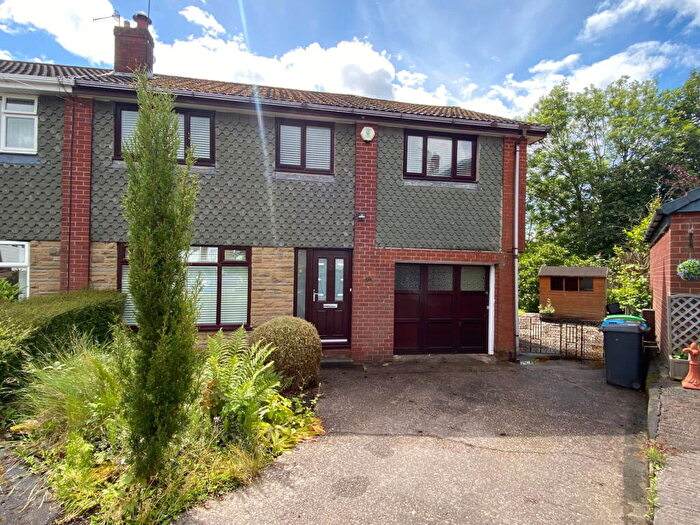
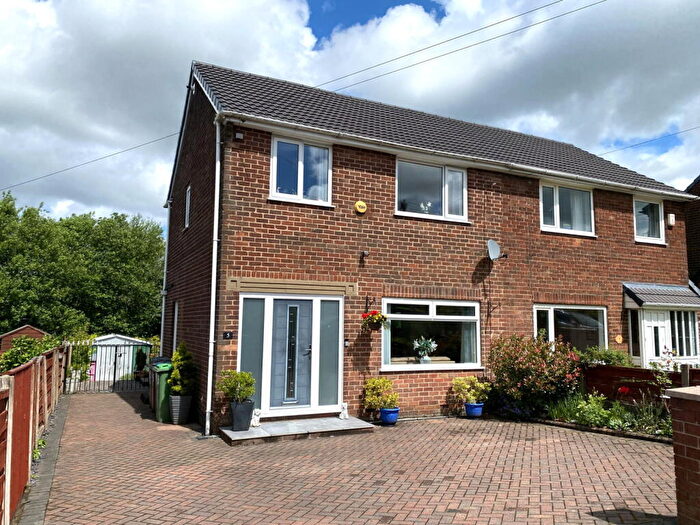
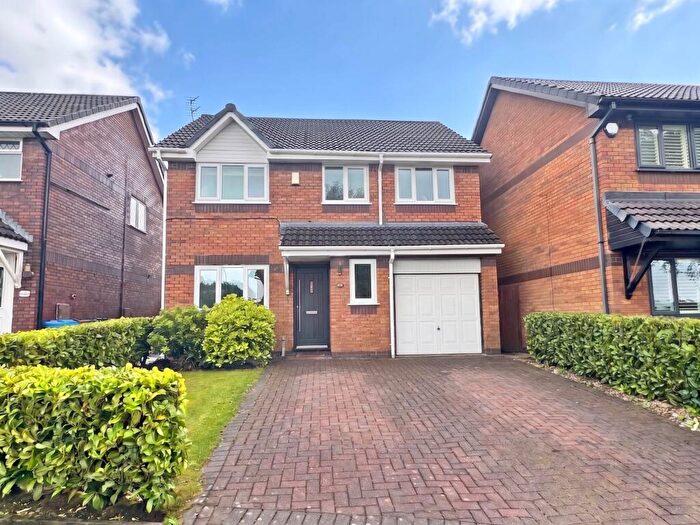
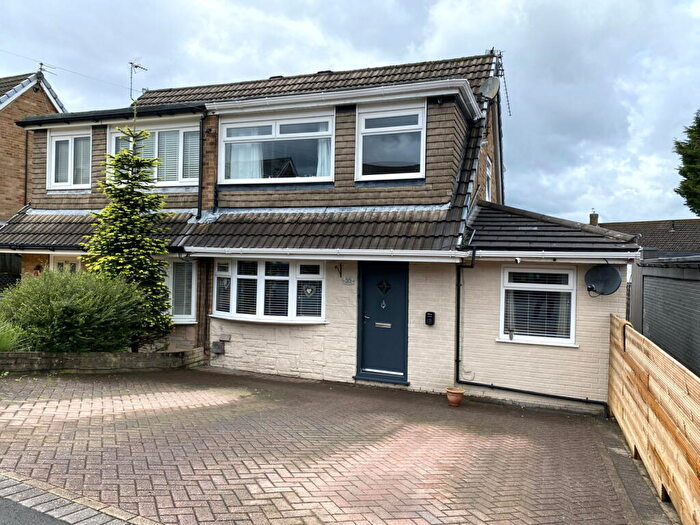
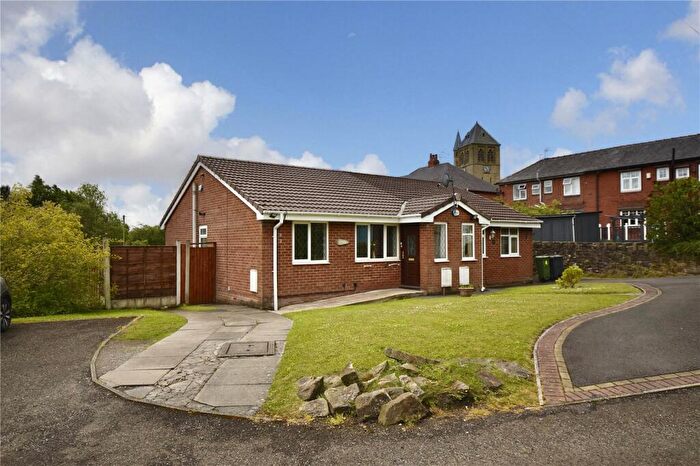
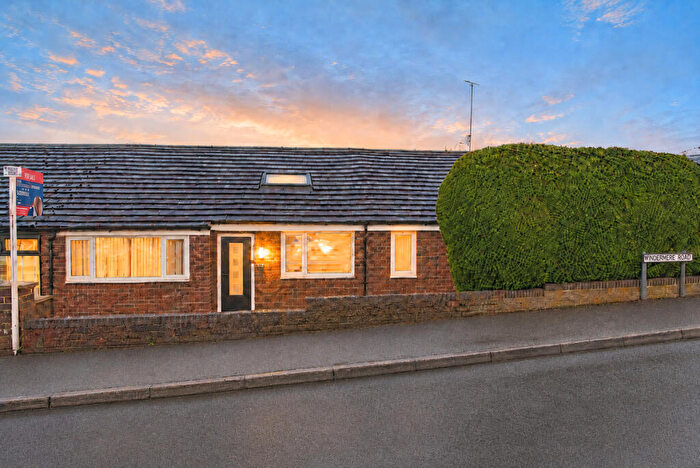
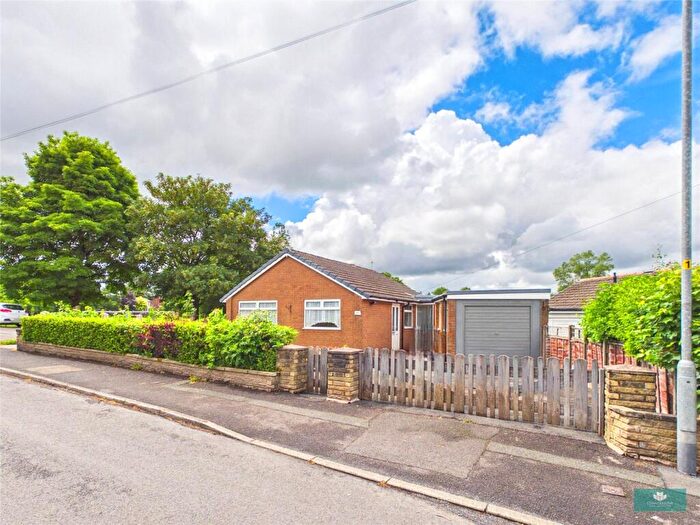
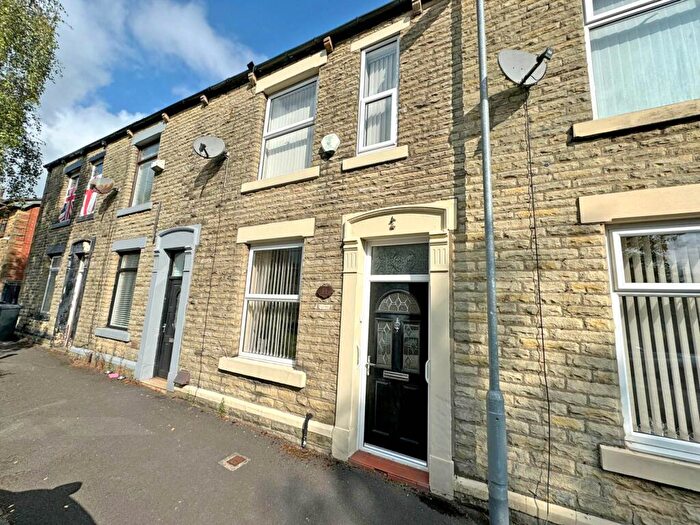
Houses and Flats for sale in OL2, Heyside, Royton, Shaw
There are 155 results. Property prices in OL2 range from £90k to £1.7M with an average price of £323k.
![]()
If you are looking to sell your house, let it out, or receive a property valuation, an expert can help you.
Click the button below to get started.
Frequently Asked Questions about OL2
What is the average price for a property for sale in OL2?
The average price for a property for sale in OL2 is £208,790. There are 155 property listings for sale in OL2.
Which areas are included in the OL2 postcode district?
The main areas within OL2 include Heyside, Royton and Shaw.
What are the most common property types in OL2?
The most common property types in OL2 are Terraced Houses, Semi Detached Houses, Detached Houses and Flats.
What has been the average sold property price in OL2 over the last three years?
Terraced Houses in OL2 have an average sold price of £159,897, while Semi Detached Houses have an average of £233,123. Detached Houses have an average of £339,339 and Flats have an average of £130,300. The average sold property price in OL2 over the last three years is approximately £208,782.