
Properties for sale in OL
Oldham
- Info
- Price Paid By Year
- Property Type Price
House Prices in OL
Properties in OL have an average house price of £201,850 and had 16868 Property Transactions within the last 3 years.
The most expensive property was sold for £1,500,000.
Property Price Paid in OL by Year
The average sold property price by year was:
| Year | Average Sold Price | Sold Properties |
|---|---|---|
| 2026 | £204,043.00 | 314 Properties |
| 2025 | £211,977.00 | 5,429 Properties |
| 2024 | £201,503.00 | 5,871 Properties |
| 2023 | £191,643.00 | 5,254 Properties |
| 2022 | £190,970.00 | 6,826 Properties |
| 2021 | £180,412.00 | 7,966 Properties |
| 2020 | £161,504.00 | 5,916 Properties |
| 2019 | £150,196.00 | 6,795 Properties |
| 2018 | £145,324.00 | 6,758 Properties |
| 2017 | £141,931.00 | 7,026 Properties |
| 2016 | £135,985.00 | 6,767 Properties |
| 2015 | £131,446.00 | 6,190 Properties |
| 2014 | £127,929.00 | 5,926 Properties |
| 2013 | £124,058.00 | 4,475 Properties |
| 2012 | £122,463.00 | 3,648 Properties |
| 2011 | £119,782.00 | 3,791 Properties |
| 2010 | £126,327.00 | 4,019 Properties |
| 2009 | £124,186.00 | 3,834 Properties |
| 2008 | £130,281.00 | 5,197 Properties |
| 2007 | £131,680.00 | 9,790 Properties |
| 2006 | £122,853.00 | 10,036 Properties |
| 2005 | £110,480.00 | 8,212 Properties |
| 2004 | £97,861.00 | 9,516 Properties |
| 2003 | £77,708.00 | 9,768 Properties |
| 2002 | £66,358.00 | 10,334 Properties |
| 2001 | £58,721.00 | 8,866 Properties |
| 2000 | £54,353.00 | 8,366 Properties |
| 1999 | £52,852.00 | 8,162 Properties |
| 1998 | £50,157.00 | 7,291 Properties |
| 1997 | £47,458.00 | 7,015 Properties |
| 1996 | £44,327.00 | 6,487 Properties |
| 1995 | £43,554.00 | 5,952 Properties |
Property Price per Property Type in OL
Here you can find historic sold price data in order to help with your property search.
The average Property Paid Price for specific property types in the last three years are:
| Property Type | Average Sold Price | Sold Properties |
|---|---|---|
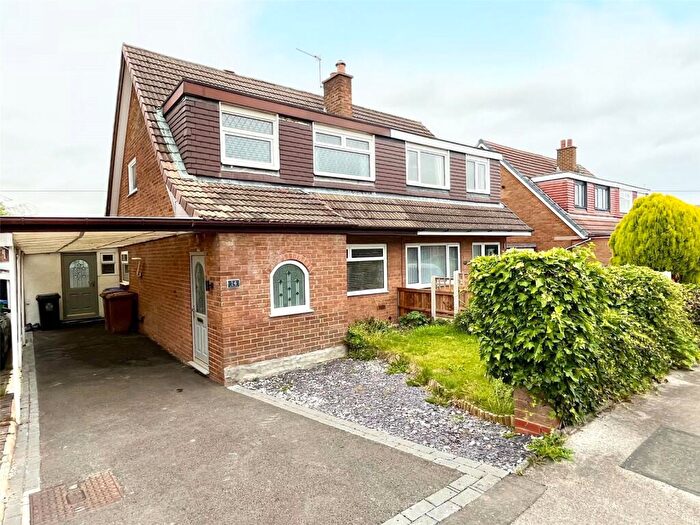
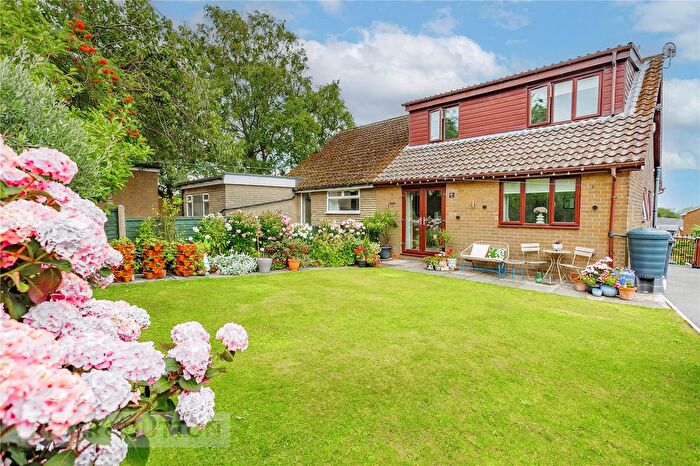
| Semi Detached House | £220,384.00 | 5,070 Semi Detached Houses |
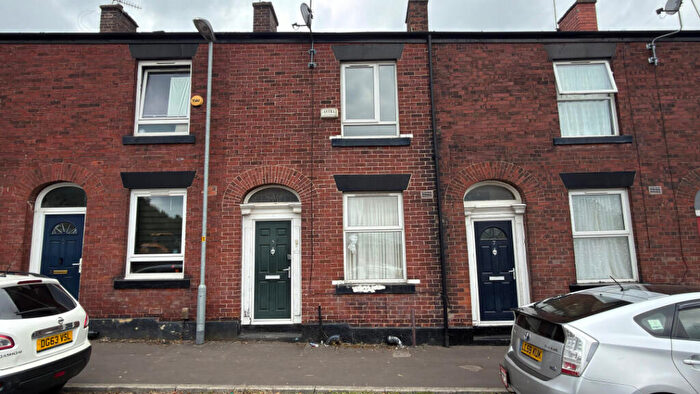
| Terraced House | £151,831.00 | 8,490 Terraced Houses |
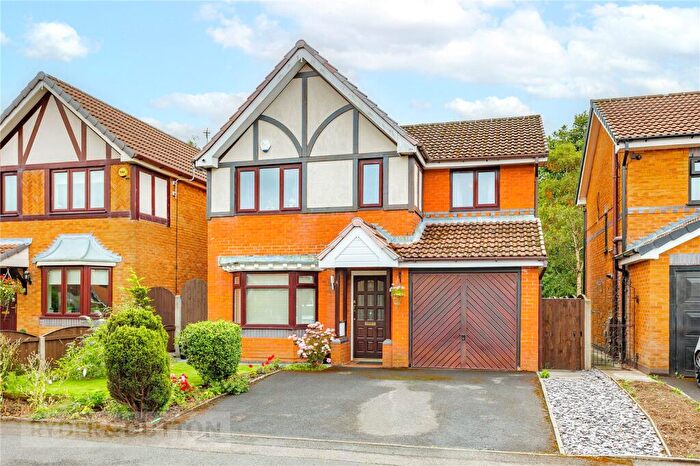
| Detached House | £368,034.00 | 2,377 Detached Houses |
| Flat | £132,758.00 | 931 Flats |
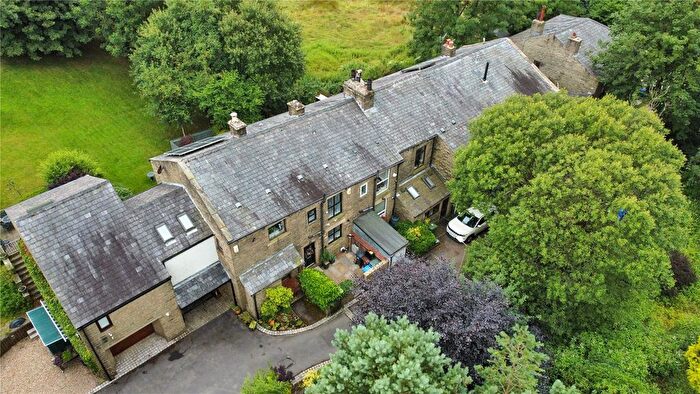
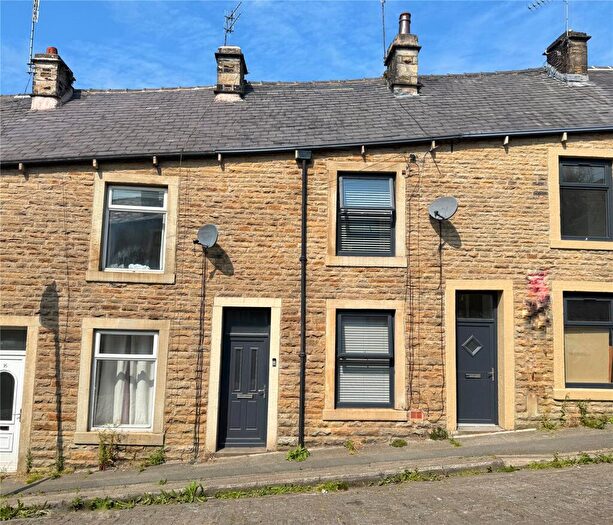
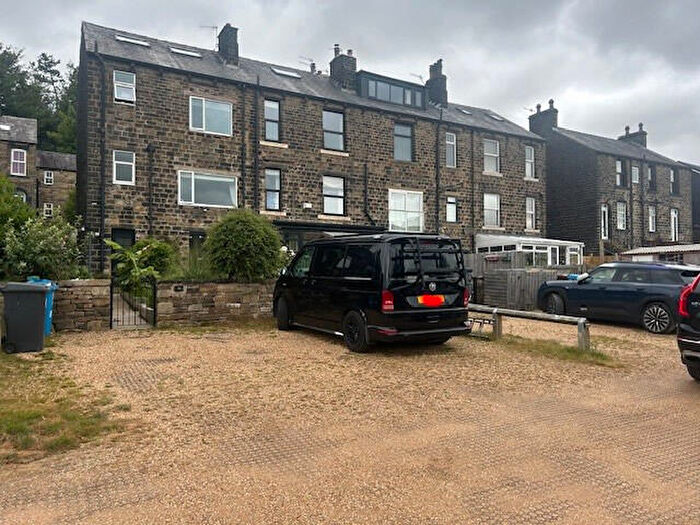
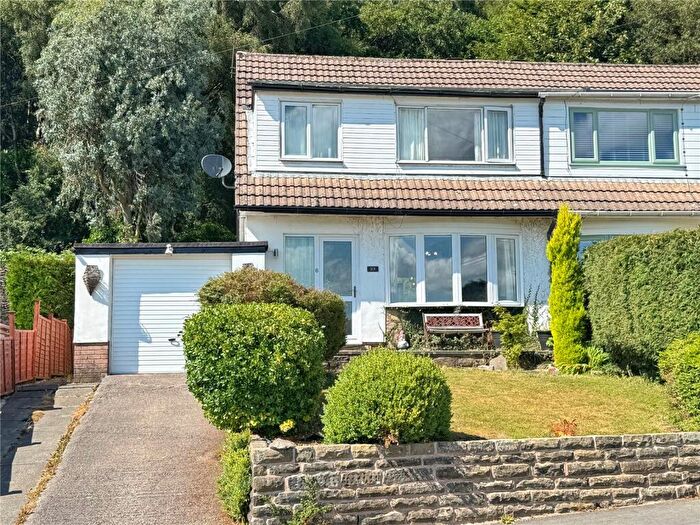
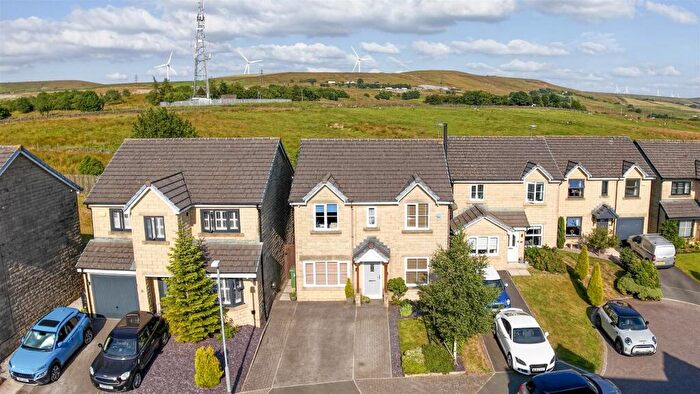
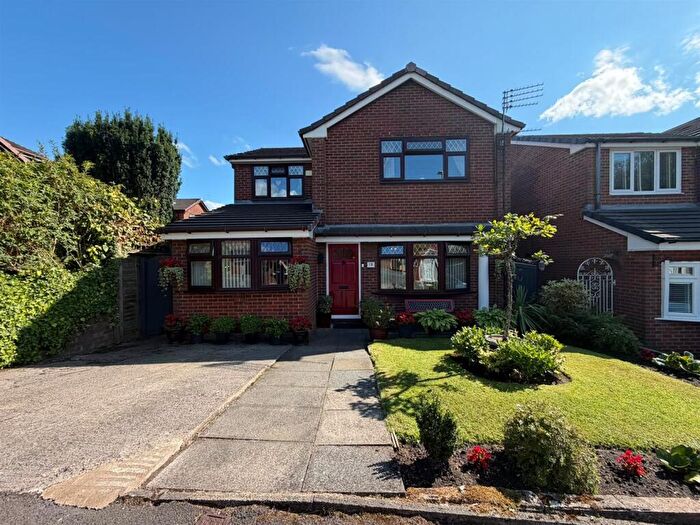
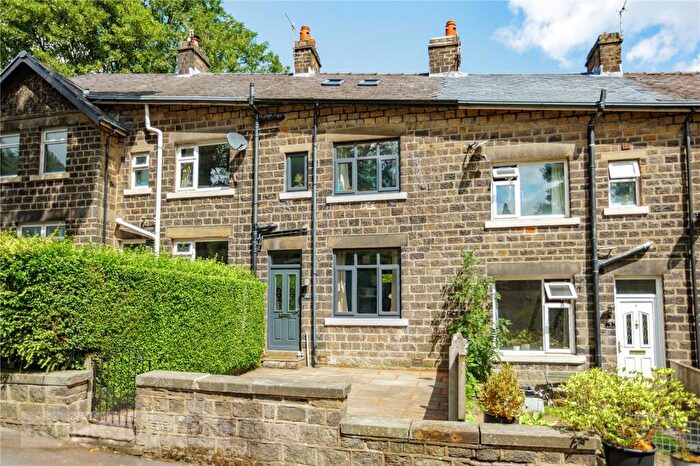
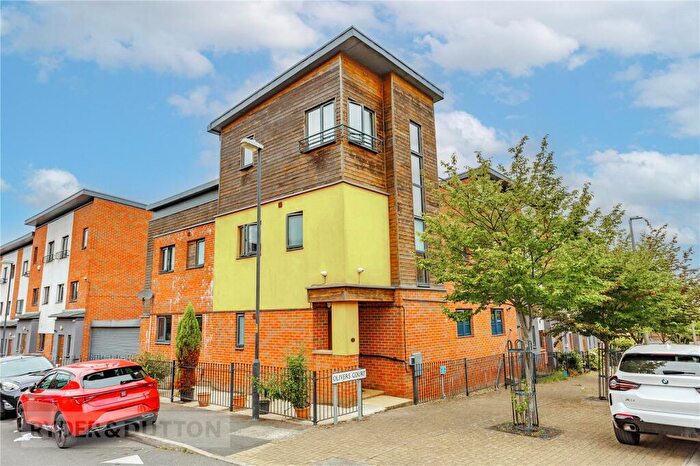
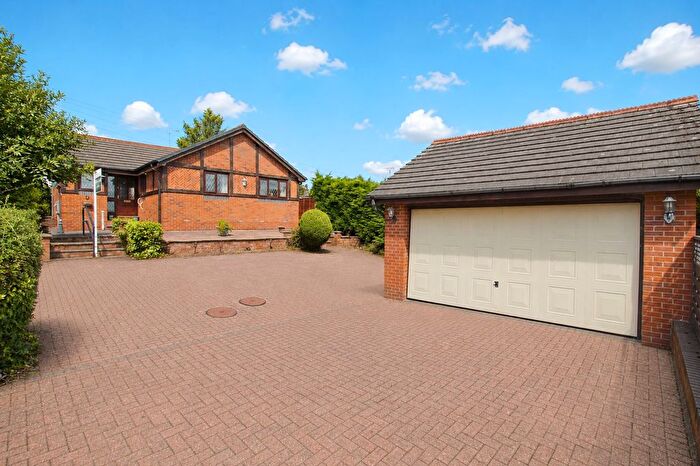
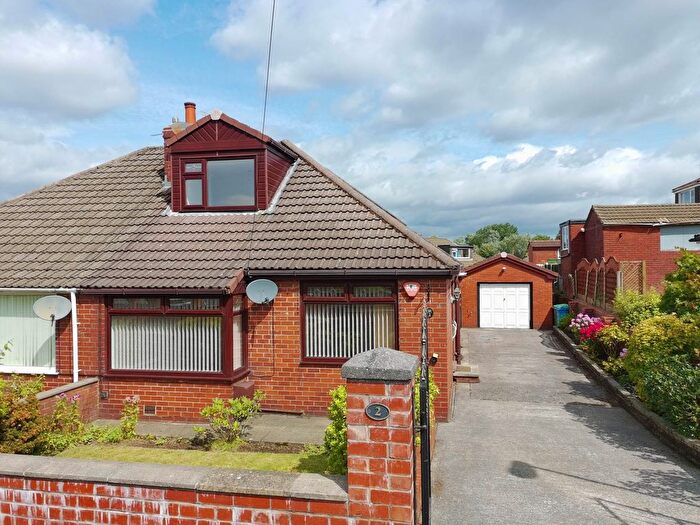
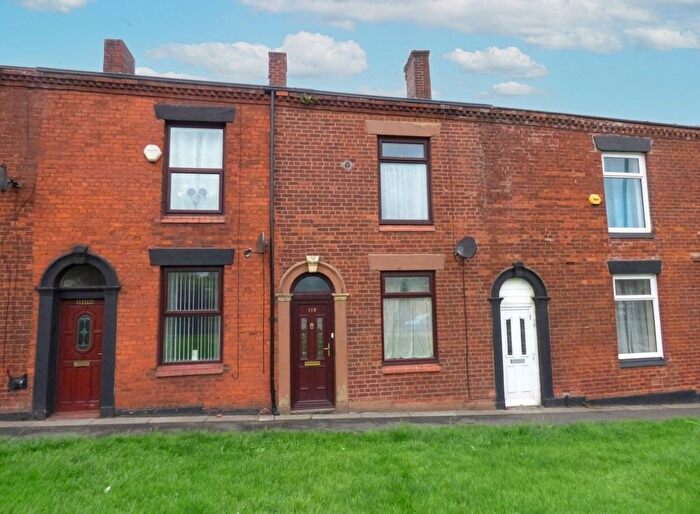
Houses and Flats for sale in OL, Oldham
There are 1,512 results. Property prices in OL range from £33k to £2.85M with an average price of £335k.
![]()
If you are looking to sell your house, let it out, or receive a property valuation, an expert can help you.
Click the button below to get started.

Postcode districts in OL, Oldham
Navigate through our locations to find the location of your next house in OL, Oldham, England for sale or to rent.
Transport in OL, Oldham
Please see below transportation links in this area:

Frequently asked questions about OL
What is the average price for a property for sale in OL?
The average price for a property for sale in OL is £201,850. This amount is 44% lower than the average price in England. There are 1,512 property listings for sale in OL.
What locations have the most expensive properties for sale in OL?
The locations with the most expensive properties for sale in OL are OL3 at an average of £338,301, OL15 at an average of £221,455 and OL11 at an average of £215,258.
What locations have the most affordable properties for sale in OL?
The locations with the most affordable properties for sale in OL are OL8 at an average of £161,583, OL1 at an average of £166,968 and OL13 at an average of £169,381.
Which train stations are available in or near OL?
Some of the train stations available in or near OL are Rochdale, Castleton and Mills Hill.