
Properties for sale in SE19
Upper Norwood, Crystal Palace, Crown Point, Norwood
- Info
- Price Paid By Year
- Property Type Price
- Transport
House Prices in SE19
Properties in SE19 have an average house price of £502,002.00 and had 1318 Property Transactions within the last 3 years.
The most expensive property was sold for £4,150,000.00.
Property Price Paid in SE19 by Year
The average sold property price by year was:
| Year | Average Sold Price | Sold Properties |
|---|---|---|
| 2026 | £565,874.00 | 27 Properties |
| 2025 | £504,063.00 | 449 Properties |
| 2024 | £505,185.00 | 438 Properties |
| 2023 | £491,991.00 | 404 Properties |
| 2022 | £469,932.00 | 553 Properties |
| 2021 | £477,845.00 | 718 Properties |
| 2020 | £480,576.00 | 419 Properties |
| 2019 | £459,658.00 | 455 Properties |
| 2018 | £460,189.00 | 460 Properties |
| 2017 | £456,835.00 | 453 Properties |
| 2016 | £433,766.00 | 502 Properties |
| 2015 | £393,898.00 | 623 Properties |
| 2014 | £344,429.00 | 631 Properties |
| 2013 | £297,233.00 | 606 Properties |
| 2012 | £268,237.00 | 421 Properties |
| 2011 | £259,490.00 | 358 Properties |
| 2010 | £267,760.00 | 330 Properties |
| 2009 | £230,017.00 | 242 Properties |
| 2008 | £246,453.00 | 323 Properties |
| 2007 | £243,737.00 | 783 Properties |
| 2006 | £221,059.00 | 772 Properties |
| 2005 | £200,046.00 | 600 Properties |
| 2004 | £191,817.00 | 678 Properties |
| 2003 | £181,069.00 | 673 Properties |
| 2002 | £160,961.00 | 827 Properties |
| 2001 | £127,830.00 | 709 Properties |
| 2000 | £108,258.00 | 776 Properties |
| 1999 | £99,593.00 | 773 Properties |
| 1998 | £74,476.00 | 617 Properties |
| 1997 | £66,820.00 | 673 Properties |
| 1996 | £59,645.00 | 520 Properties |
| 1995 | £57,540.00 | 426 Properties |
Property Price per Property Type in SE19
Here you can find historic sold price data in order to help with your property search.
The average Property Paid Price for specific property types in the last three years are:
| Property Type | Average Sold Price | Sold Properties |
|---|---|---|
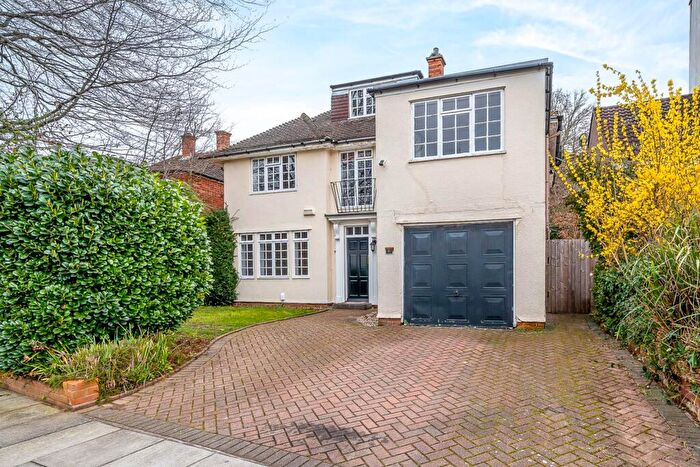
| Semi Detached House | £792,714.00 | 108 Semi Detached Houses |
| Detached House | £1,160,943.00 | 67 Detached Houses |
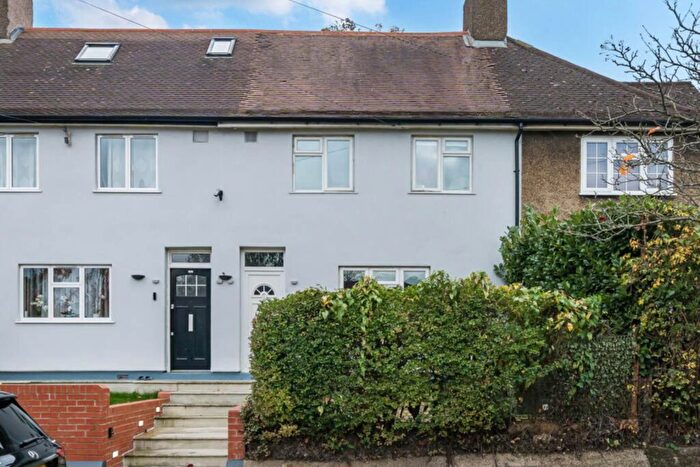
| Terraced House | £665,850.00 | 222 Terraced Houses |
| Flat | £380,482.00 | 921 Flats |


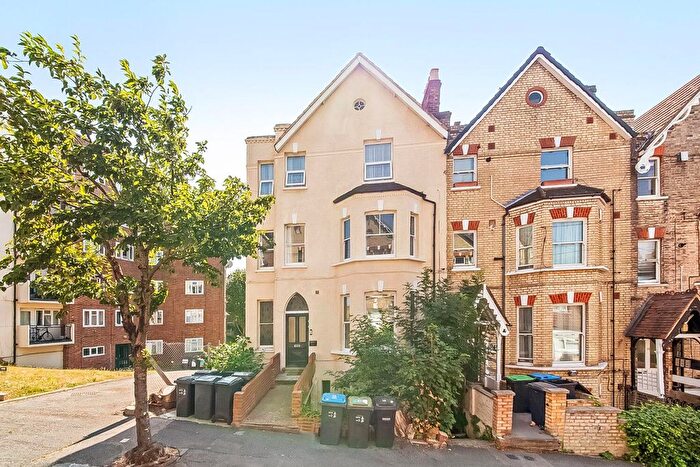
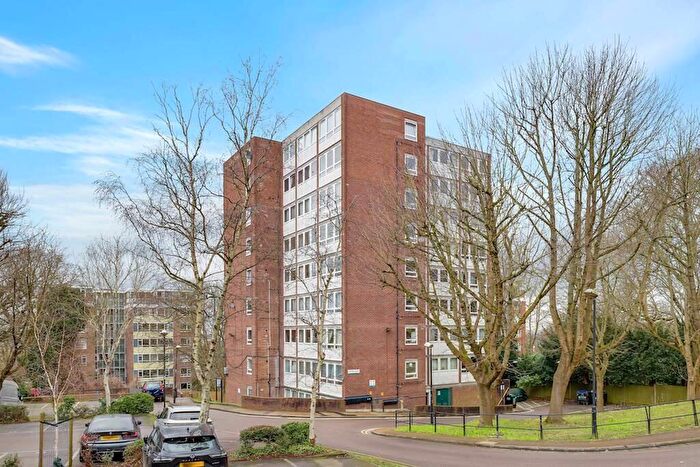
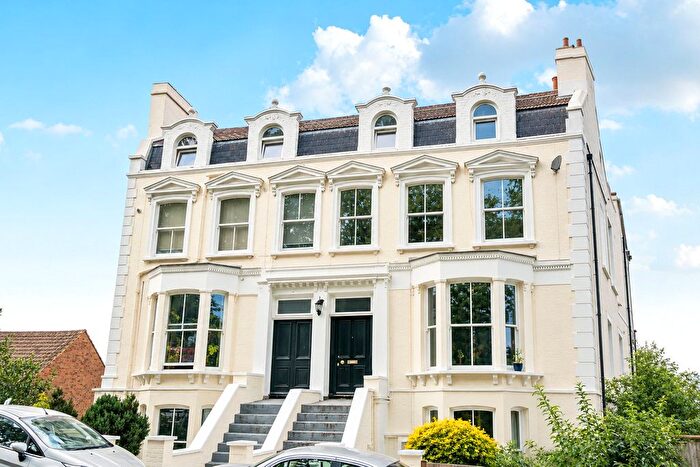
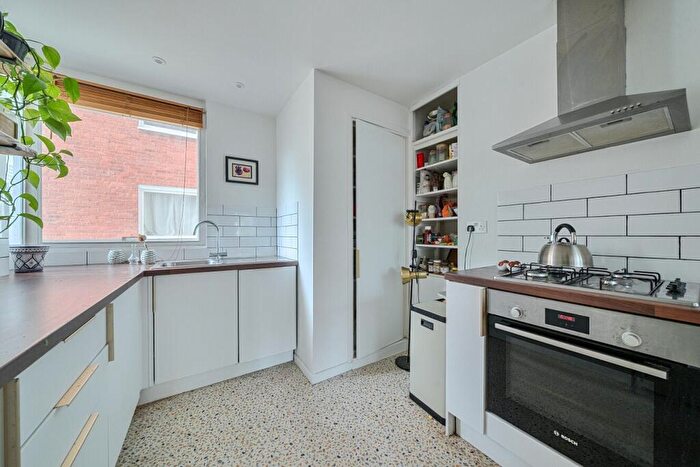
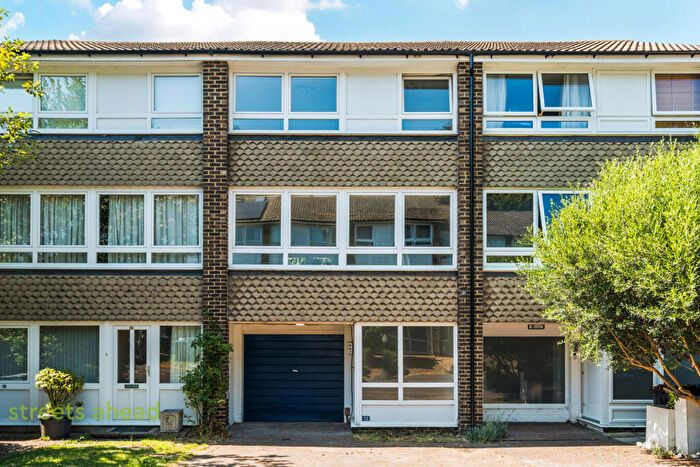
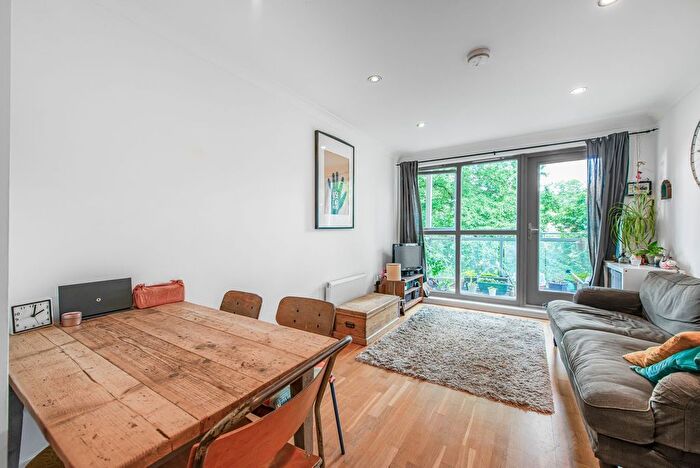
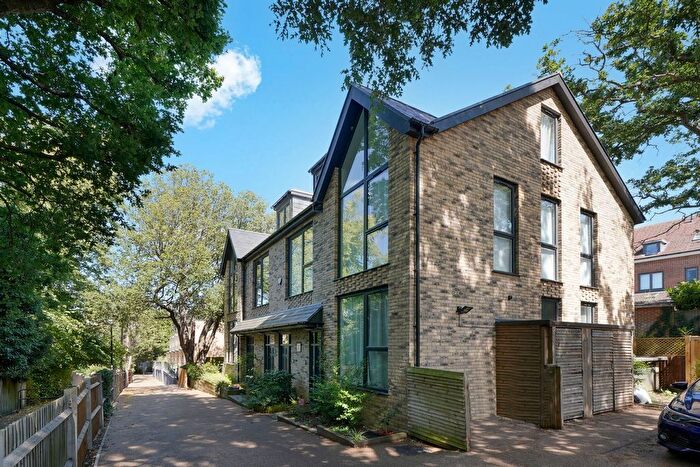
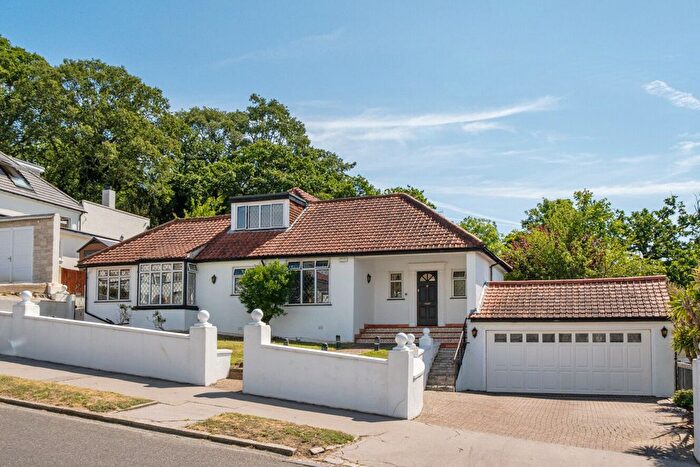
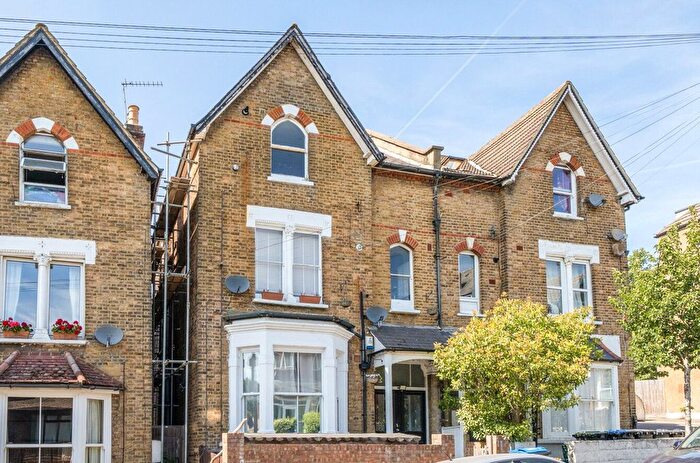
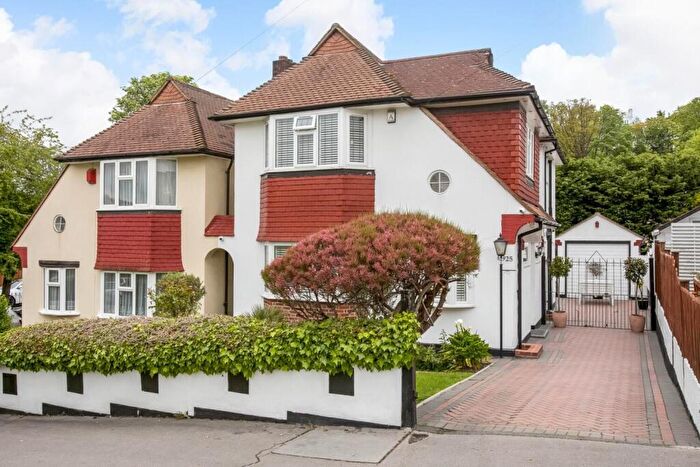
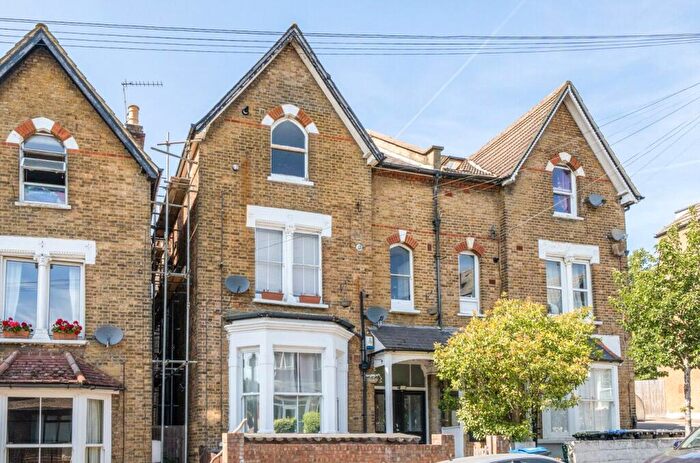
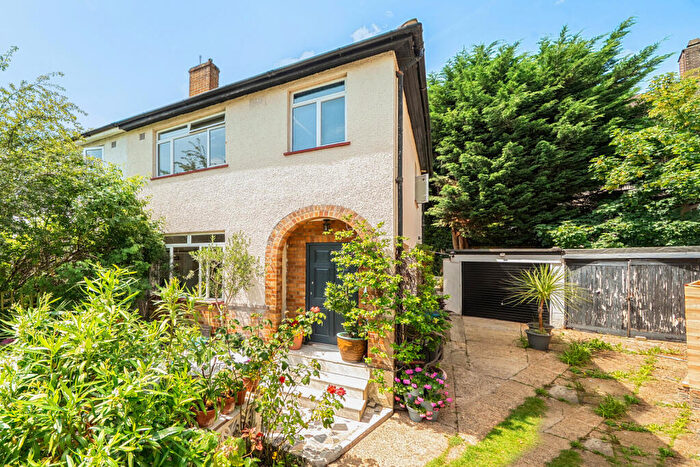
Houses and Flats for sale in SE19, Upper Norwood, Crystal Palace, Crown Point, Norwood
There are 181 results. Property prices in SE19 range from £81k to £3.75M with an average price of £542k.
![]()
If you are looking to sell your house, let it out, or receive a property valuation, an expert can help you.
Click the button below to get started.
Frequently Asked Questions about SE19
What is the average price for a property for sale in SE19?
The average price for a property for sale in SE19 is £502,002. There are 181 property listings for sale in SE19.
Which areas are included in the SE19 postcode district?
The main areas within SE19 include Upper Norwood, Crystal Palace, Crown Point and Norwood.
What are the most common property types in SE19?
The most common property types in SE19 are Flats, Terraced Houses, Semi Detached Houses and Detached Houses.
What has been the average sold property price in SE19 over the last three years?
Flats in SE19 have an average sold price of £380,482, while Terraced Houses have an average of £665,850. Semi Detached Houses have an average of £792,714 and Detached Houses have an average of £1,160,943. The average sold property price in SE19 over the last three years is approximately £525,041.
Which train stations are available in SE19?
The train stations available in SE19 are Crystal Palace Station and Gipsy Hill Station..