
Properties for sale in SS11
Wickford
- Info
- Price Paid By Year
- Property Type Price
- Transport
House Prices in SS11
Properties in SS11 have an average house price of £410,199.00 and had 1058 Property Transactions within the last 3 years.
The most expensive property was sold for £1,500,000.00.
Property Price Paid in SS11 by Year
The average sold property price by year was:
| Year | Average Sold Price | Sold Properties |
|---|---|---|
| 2026 | £414,600.00 | 129 Properties |
| 2025 | £416,640.00 | 344 Properties |
| 2024 | £408,978.00 | 316 Properties |
| 2023 | £401,284.00 | 269 Properties |
| 2022 | £416,070.00 | 316 Properties |
| 2021 | £401,110.00 | 420 Properties |
| 2020 | £391,595.00 | 287 Properties |
| 2019 | £383,565.00 | 343 Properties |
| 2018 | £387,141.00 | 358 Properties |
| 2017 | £344,367.00 | 345 Properties |
| 2016 | £315,090.00 | 377 Properties |
| 2015 | £267,459.00 | 364 Properties |
| 2014 | £262,208.00 | 384 Properties |
| 2013 | £225,949.00 | 283 Properties |
| 2012 | £222,907.00 | 253 Properties |
| 2011 | £211,720.00 | 197 Properties |
| 2010 | £224,971.00 | 217 Properties |
| 2009 | £218,116.00 | 189 Properties |
| 2008 | £227,191.00 | 160 Properties |
| 2007 | £224,313.00 | 380 Properties |
| 2006 | £207,401.00 | 484 Properties |
| 2005 | £196,254.00 | 303 Properties |
| 2004 | £191,457.00 | 349 Properties |
| 2003 | £178,216.00 | 307 Properties |
| 2002 | £156,790.00 | 390 Properties |
| 2001 | £120,416.00 | 376 Properties |
| 2000 | £106,524.00 | 344 Properties |
| 1999 | £91,744.00 | 438 Properties |
| 1998 | £86,872.00 | 356 Properties |
| 1997 | £76,434.00 | 416 Properties |
| 1996 | £70,429.00 | 299 Properties |
| 1995 | £68,811.00 | 272 Properties |
Property Price per Property Type in SS11
Here you can find historic sold price data in order to help with your property search.
The average Property Paid Price for specific property types in the last three years are:
| Property Type | Average Sold Price | Sold Properties |
|---|---|---|
| Detached House | £560,699.00 | 300 Detached Houses |
| Flat | £209,081.00 | 129 Flats |
| Semi Detached House | £392,926.00 | 484 Semi Detached Houses |
| Terraced House | £335,400.00 | 145 Terraced Houses |

Houses and Flats for sale in SS11, Wickford

There are 151 results. Property prices in SS11 range from £127k to £800k with an average price of £397k.
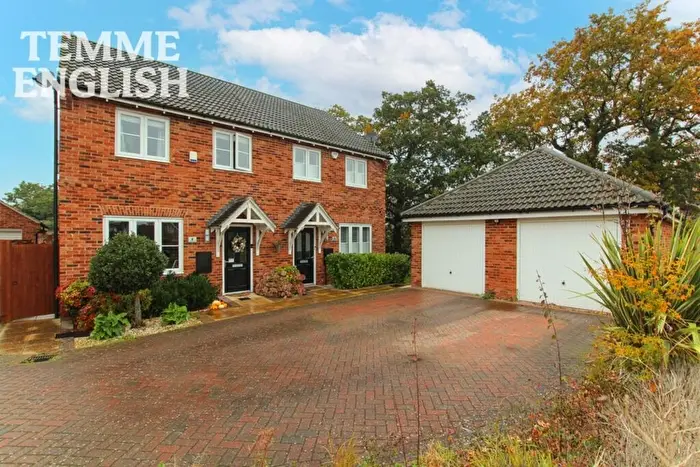

 3 Bedrooms
 2 Bathrooms


If you are looking to sell your house, let it out, or receive a property valuation, an expert can help you.
Click the button below to get started.


Property market in SS11
What's for sale
183 homes · share, count and typical priceHow many bedrooms
share, count and typical pricePrice bands
183 homesHouses and flats compared
| Houses | Flats | |
|---|---|---|
| Share of homes for sale | 62% | 19% |
| Typical asking price | £433k | £200k |
| Average bedrooms | 3.3 | 1.6 |
| Typical time to sell | 8 weeks | 11 weeks |
| Gross rental yield | 4.9% | 7.2% |
Asking prices over time
typical asking price of the homes first listed each quarter · no change since 2024 Q4Prices in and around SS11
typical asking price, cheapest firstSchools in SS11
3 primary · 1 secondary · 100% rated good or outstanding- Beauchamps High School secondary · Outstanding
- The Wickford Church of England School primary · Outstanding
- Runwell Community Primary School primary · Good
- Hilltop Junior School primary · Good
Based on 183 homes for sale on Houses now, 712 listings that left the market in the last 12 months, the asking prices of the homes listed over the last two years. Sold prices: HM Land Registry Price Paid Data, Aug 2025 to Aug 2026 (Crown copyright). Schools: Ofsted. Updated November 2026.
Frequently Asked Questions about SS11
What is the average house price in SS11?
The average home for sale in SS11 is priced at £394,000. A typical home, the one in the middle of the range, is £375,000. This is based on the 183 homes for sale on Houses right now.
How much does a 2 or 3 bedroom home cost in SS11?
A typical 2-bedroom home in SS11 costs £275,000 and a 3-bedroom home £378,000. So the extra bedroom adds about £103,000. 1-bedroom homes start at around £172,000, and 4-bedroom homes are about £550,000.
What price range should I expect in SS11?
Most homes in SS11 are priced between £129,000 and £836,000, leaving out the very cheapest and most expensive. One in five costs less than £230,000, and one in five £540,000 or more.
How many homes are for sale in SS11?
There are 151 homes for sale in SS11 on Houses right now, plus 9 already under offer. 53 new listings came onto the market in the last 30 days.
Are house prices going up in SS11?
No, they are falling. Homes put up for sale in SS11 over the last 12 months were advertised at a typical £375,000, 6.3% lower than the year before (£400,000).
How long does it take to sell a home in SS11?
Homes usually sell or come off the market within about 9 weeks. About 28% go within the first month, and a quarter take longer than about 5 months. Houses go faster, in about 8 weeks against about 11 weeks for flats.
What rental yield can I get in SS11?
About 7.2% gross for flats and 4.9% for houses. That compares typical rents with what flats and houses actually sold for in SS11 over the last year. Running costs, voids and mortgage interest are not taken off.
What type of homes are for sale in SS11?
Detached houses are the most common, about a quarter of homes for sale in SS11. Flats and apartments come next, followed by semi-detached houses. Flats and apartments are the cheapest, at about £200,000, and detached houses the most expensive, at about £550,000.
Where are the cheapest places to buy near SS11?
Of the areas around SS11, SS13 is the cheapest, with a typical asking price of £300,000, followed by SS14 (£300,000) and SS12 (£375,000). SS11 itself is £375,000.
Are homes in SS11 freehold or leasehold?
About three quarters of homes for sale in SS11 are freehold and the rest leasehold, which is mostly flats. There are 3 new-build homes on the market too.
What are the schools like in SS11?
There are 3 primary and 1 secondary schools in SS11. 100% of those inspected by Ofsted were rated good or outstanding, and 2 were outstanding.
Which areas are included in the SS11 postcode district?
The main area within SS11 is Wickford.
What has been the average sold property price in SS11 over the last three years?
Semi Detached Houses in SS11 have an average sold price of £392,926, while Detached Houses have an average of £560,699. Terraced Houses have an average of £335,400 and Flats have an average of £209,081. The average sold property price in SS11 over the last three years is approximately £413,406.
Which train stations are available in SS11?
The train stations available in SS11 are Battlesbridge Station and Wickford Station.