
Properties for sale in SS5
Hockley
- Info
- Price Paid By Year
- Property Type Price
- Transport
House Prices in SS5
Properties in SS5 have an average house price of £447,411.00 and had 933 Property Transactions within the last 3 years.
The most expensive property was sold for £2,100,000.00.
Property Price Paid in SS5 by Year
The average sold property price by year was:
| Year | Average Sold Price | Sold Properties |
|---|---|---|
| 2026 | £431,780.00 | 25 Properties |
| 2025 | £464,825.00 | 308 Properties |
| 2024 | £444,996.00 | 324 Properties |
| 2023 | £432,229.00 | 276 Properties |
| 2022 | £491,233.00 | 347 Properties |
| 2021 | £456,858.00 | 448 Properties |
| 2020 | £419,792.00 | 304 Properties |
| 2019 | £394,533.00 | 338 Properties |
| 2018 | £393,852.00 | 362 Properties |
| 2017 | £380,162.00 | 412 Properties |
| 2016 | £372,308.00 | 389 Properties |
| 2015 | £343,370.00 | 420 Properties |
| 2014 | £312,661.00 | 383 Properties |
| 2013 | £268,414.00 | 312 Properties |
| 2012 | £253,380.00 | 260 Properties |
| 2011 | £251,070.00 | 259 Properties |
| 2010 | £261,159.00 | 247 Properties |
| 2009 | £230,160.00 | 277 Properties |
| 2008 | £250,571.00 | 268 Properties |
| 2007 | £265,060.00 | 412 Properties |
| 2006 | £258,286.00 | 425 Properties |
| 2005 | £240,218.00 | 319 Properties |
| 2004 | £235,530.00 | 394 Properties |
| 2003 | £213,792.00 | 416 Properties |
| 2002 | £178,078.00 | 476 Properties |
| 2001 | £153,354.00 | 432 Properties |
| 2000 | £129,414.00 | 396 Properties |
| 1999 | £99,982.00 | 451 Properties |
| 1998 | £96,465.00 | 380 Properties |
| 1997 | £80,606.00 | 387 Properties |
| 1996 | £76,803.00 | 426 Properties |
| 1995 | £77,247.00 | 315 Properties |
Property Price per Property Type in SS5
Here you can find historic sold price data in order to help with your property search.
The average Property Paid Price for specific property types in the last three years are:
| Property Type | Average Sold Price | Sold Properties |
|---|---|---|
| Semi Detached House | £399,073.00 | 472 Semi Detached Houses |
| Detached House | £587,339.00 | 320 Detached Houses |
| Terraced House | £352,987.00 | 67 Terraced Houses |
| Flat | £236,128.00 | 74 Flats |
Transport near SS5

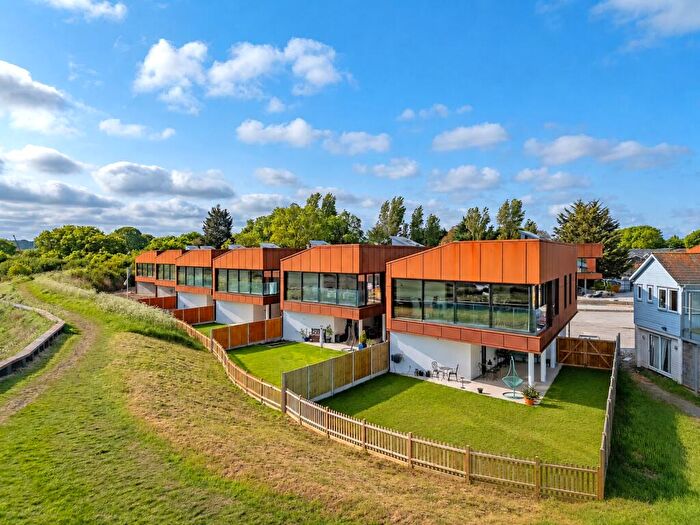
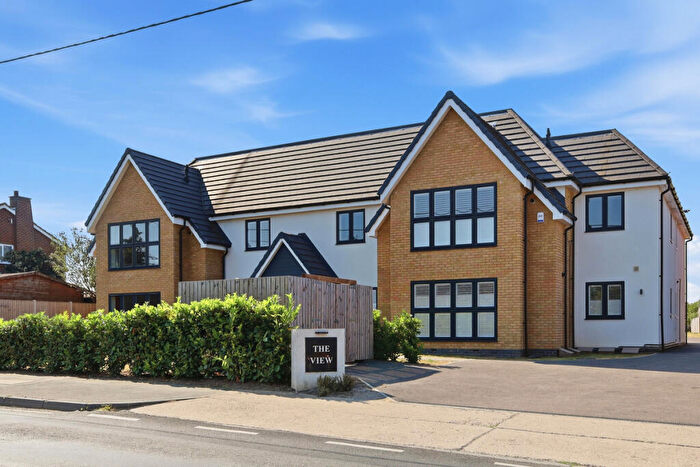
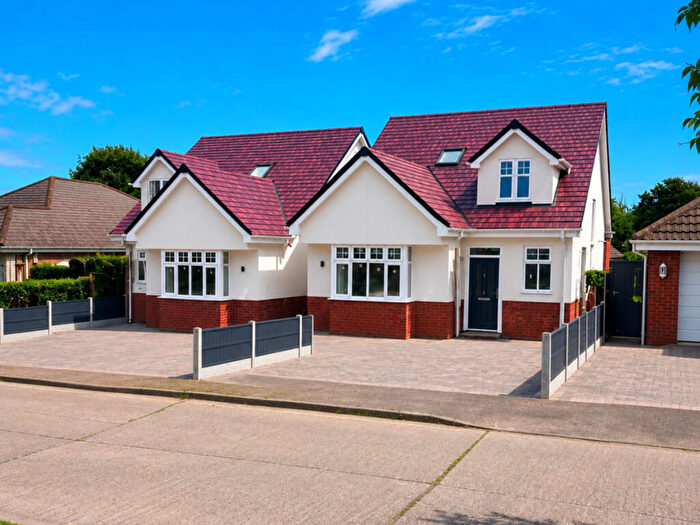
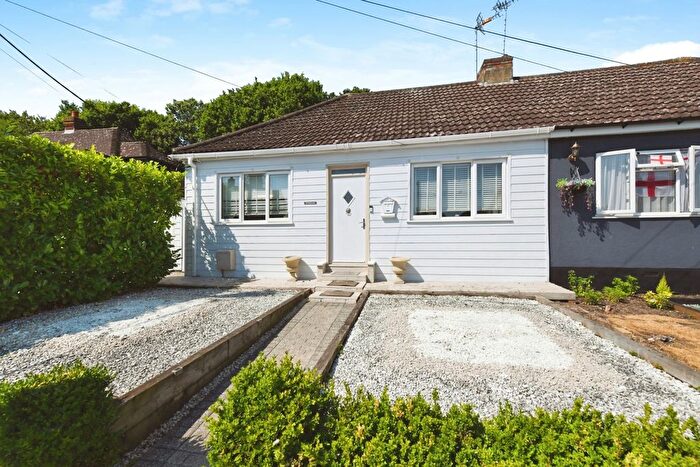
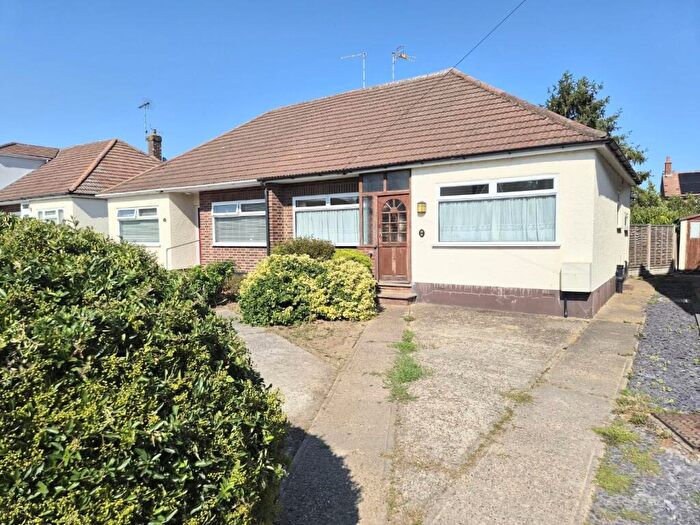
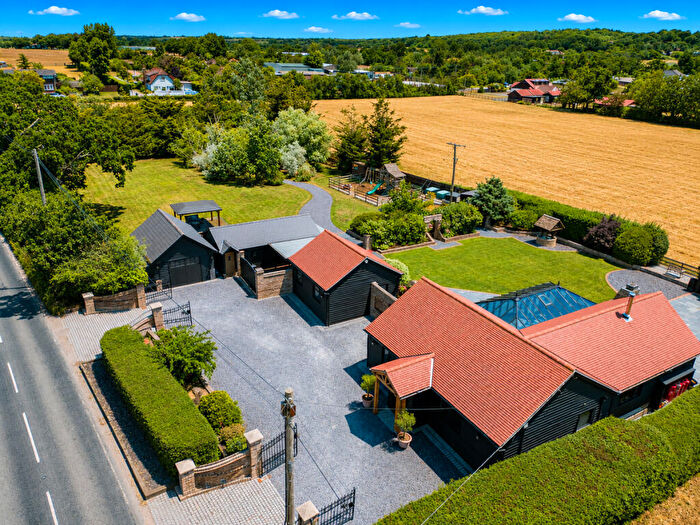
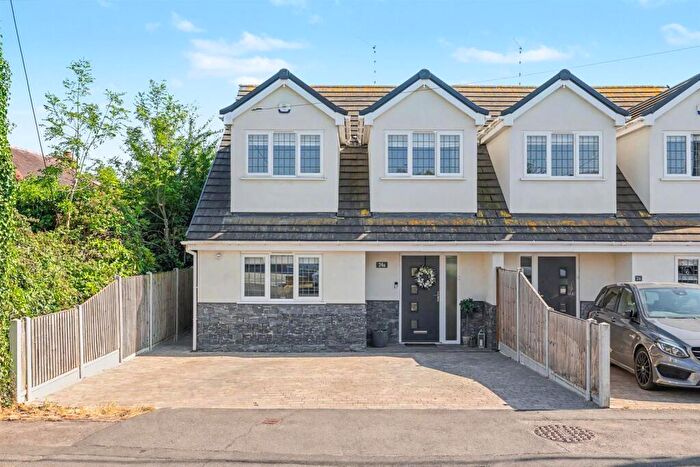
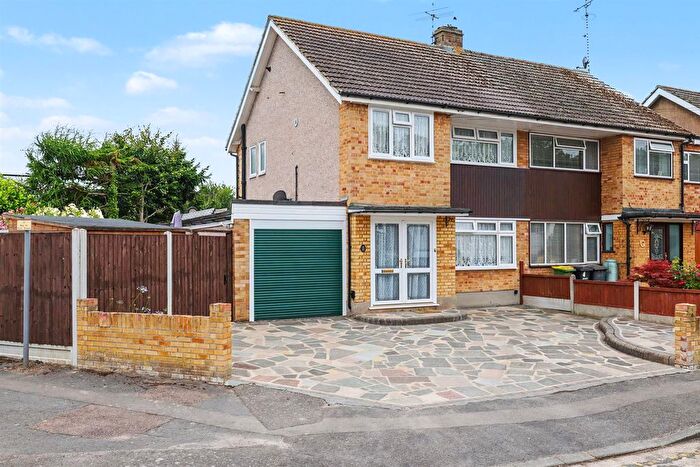
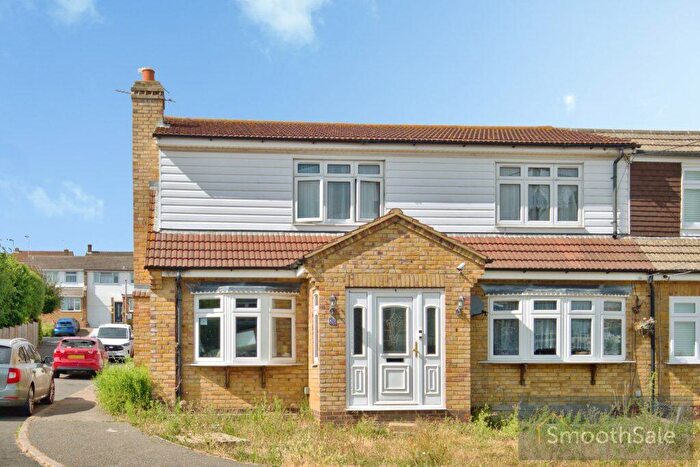
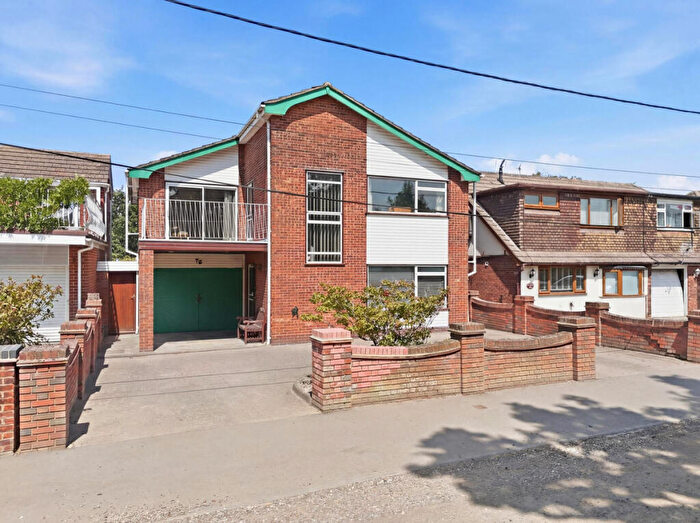
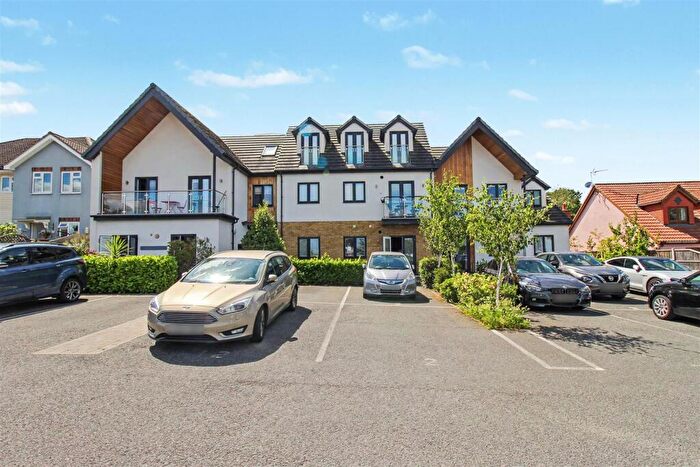
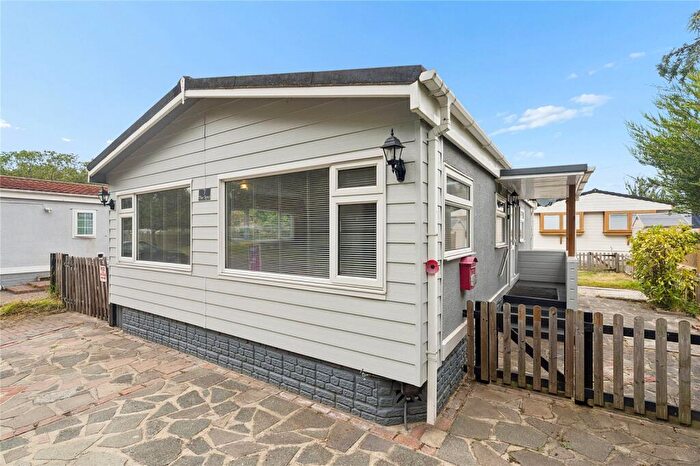
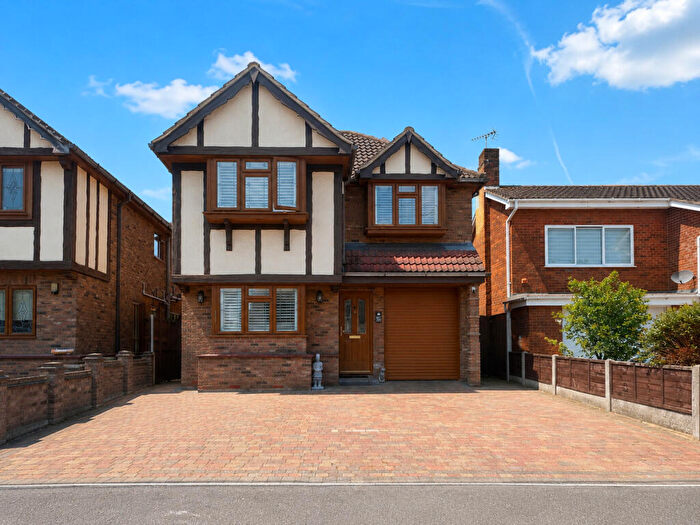
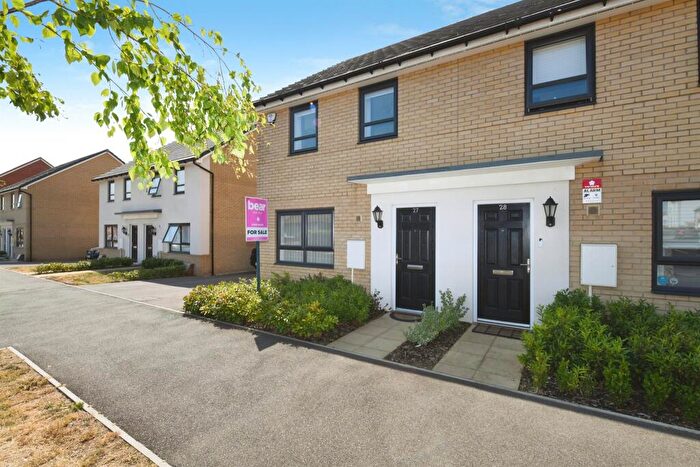
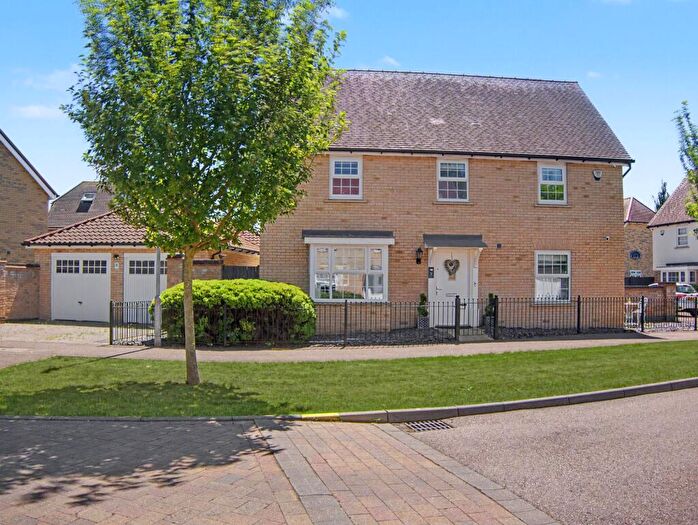
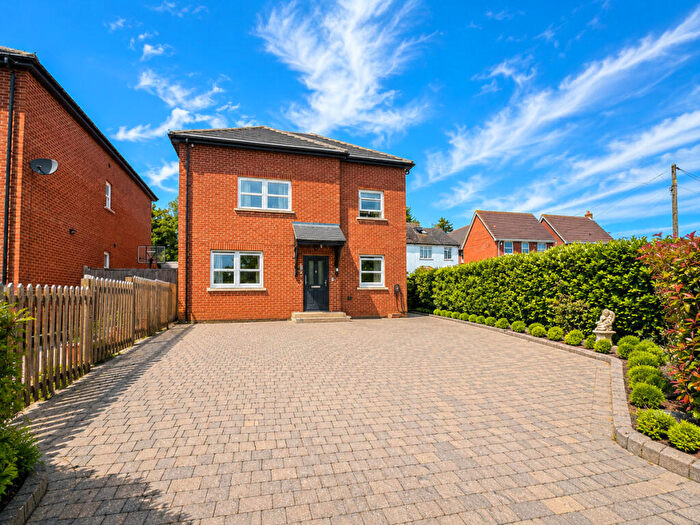
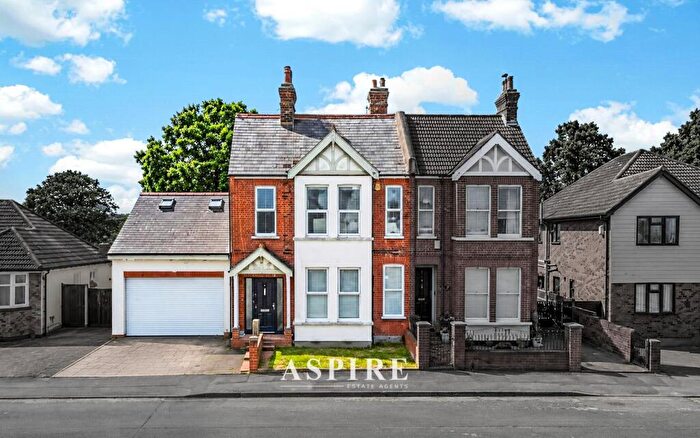
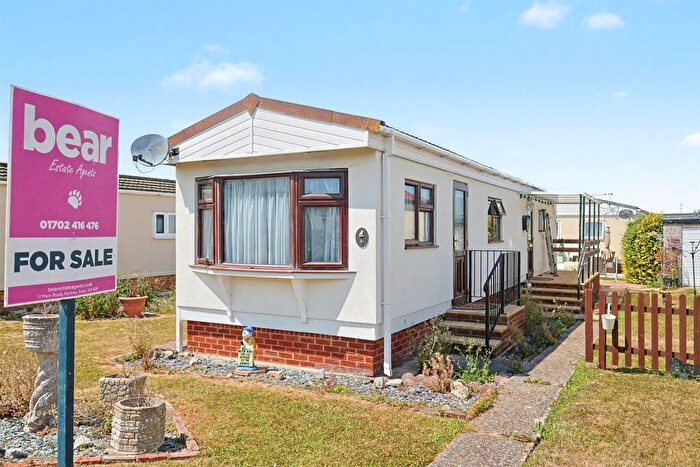
Houses and Flats for sale in SS5, Hockley
There are 103 results. Property prices in SS5 range from £95k to £2.75M with an average price of £497k.
![]()
If you are looking to sell your house, let it out, or receive a property valuation, an expert can help you.
Click the button below to get started.

Frequently Asked Questions about SS5
What is the average price for a property for sale in SS5?
The average price for a property for sale in SS5 is £447,411. There are 103 property listings for sale in SS5.
Which areas are included in the SS5 postcode district?
The main area within SS5 is Hockley.
What are the most common property types in SS5?
The most common property types in SS5 are Semi Detached Houses, Detached Houses, Flats and Terraced Houses.
What has been the average sold property price in SS5 over the last three years?
Semi Detached Houses in SS5 have an average sold price of £399,073, while Detached Houses have an average of £587,339. Flats have an average of £236,128 and Terraced Houses have an average of £352,987. The average sold property price in SS5 over the last three years is approximately £447,200.
Which train stations are available in SS5?
The train station available in SS5 is Hockley Station..