
Properties for sale in SY11
Oswestry
- Info
- Price Paid By Year
- Property Type Price
- Transport
House Prices in SY11
Properties in SY11 have an average house price of £241,205.00 and had 1070 Property Transactions within the last 3 years.
The most expensive property was sold for £1,038,000.00.
Property Price Paid in SY11 by Year
The average sold property price by year was:
| Year | Average Sold Price | Sold Properties |
|---|---|---|
| 2025 | £250,631.00 | 332 Properties |
| 2024 | £241,762.00 | 396 Properties |
| 2023 | £231,409.00 | 342 Properties |
| 2022 | £232,177.00 | 412 Properties |
| 2021 | £223,990.00 | 555 Properties |
| 2020 | £204,809.00 | 440 Properties |
| 2019 | £183,589.00 | 461 Properties |
| 2018 | £178,443.00 | 412 Properties |
| 2017 | £183,019.00 | 463 Properties |
| 2016 | £170,827.00 | 458 Properties |
| 2015 | £165,973.00 | 490 Properties |
| 2014 | £160,236.00 | 411 Properties |
| 2013 | £159,961.00 | 365 Properties |
| 2012 | £151,872.00 | 287 Properties |
| 2011 | £164,204.00 | 265 Properties |
| 2010 | £161,486.00 | 299 Properties |
| 2009 | £155,023.00 | 327 Properties |
| 2008 | £165,835.00 | 278 Properties |
| 2007 | £174,336.00 | 648 Properties |
| 2006 | £163,188.00 | 694 Properties |
| 2005 | £150,009.00 | 491 Properties |
| 2004 | £139,683.00 | 552 Properties |
| 2003 | £118,826.00 | 657 Properties |
| 2002 | £91,608.00 | 679 Properties |
| 2001 | £74,955.00 | 659 Properties |
| 2000 | £66,064.00 | 594 Properties |
| 1999 | £58,085.00 | 579 Properties |
| 1998 | £53,514.00 | 494 Properties |
| 1997 | £52,111.00 | 559 Properties |
| 1996 | £51,918.00 | 523 Properties |
| 1995 | £49,670.00 | 447 Properties |
Property Price per Property Type in SY11
Here you can find historic sold price data in order to help with your property search.
The average Property Paid Price for specific property types in the last three years are:
| Property Type | Average Sold Price | Sold Properties |
|---|---|---|
| Semi Detached House | £206,270.00 | 343 Semi Detached Houses |
| Detached House | £343,555.00 | 380 Detached Houses |
| Terraced House | £170,621.00 | 293 Terraced Houses |
| Flat | £125,854.00 | 54 Flats |
Transport near SY11

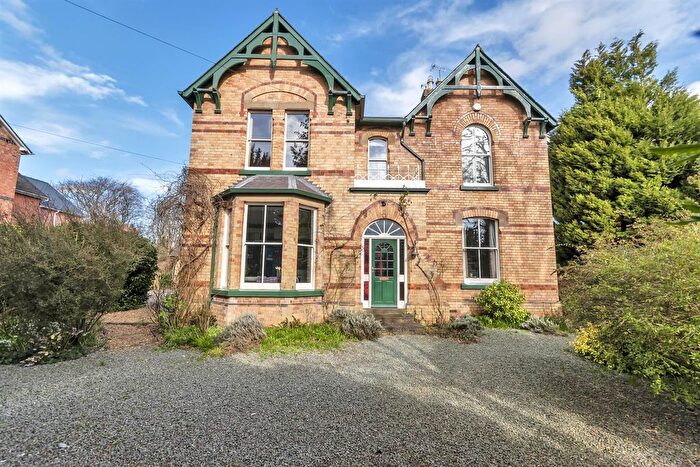
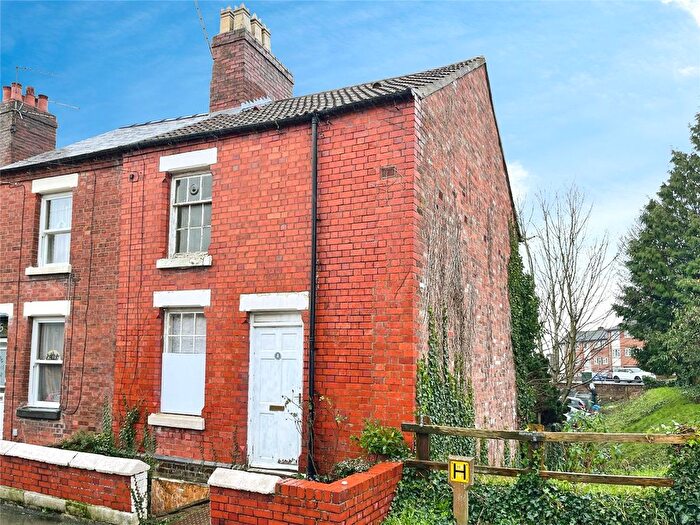
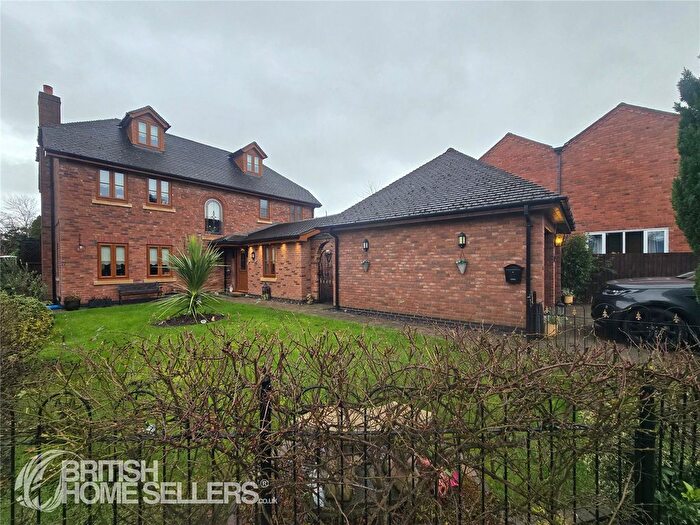
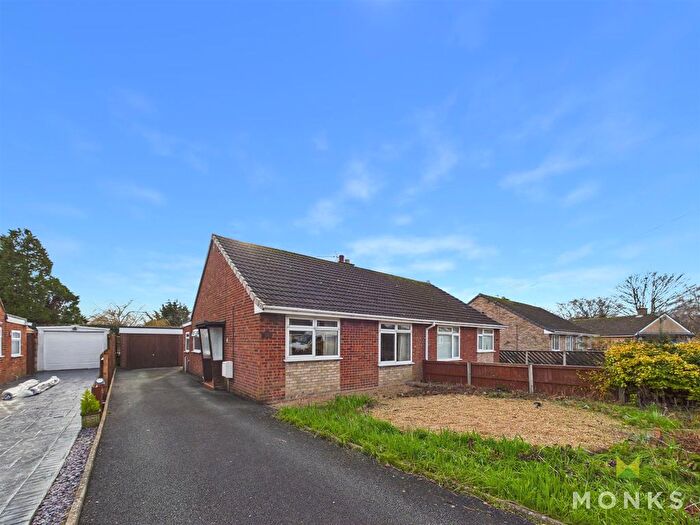
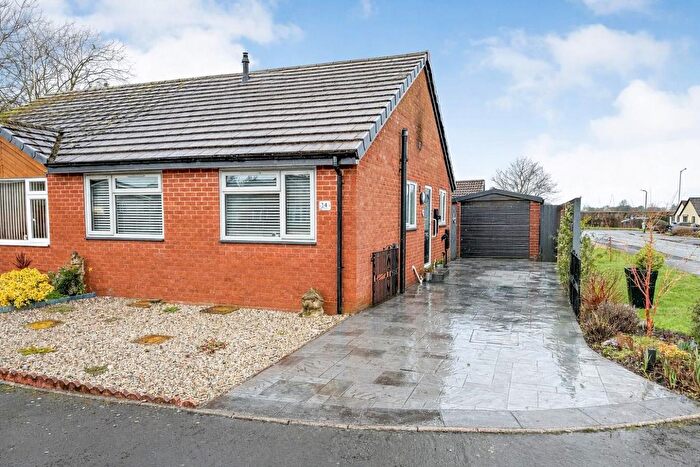
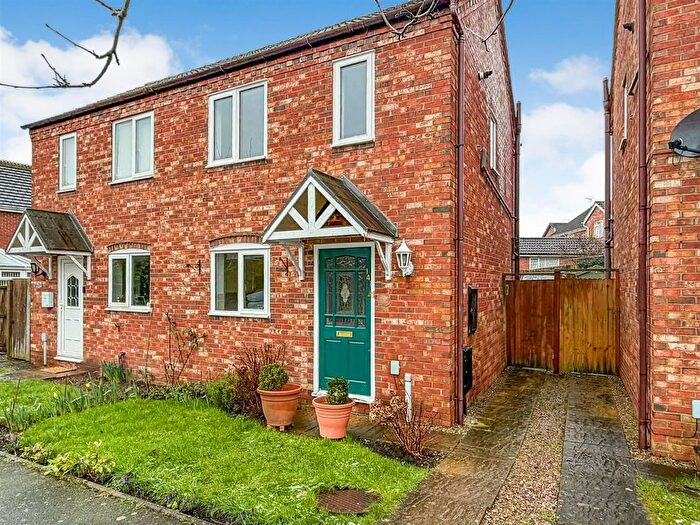
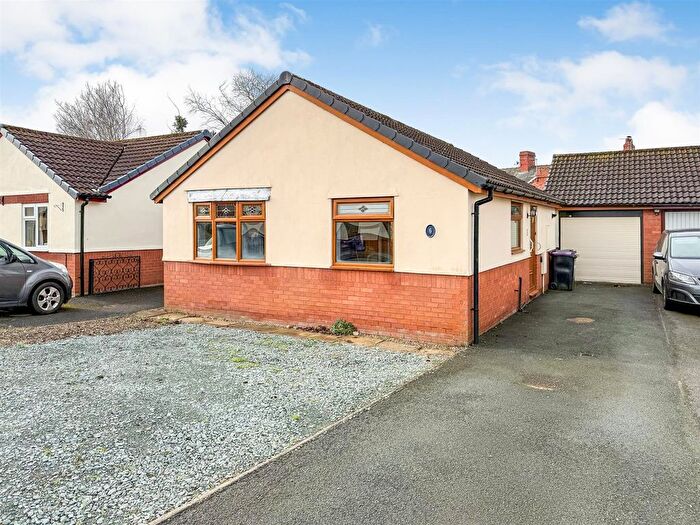
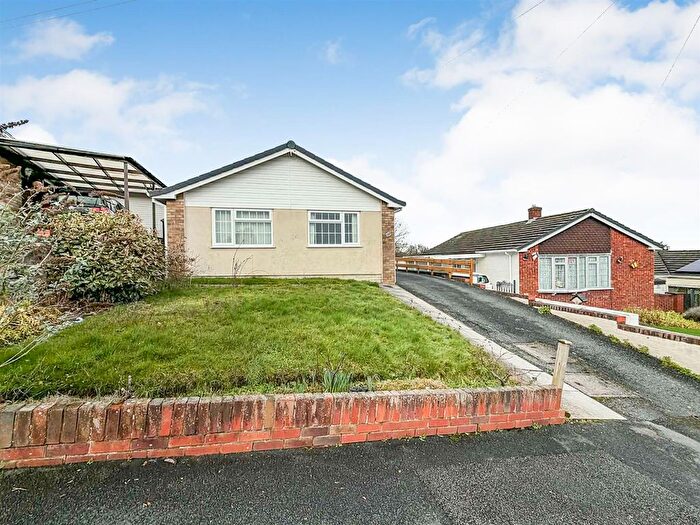
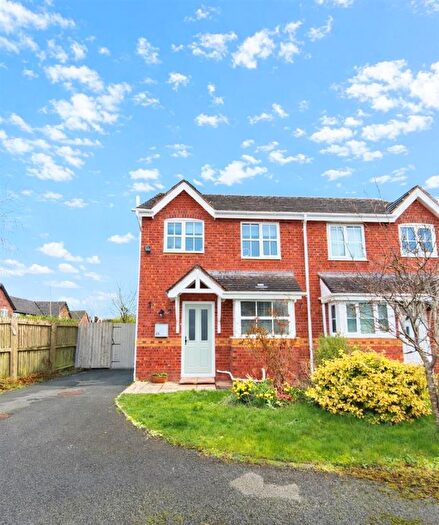
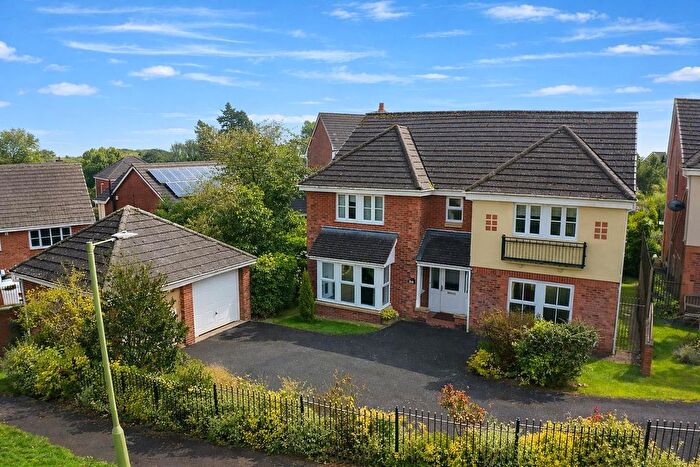
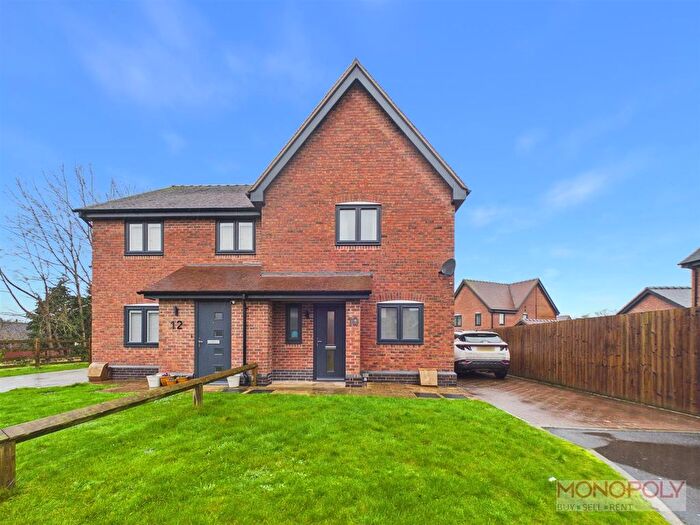
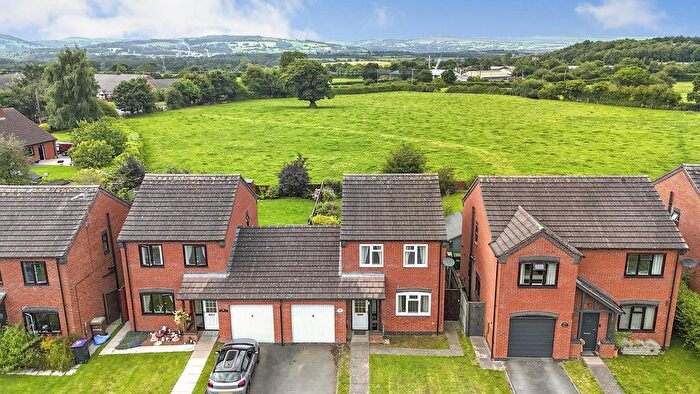
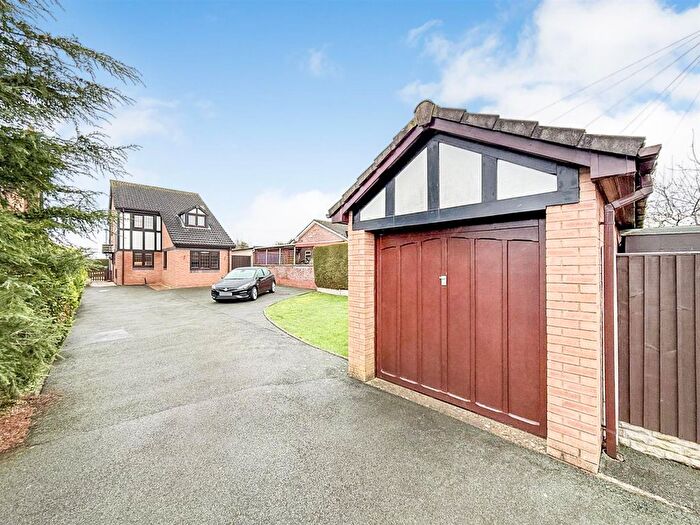
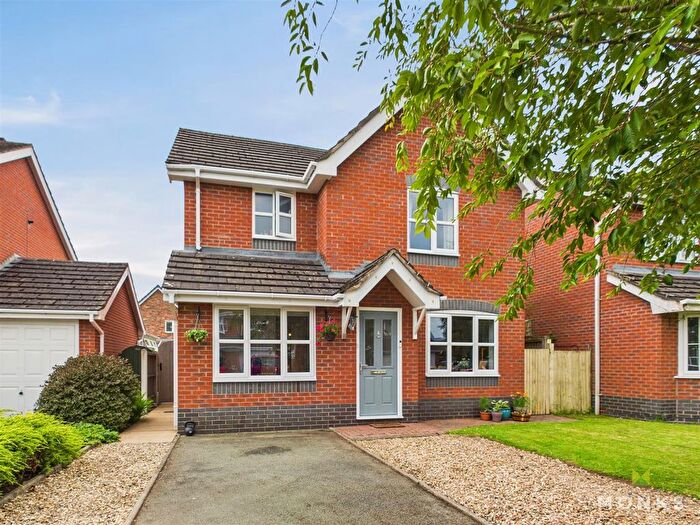
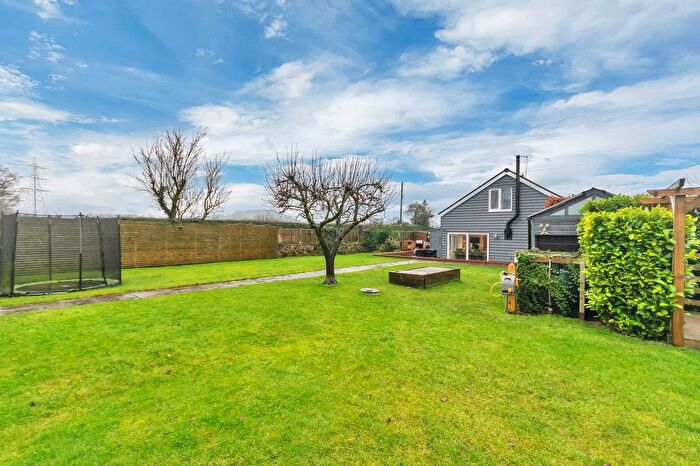
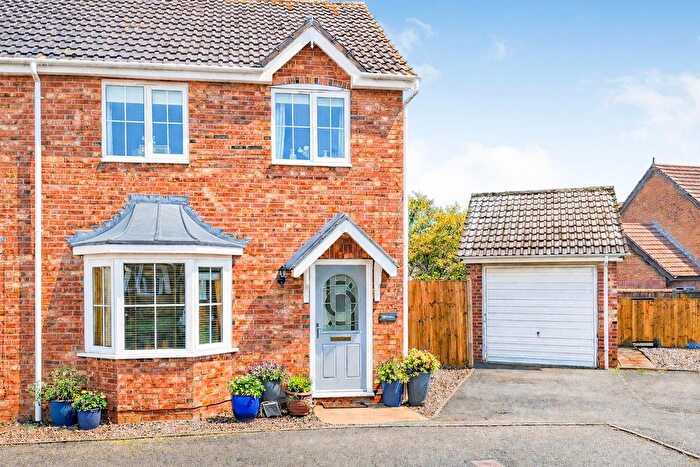
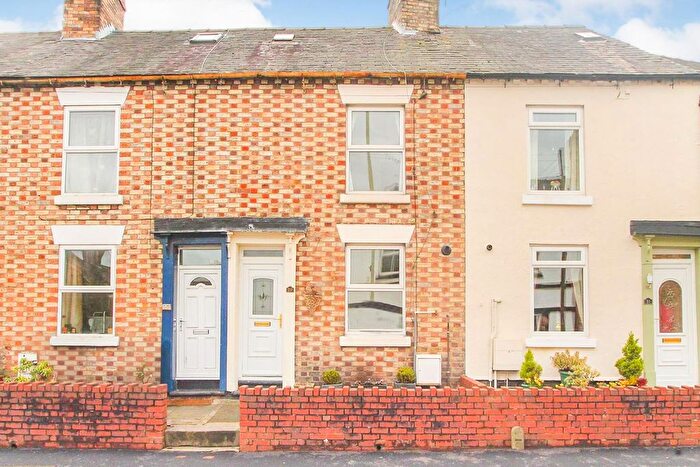
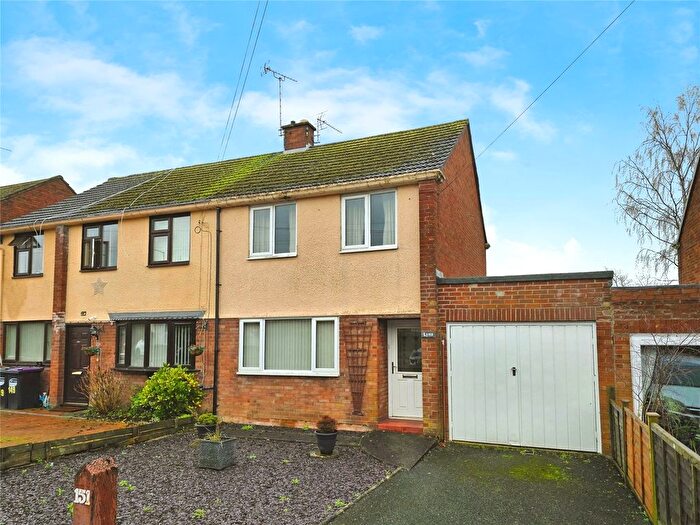
Houses and Flats for sale in SY11, Oswestry
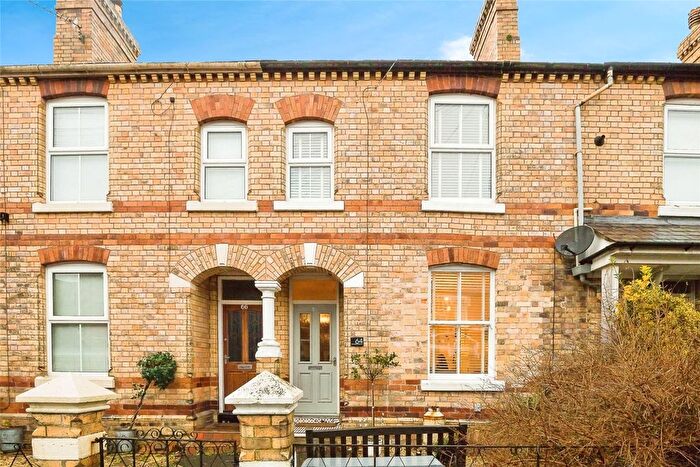
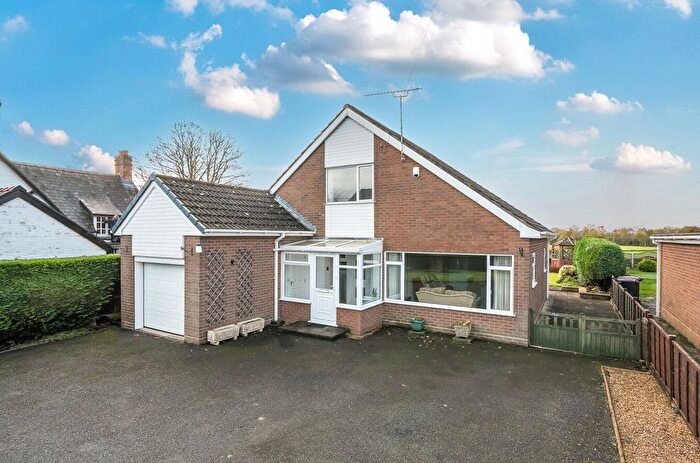
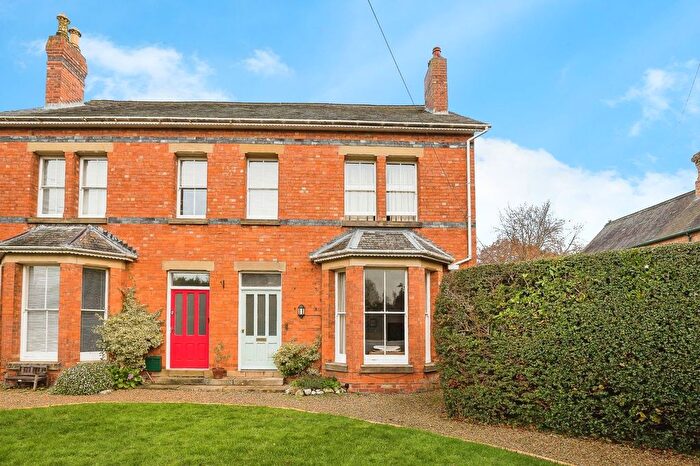
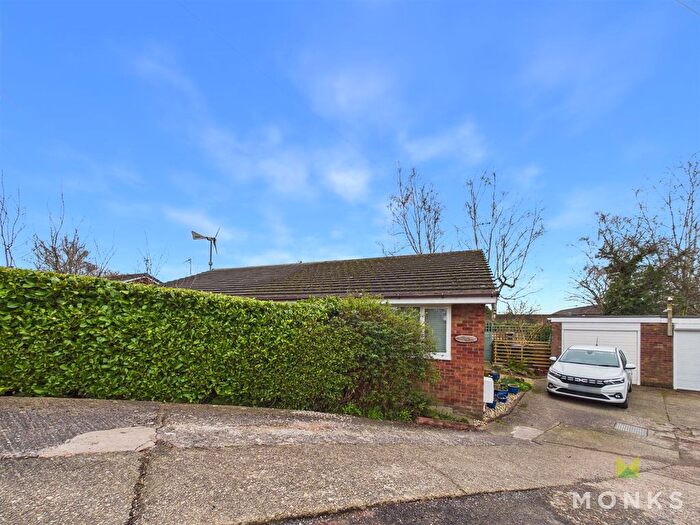
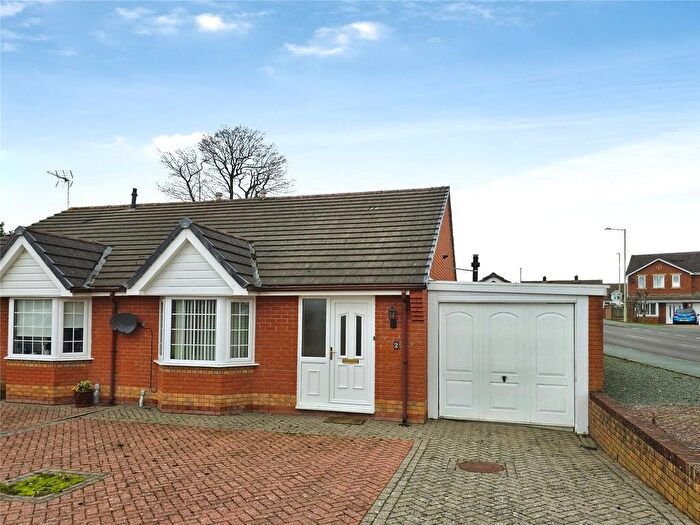
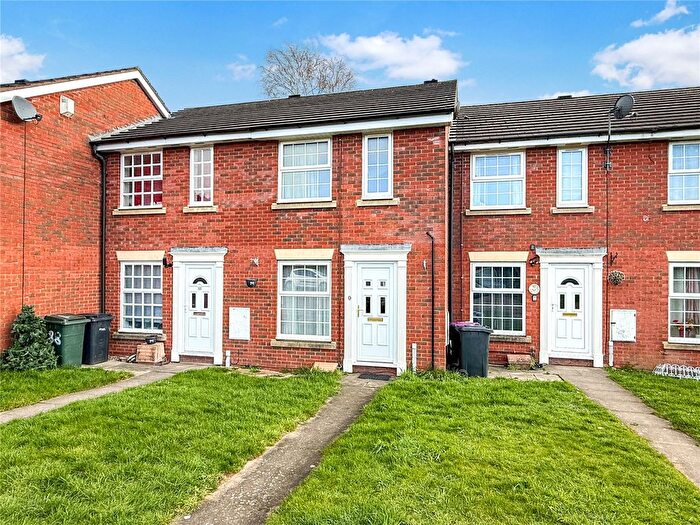
![]()
If you are looking to sell your house, let it out, or receive a property valuation, an expert can help you.
Click the button below to get started.
Frequently Asked Questions about SY11
What is the average price for a property for sale in SY11?
The average price for a property for sale in SY11 is £241,205. There are 60 property listings for sale in SY11.
Which areas are included in the SY11 postcode district?
The main area within SY11 is Oswestry.
What are the most common property types in SY11?
The most common property types in SY11 are Detached Houses, Semi Detached Houses, Terraced Houses and Flats.
What has been the average sold property price in SY11 over the last three years?
Detached Houses in SY11 have an average sold price of £343,555, while Semi Detached Houses have an average of £206,270. Terraced Houses have an average of £170,621 and Flats have an average of £125,854. The average sold property price in SY11 over the last three years is approximately £241,267.
Which train stations are available in SY11?
The train station available in SY11 is Gobowen Station..