
Properties for sale in SY13
Whitchurch
- Info
- Price Paid By Year
- Property Type Price
- Transport
House Prices in SY13
Properties in SY13 have an average house price of £287,017.00 and had 771 Property Transactions within the last 3 years.
The most expensive property was sold for £2,886,000.00.
Property Price Paid in SY13 by Year
The average sold property price by year was:
| Year | Average Sold Price | Sold Properties |
|---|---|---|
| 2026 | £223,666.00 | 3 Properties |
| 2025 | £283,791.00 | 242 Properties |
| 2024 | £276,658.00 | 278 Properties |
| 2023 | £302,544.00 | 248 Properties |
| 2022 | £304,574.00 | 275 Properties |
| 2021 | £294,417.00 | 376 Properties |
| 2020 | £249,019.00 | 294 Properties |
| 2019 | £235,958.00 | 334 Properties |
| 2018 | £244,133.00 | 388 Properties |
| 2017 | £218,199.00 | 384 Properties |
| 2016 | £216,458.00 | 373 Properties |
| 2015 | £214,398.00 | 323 Properties |
| 2014 | £188,268.00 | 289 Properties |
| 2013 | £204,637.00 | 233 Properties |
| 2012 | £188,105.00 | 212 Properties |
| 2011 | £188,448.00 | 166 Properties |
| 2010 | £214,544.00 | 203 Properties |
| 2009 | £188,780.00 | 150 Properties |
| 2008 | £190,690.00 | 182 Properties |
| 2007 | £210,181.00 | 285 Properties |
| 2006 | £191,159.00 | 391 Properties |
| 2005 | £177,477.00 | 358 Properties |
| 2004 | £188,188.00 | 407 Properties |
| 2003 | £148,246.00 | 377 Properties |
| 2002 | £120,388.00 | 427 Properties |
| 2001 | £101,288.00 | 344 Properties |
| 2000 | £95,360.00 | 305 Properties |
| 1999 | £84,530.00 | 380 Properties |
| 1998 | £74,252.00 | 331 Properties |
| 1997 | £70,701.00 | 334 Properties |
| 1996 | £64,495.00 | 291 Properties |
| 1995 | £62,314.00 | 246 Properties |
Property Price per Property Type in SY13
Here you can find historic sold price data in order to help with your property search.
The average Property Paid Price for specific property types in the last three years are:
| Property Type | Average Sold Price | Sold Properties |
|---|---|---|
| Semi Detached House | £247,218.00 | 219 Semi Detached Houses |
| Terraced House | £194,335.00 | 185 Terraced Houses |
| Detached House | £391,751.00 | 322 Detached Houses |
| Flat | £112,304.00 | 45 Flats |
Transport near SY13

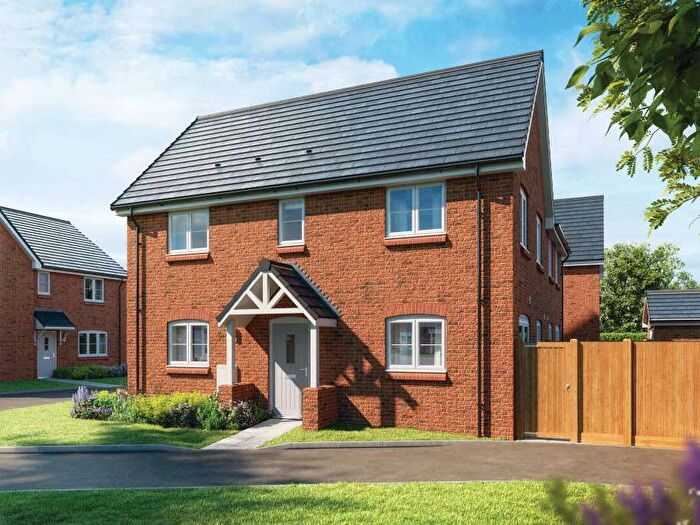
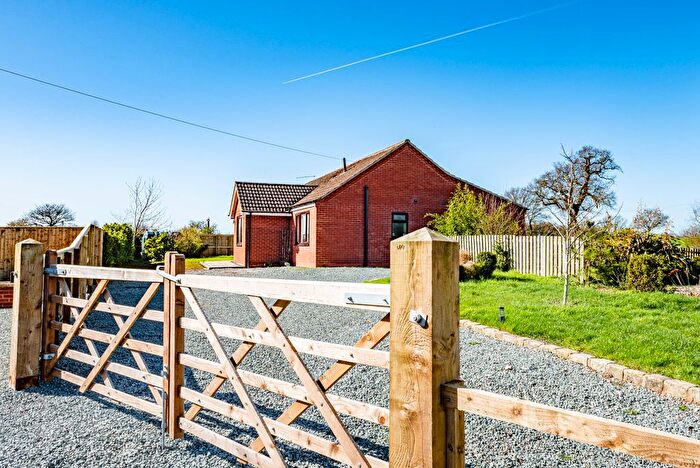
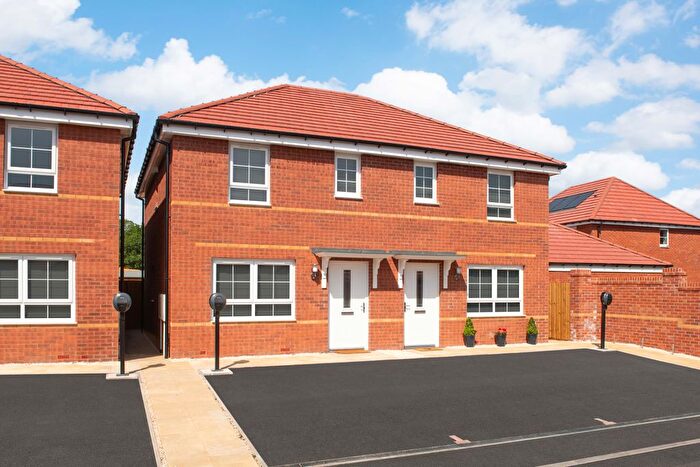
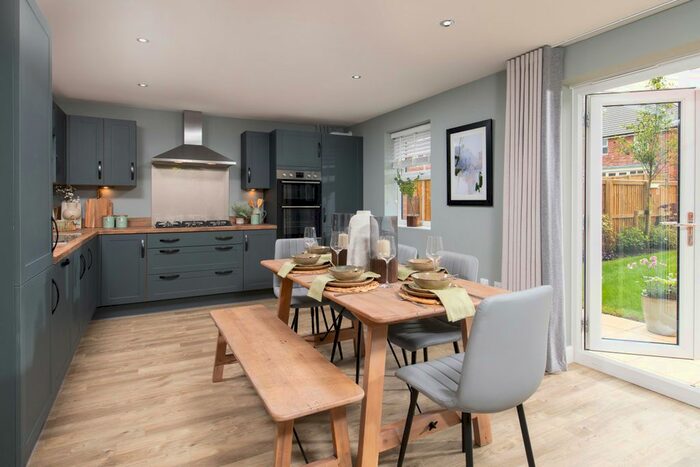
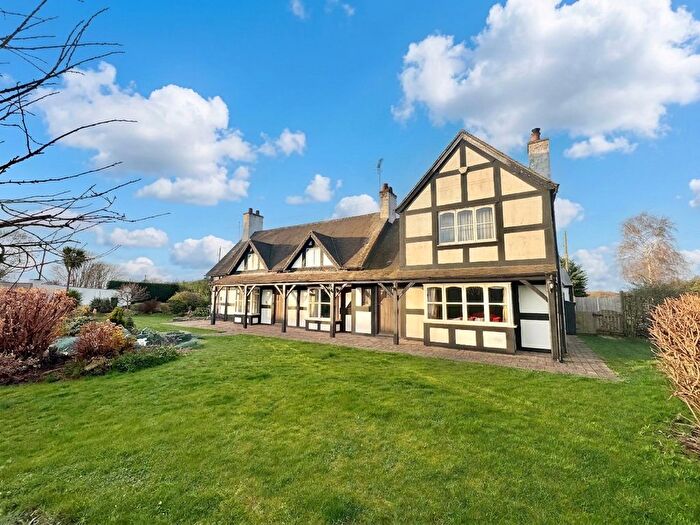
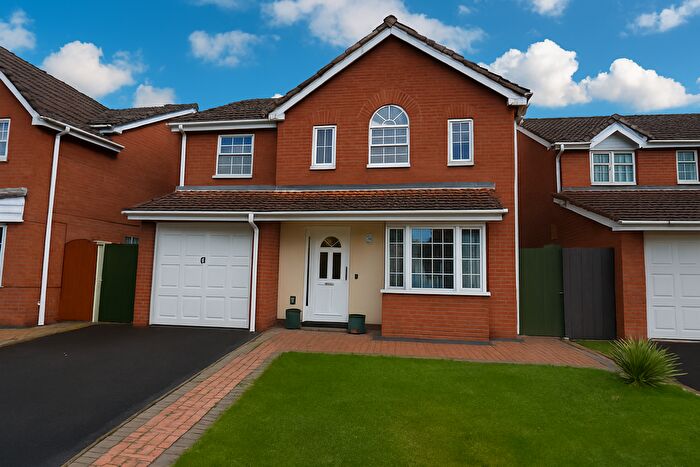
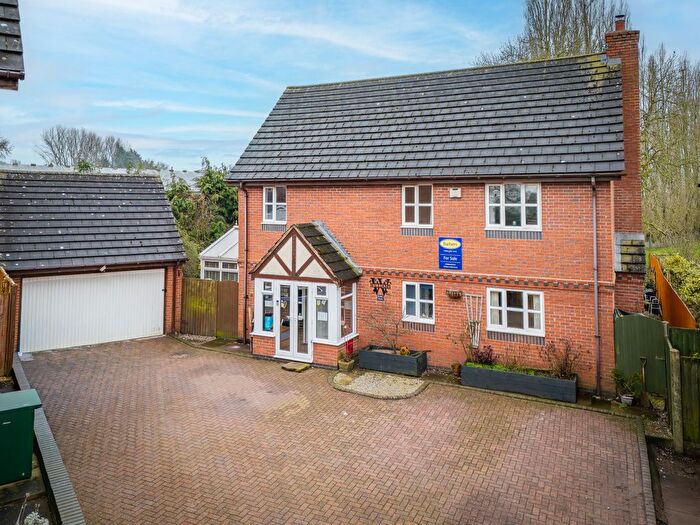
Houses and Flats for sale in SY13, Whitchurch
![]()
If you are looking to sell your house, let it out, or receive a property valuation, an expert can help you.
Click the button below to get started.
Frequently Asked Questions about SY13
What is the average price for a property for sale in SY13?
The average price for a property for sale in SY13 is £287,017. There are 84 property listings for sale in SY13.
Which areas are included in the SY13 postcode district?
The main area within SY13 is Whitchurch.
What are the most common property types in SY13?
The most common property types in SY13 are Detached Houses, Semi Detached Houses, Terraced Houses and Flats.
What has been the average sold property price in SY13 over the last three years?
Detached Houses in SY13 have an average sold price of £391,751, while Semi Detached Houses have an average of £247,218. Terraced Houses have an average of £194,335 and Flats have an average of £112,304. The average sold property price in SY13 over the last three years is approximately £261,372.
Which train stations are available in SY13?
The train stations available in SY13 are Prees Station and Whitchurch (Salop) Station..