
Properties for sale in UB1
Southall
- Info
- Price Paid By Year
- Property Type Price
- Transport
House Prices in UB1
Properties in UB1 have an average house price of £453,454.00 and had 453 Property Transactions within the last 3 years.
The most expensive property was sold for £1,500,000.00.
Property Price Paid in UB1 by Year
The average sold property price by year was:
| Year | Average Sold Price | Sold Properties |
|---|---|---|
| 2026 | £702,500.00 | 2 Properties |
| 2025 | £455,167.00 | 153 Properties |
| 2024 | £448,335.00 | 158 Properties |
| 2023 | £453,802.00 | 140 Properties |
| 2022 | £433,257.00 | 150 Properties |
| 2021 | £397,698.00 | 193 Properties |
| 2020 | £398,501.00 | 167 Properties |
| 2019 | £376,631.00 | 134 Properties |
| 2018 | £276,869.00 | 257 Properties |
| 2017 | £365,988.00 | 155 Properties |
| 2016 | £333,117.00 | 201 Properties |
| 2015 | £294,307.00 | 174 Properties |
| 2014 | £262,409.00 | 161 Properties |
| 2013 | £232,888.00 | 127 Properties |
| 2012 | £231,810.00 | 132 Properties |
| 2011 | £229,688.00 | 150 Properties |
| 2010 | £218,608.00 | 150 Properties |
| 2009 | £218,347.00 | 123 Properties |
| 2008 | £242,824.00 | 164 Properties |
| 2007 | £231,068.00 | 392 Properties |
| 2006 | £206,205.00 | 339 Properties |
| 2005 | £205,131.00 | 313 Properties |
| 2004 | £200,910.00 | 376 Properties |
| 2003 | £186,871.00 | 439 Properties |
| 2002 | £153,854.00 | 407 Properties |
| 2001 | £127,902.00 | 410 Properties |
| 2000 | £107,913.00 | 361 Properties |
| 1999 | £92,764.00 | 323 Properties |
| 1998 | £79,121.00 | 367 Properties |
| 1997 | £67,247.00 | 359 Properties |
| 1996 | £60,843.00 | 312 Properties |
| 1995 | £58,196.00 | 274 Properties |
Property Price per Property Type in UB1
Here you can find historic sold price data in order to help with your property search.
The average Property Paid Price for specific property types in the last three years are:
| Property Type | Average Sold Price | Sold Properties |
|---|---|---|
| Semi Detached House | £534,183.00 | 79 Semi Detached Houses |
| Detached House | £656,200.00 | 5 Detached Houses |
| Terraced House | £495,074.00 | 277 Terraced Houses |
| Flat | £247,801.00 | 92 Flats |


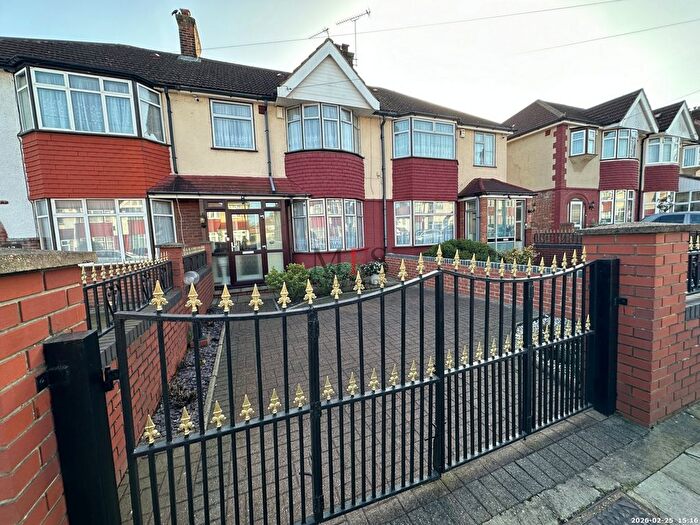
Houses and Flats for sale in UB1, Southall
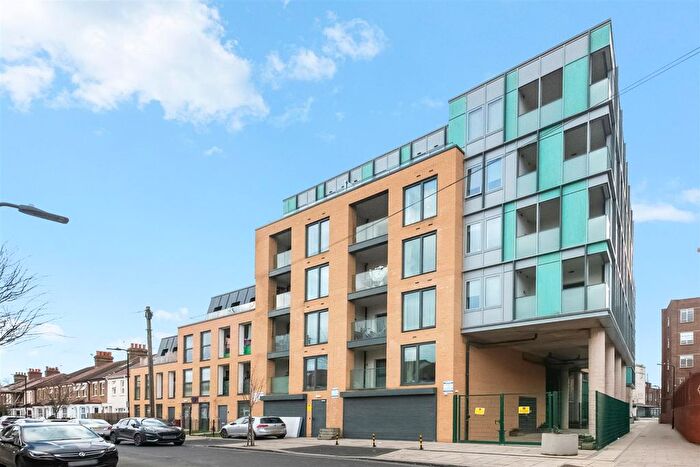
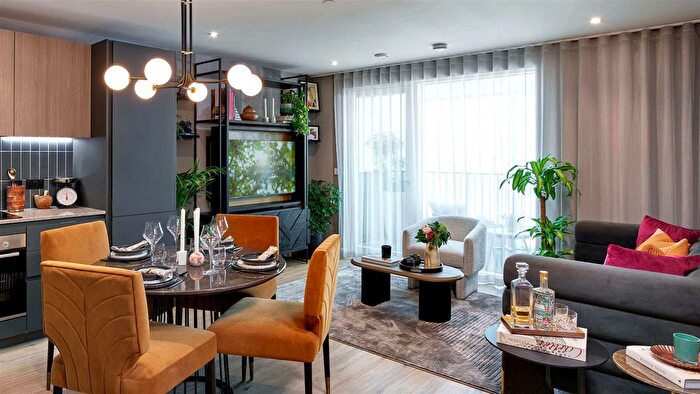
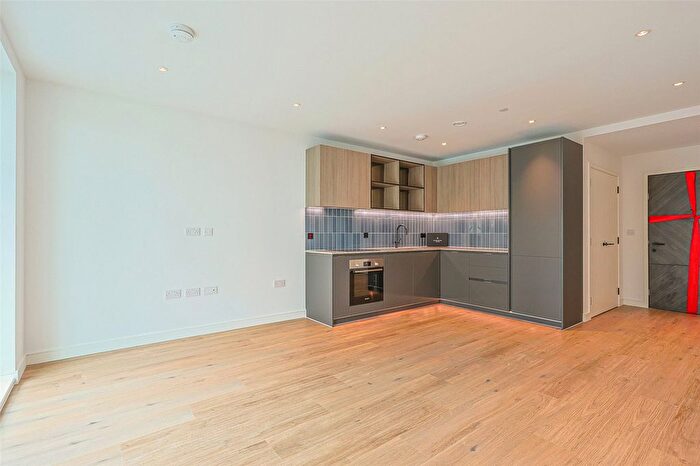
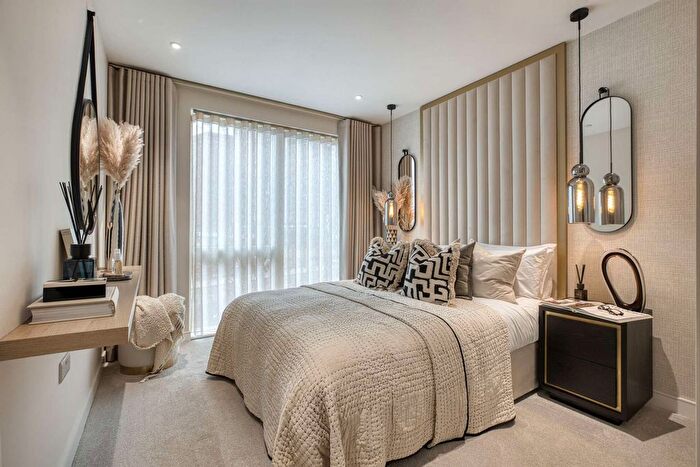

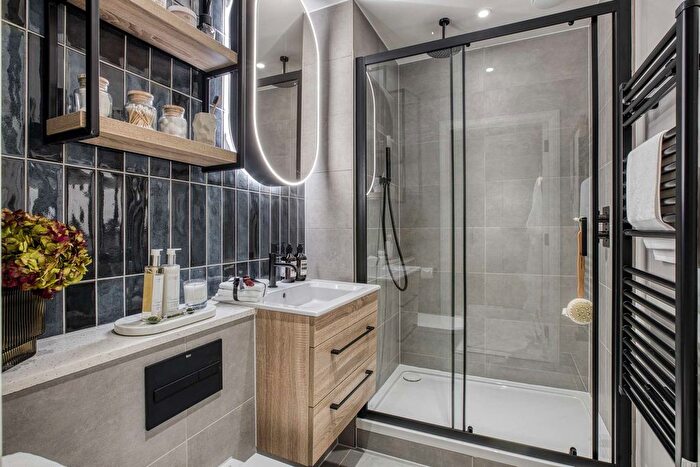
![]()
If you are looking to sell your house, let it out, or receive a property valuation, an expert can help you.
Click the button below to get started.
Frequently Asked Questions about UB1
What is the average price for a property for sale in UB1?
The average price for a property for sale in UB1 is £453,454. There are 79 property listings for sale in UB1.
Which areas are included in the UB1 postcode district?
The main area within UB1 is Southall.
What are the most common property types in UB1?
The most common property types in UB1 are Terraced Houses, Flats, Semi Detached Houses and Detached Houses.
What has been the average sold property price in UB1 over the last three years?
Terraced Houses in UB1 have an average sold price of £495,074, while Flats have an average of £247,801. Semi Detached Houses have an average of £534,183 and Detached Houses have an average of £656,200. The average sold property price in UB1 over the last three years is approximately £535,334.
Which tube stations are available in UB1?
The tube stations available in UB1 are Ickenham Station and Hillingdon Station.