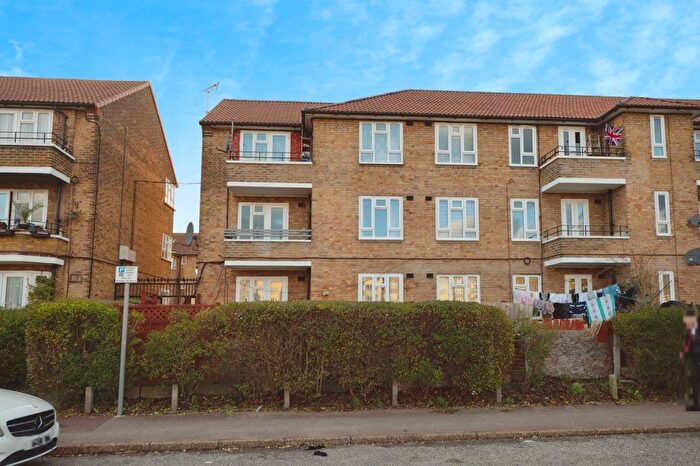
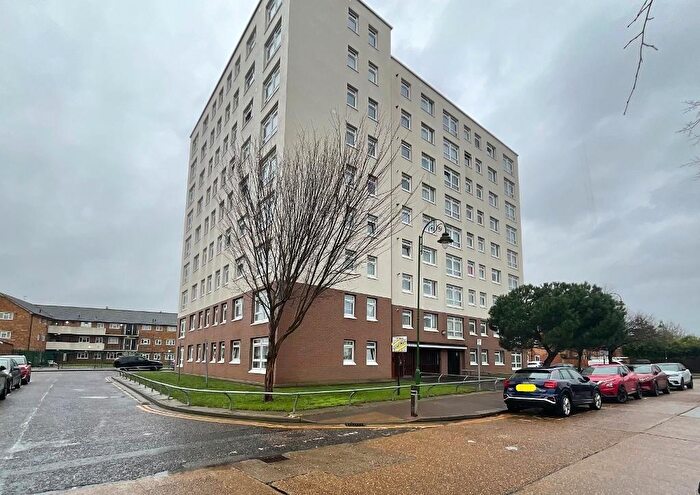
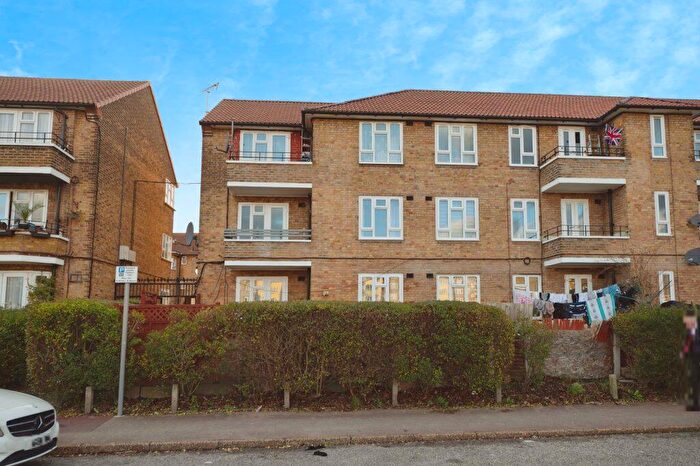
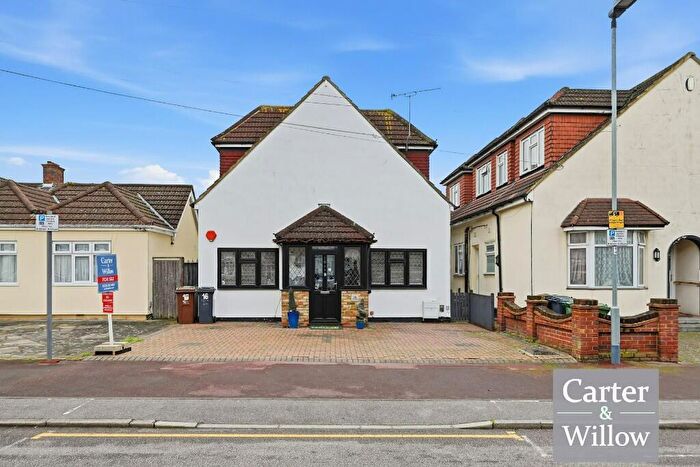
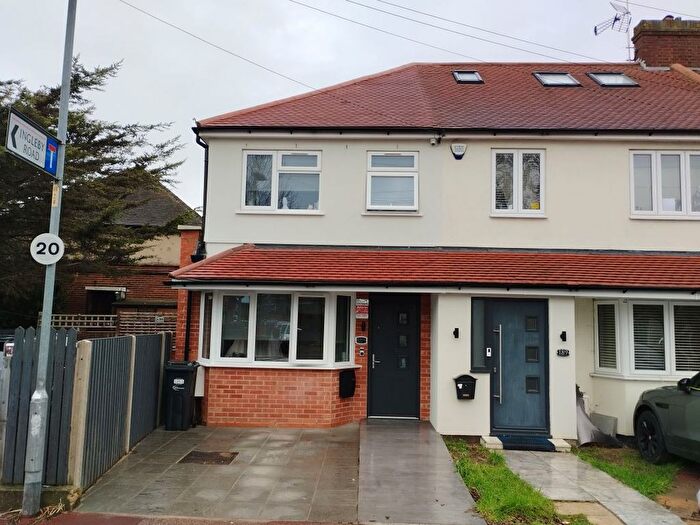
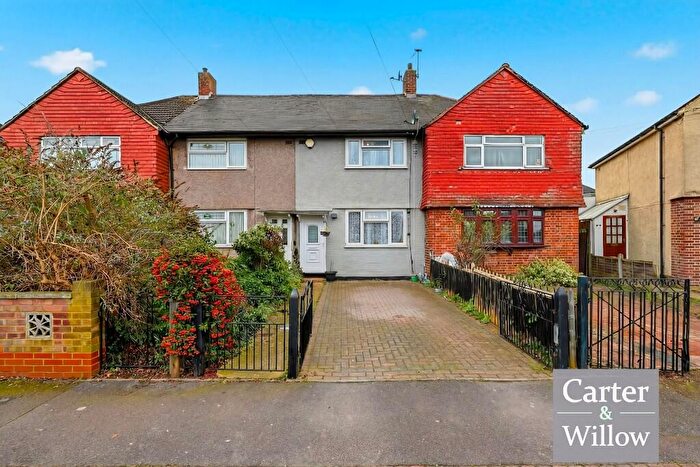
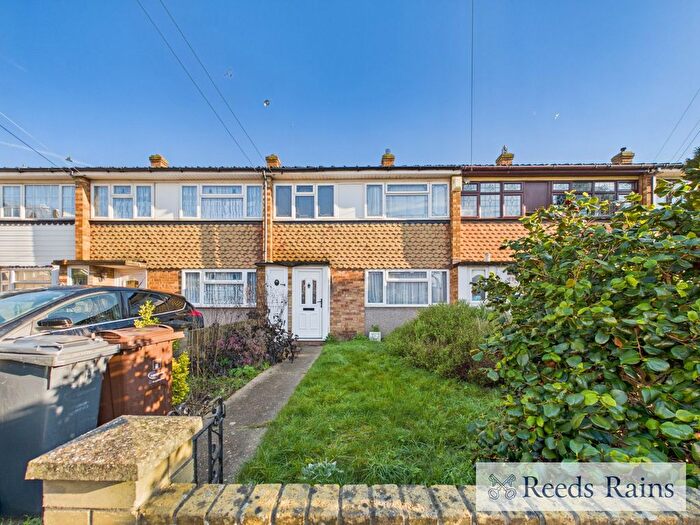
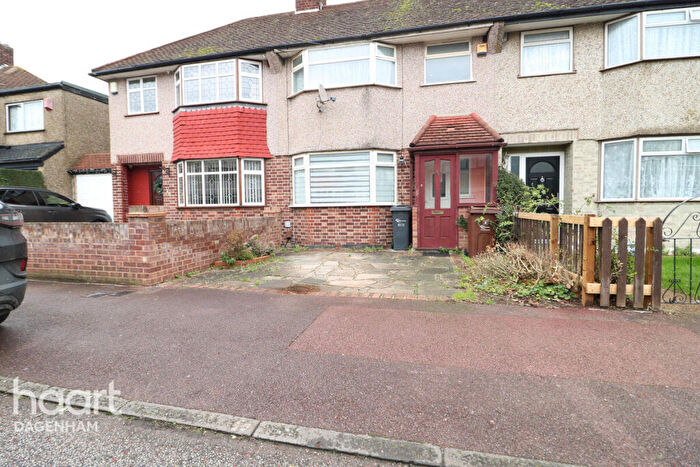
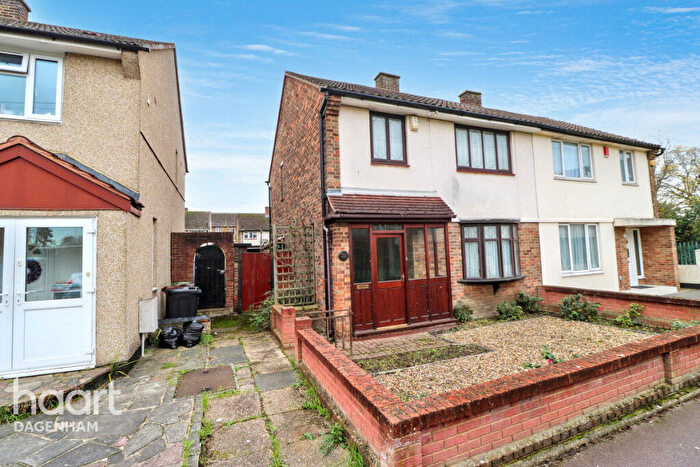
Houses for sale & to rent in Eastbrook, Dagenham
House Prices in Eastbrook
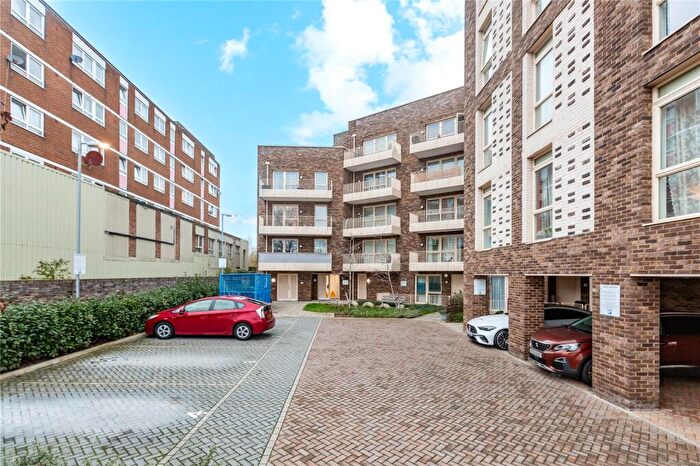
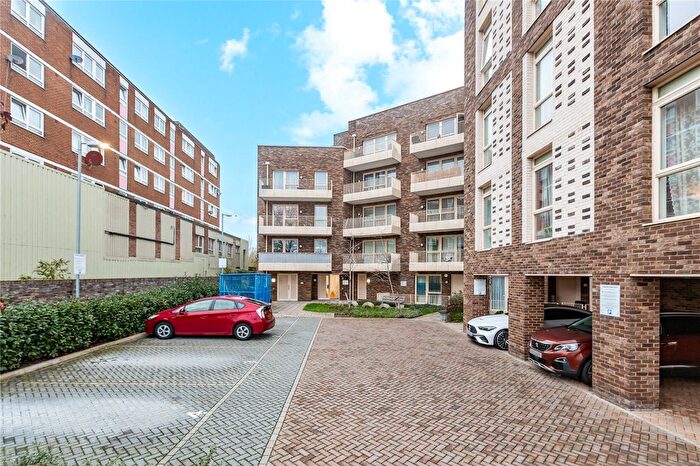
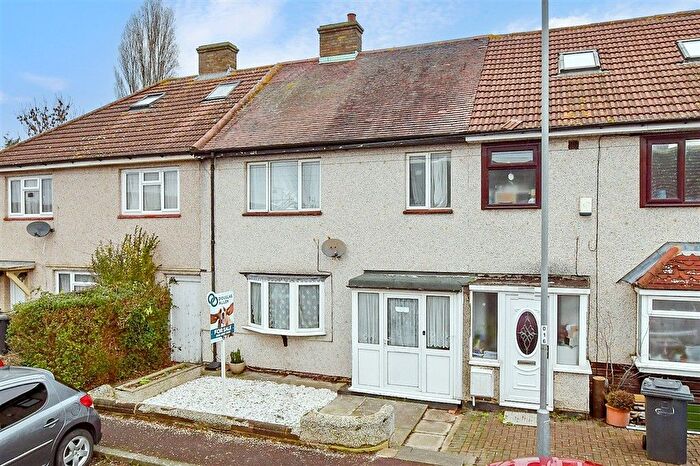
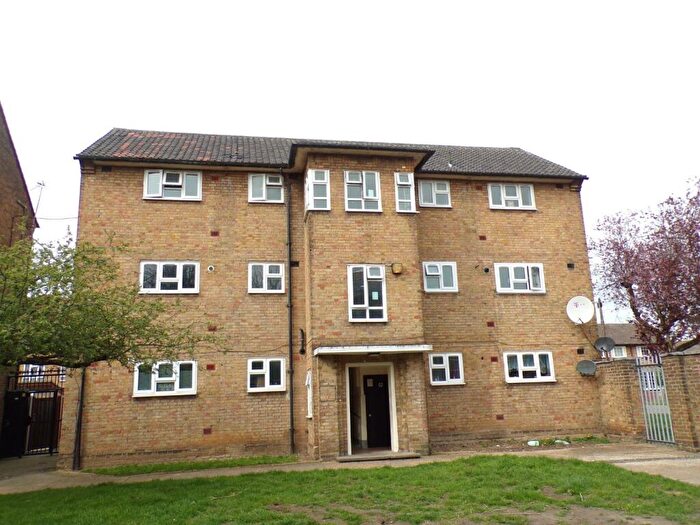
Properties in this part of Eastbrook within Dagenham have an average house price of £382,983.00 and had 122 Property Transactions within the last 3 years¹. This area has 1,958 households² , where the most expensive property was sold for £620,000.00.
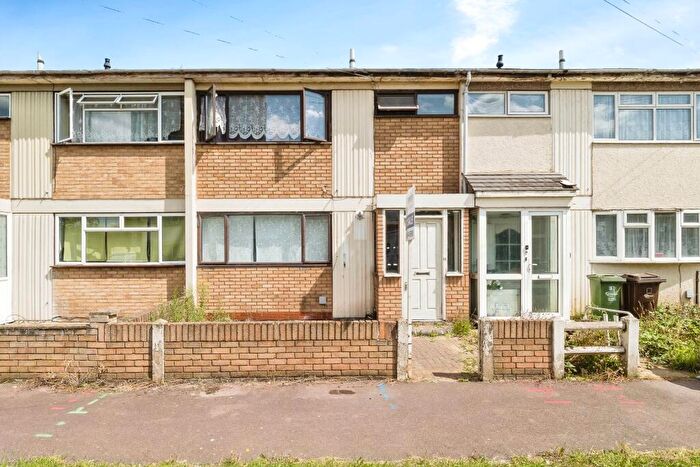
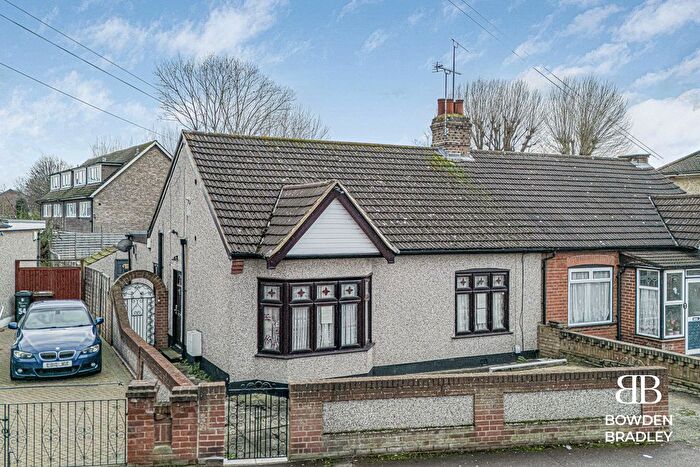
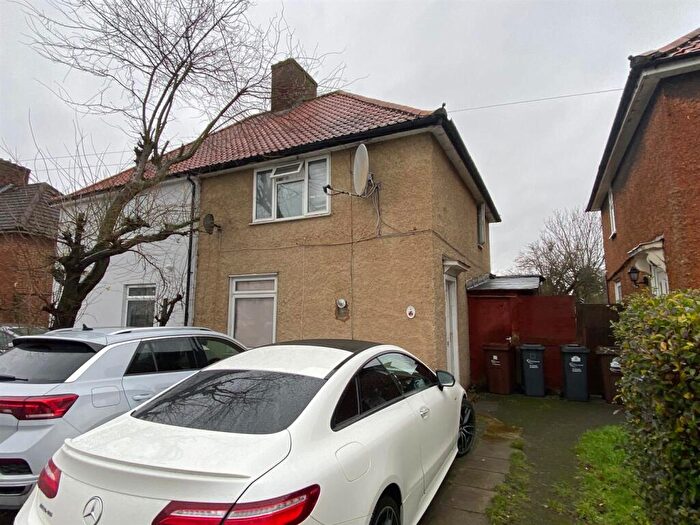
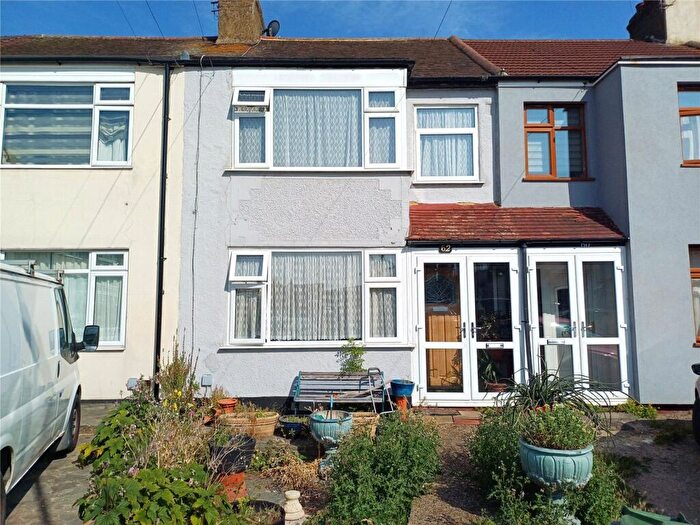
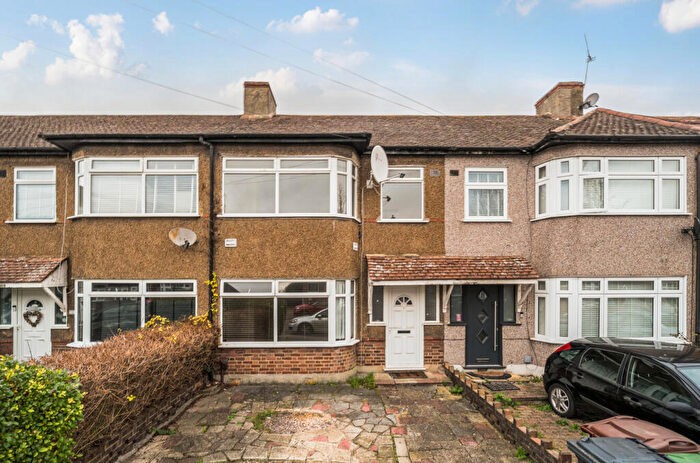
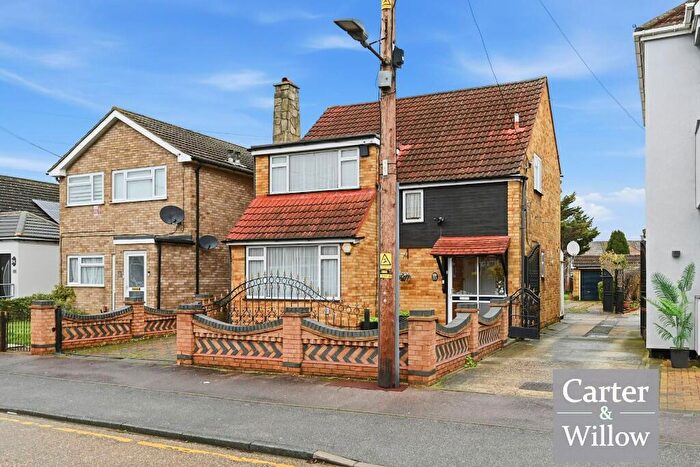
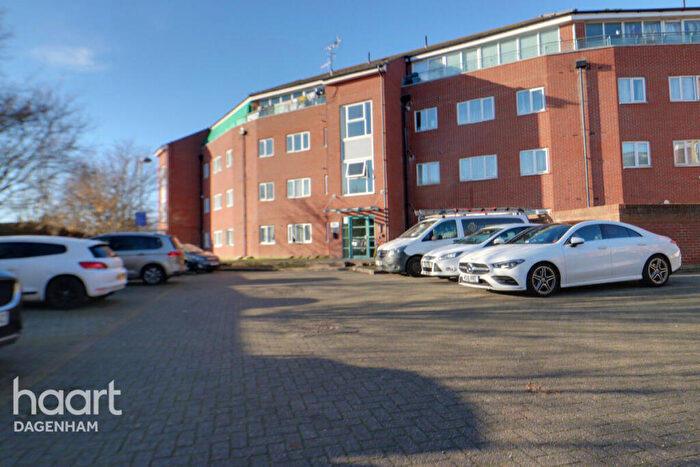
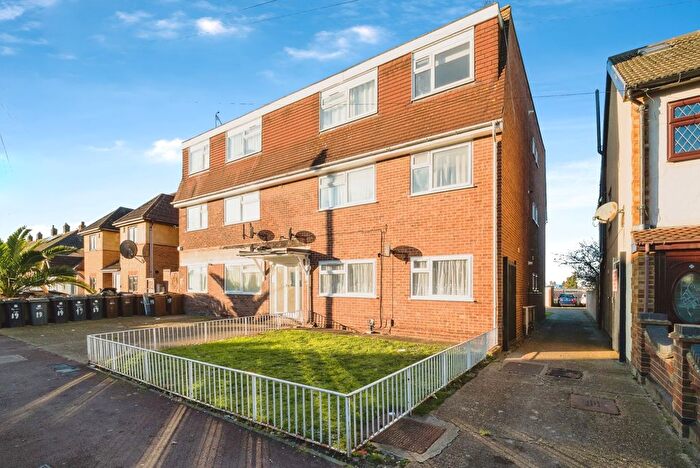
Properties for sale in Eastbrook
Roads and Postcodes in Eastbrook
Navigate through our locations to find the location of your next house in Eastbrook, Dagenham for sale or to rent.
| Streets | Postcodes |
|---|---|
| Bell Farm Avenue | RM10 7AT RM10 7AU RM10 7BA RM10 7BB RM10 7AX |
| Birch Gardens | RM10 7BJ |
| Bury Road | RM10 7XR |
| Cambeys Road | RM10 8XX RM10 8YA RM10 8YD |
| Camms Terrace | RM10 8YB |
| Central Park Avenue | RM10 7BU RM10 7BX RM10 7DA |
| Cranmer Gardens | RM10 7TJ |
| Dagenham Road | RM10 7UB RM10 7UD RM10 7UH RM10 7UP RM10 7UJ RM10 7UR |
| Delvers Mead | RM10 7XU |
| Durham Road | RM10 8AN |
| Eastbrook Avenue | RM10 7UL |
| Eastbrook Close | RM10 7UA |
| Ely Gardens | RM10 7BE |
| Essex Road | RM10 8ER |
| Felhurst Crescent | RM10 7XT |
| Fels Farm Avenue | RM10 7AD RM10 7BP |
| Fir Tree Walk | RM10 7AP |
| Foxlands Crescent | RM10 7TB |
| Foxlands Road | RM10 8XU |
| Gay Gardens | RM10 7TD RM10 7TH RM10 7TR RM10 7TT |
| Greenwood Avenue | RM10 7DL |
| Grove Gardens | RM10 7AH |
| Hardie Road | RM10 7BS RM10 7BT |
| Highland Avenue | RM10 7AS |
| Home Gardens | RM10 7AL |
| Hooks Hall Drive | RM10 7BD RM10 7BH RM10 7BL |
| Kent Road | RM10 8HA |
| Luke Allsopp Square | RM10 7FJ |
| Macdonald Avenue | RM10 7DJ |
| Manchester Way | RM10 8PN |
| Norfolk Road | RM10 8EX |
| Oxlow Lane | RM10 8LP |
| Park Drive | RM10 7AA RM10 7AB |
| Rainham Road North | RM10 7EA RM10 7EB RM10 7EJ RM10 7ER |
| Rainham Road South | RM10 7TA RM10 7UU RM10 7XA RM10 7XB RM10 7XD RM10 7XJ RM10 7XP RM10 7TU RM10 8AA RM10 8QR RM10 8SX RM10 8XE |
| Reede Road | RM10 8EH RM10 8EL RM10 8EP RM10 8EJ RM10 8GG |
| Sterling Industrial Estate | RM10 8TX RM10 8HR |
| Suffolk Road | RM10 8EU |
| Surrey Road | RM10 8ES RM10 8ET |
| Tony Rawson Way | RM10 7BF |
| Victoria Road | RM10 7XL |
| Wantz Road | RM10 8PS |
| Wheel Farm Drive | RM10 7AJ RM10 7AR |
| Winstead Gardens | RM10 7TL RM10 7TP |
| Woodshire Road | RM10 7DB RM10 7DD RM10 7DH |
| Yewtree Avenue | RM10 7FN RM10 7FQ |
Transport near Eastbrook
-
Dagenham East Station
-
Dagenham Heathway Station
-
Elm Park Station
-
Becontree Station
-
Romford Station
-
Dagenham Dock Station
-
Chadwell Heath Station
-
Hornchurch Station
-
Goodmayes Station
-
Rainham Station
- FAQ
- Price Paid By Year
- Property Type Price
Frequently asked questions about Eastbrook
What is the average price for a property for sale in Eastbrook?
The average price for a property for sale in Eastbrook is £382,983. This amount is 8% higher than the average price in Dagenham. There are 1,012 property listings for sale in Eastbrook.
What streets have the most expensive properties for sale in Eastbrook?
The streets with the most expensive properties for sale in Eastbrook are Felhurst Crescent at an average of £452,500, Gay Gardens at an average of £444,875 and Victoria Road at an average of £437,500.
What streets have the most affordable properties for sale in Eastbrook?
The streets with the most affordable properties for sale in Eastbrook are Rainham Road South at an average of £260,638, Kent Road at an average of £268,000 and Bury Road at an average of £306,250.
Which train stations are available in or near Eastbrook?
Some of the train stations available in or near Eastbrook are Romford, Dagenham Dock and Chadwell Heath.
Which tube stations are available in or near Eastbrook?
Some of the tube stations available in or near Eastbrook are Dagenham East, Dagenham Heathway and Elm Park.
Property Price Paid in Eastbrook by Year
The average sold property price by year was:
| Year | Average Sold Price | Price Change |
Sold Properties
|
|---|---|---|---|
| 2025 | £413,148 | 12% |
27 Properties |
| 2024 | £365,422 | -5% |
45 Properties |
| 2023 | £382,500 | -1% |
50 Properties |
| 2022 | £387,500 | 5% |
39 Properties |
| 2021 | £369,735 | 9% |
56 Properties |
| 2020 | £335,589 | 2% |
46 Properties |
| 2019 | £328,137 | 5% |
51 Properties |
| 2018 | £312,415 | 1% |
53 Properties |
| 2017 | £309,927 | 4% |
62 Properties |
| 2016 | £297,566 | 19% |
63 Properties |
| 2015 | £239,615 | 7% |
51 Properties |
| 2014 | £221,711 | 14% |
66 Properties |
| 2013 | £191,244 | 2% |
49 Properties |
| 2012 | £186,722 | 1% |
31 Properties |
| 2011 | £184,484 | -2% |
32 Properties |
| 2010 | £188,057 | 12% |
39 Properties |
| 2009 | £165,702 | -28% |
37 Properties |
| 2008 | £211,304 | 5% |
50 Properties |
| 2007 | £201,406 | 10% |
121 Properties |
| 2006 | £181,727 | 6% |
68 Properties |
| 2005 | £170,598 | -5% |
63 Properties |
| 2004 | £179,058 | 18% |
92 Properties |
| 2003 | £147,644 | 18% |
69 Properties |
| 2002 | £120,960 | 23% |
106 Properties |
| 2001 | £93,338 | 11% |
57 Properties |
| 2000 | £83,235 | 16% |
54 Properties |
| 1999 | £69,804 | 8% |
64 Properties |
| 1998 | £63,952 | 8% |
62 Properties |
| 1997 | £58,711 | 3% |
86 Properties |
| 1996 | £56,717 | 6% |
47 Properties |
| 1995 | £53,122 | - |
42 Properties |
Property Price per Property Type in Eastbrook
Here you can find historic sold price data in order to help with your property search.
The average Property Paid Price for specific property types in the last three years are:
| Property Type | Average Sold Price | Sold Properties |
|---|---|---|
| Semi Detached House | £422,637.00 | 29 Semi Detached Houses |
| Detached House | £375,000.00 | 1 Detached House |
| Terraced House | £411,215.00 | 72 Terraced Houses |
| Flat | £224,250.00 | 20 Flats |

