
Houses for sale & to rent in Dagenham, Barking and Dagenham London Borough
House Prices in Dagenham
Properties in this part of Dagenham within the Barking and Dagenham London Borough have an average house price of £356k and had 2,567 Property Transactions within the last 3 years.¹ This area has 42,269 households² , where the most expensive property was sold for £1.31M.
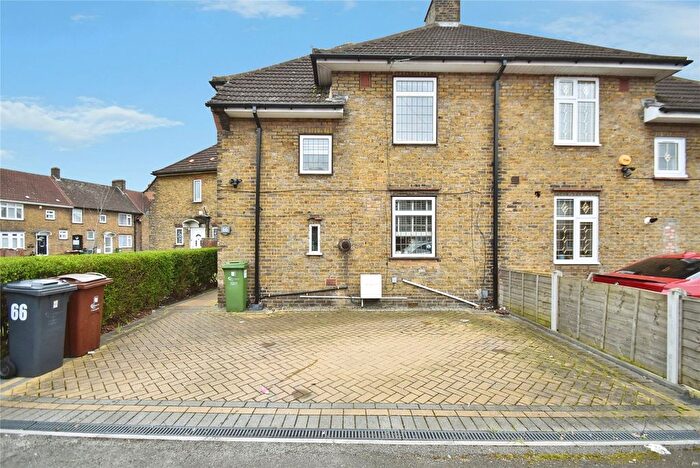
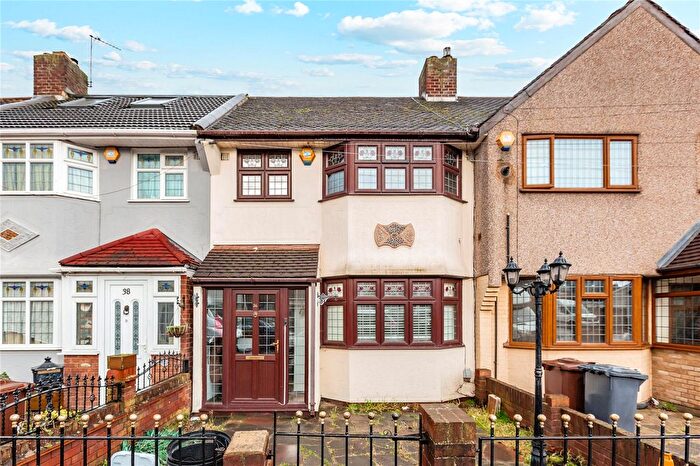
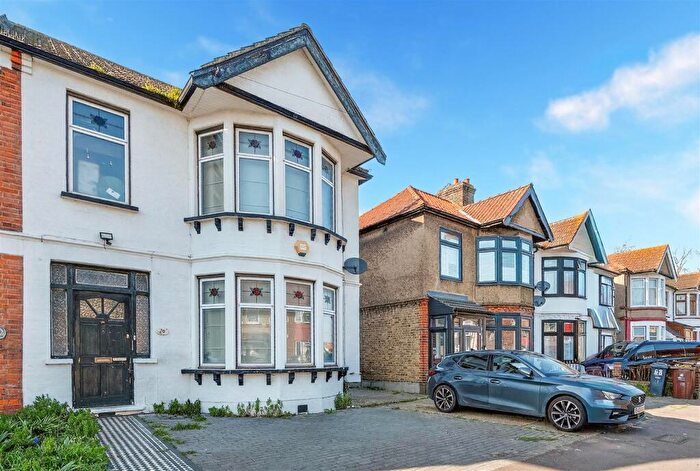
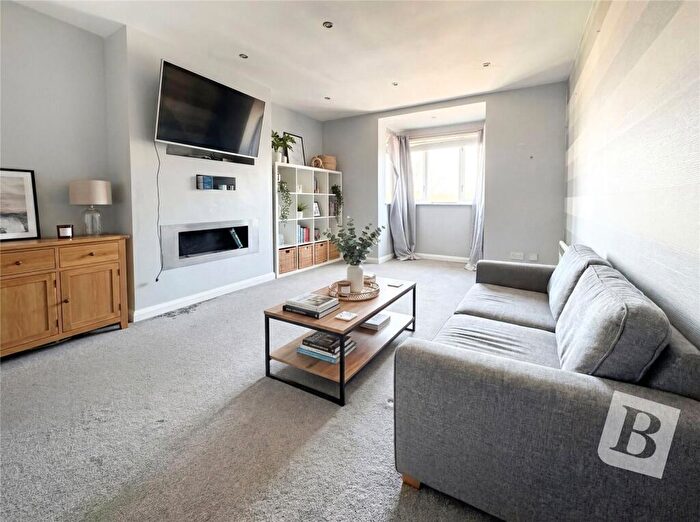
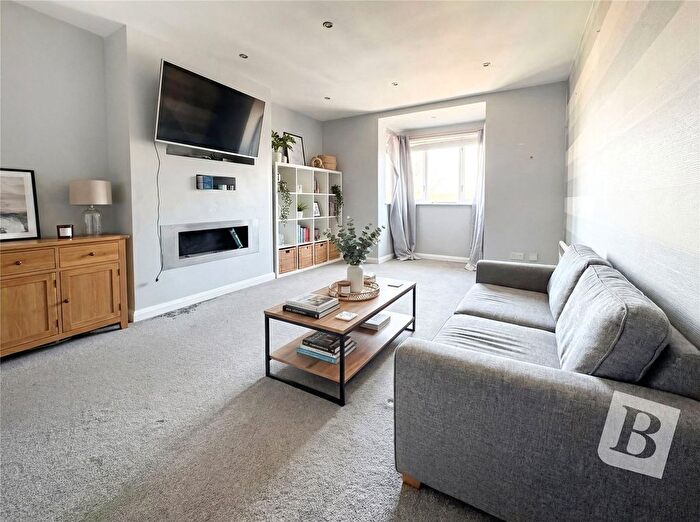
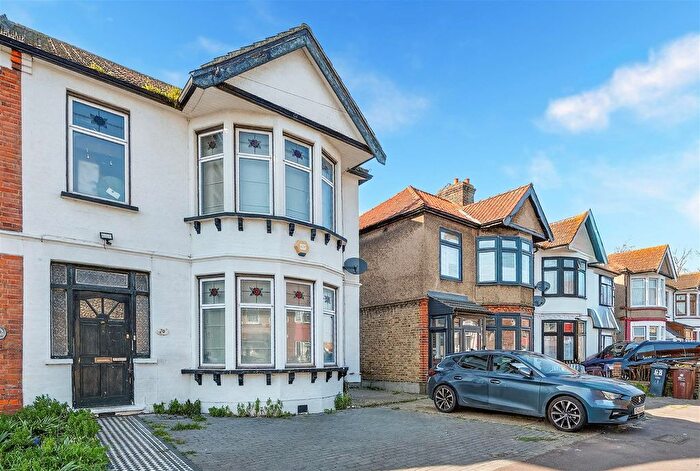
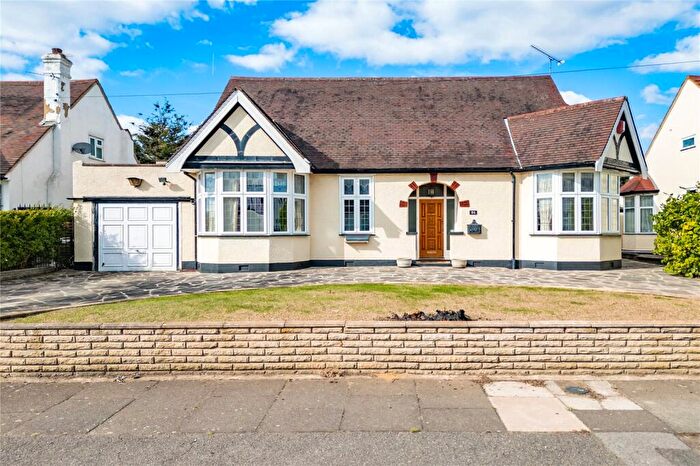
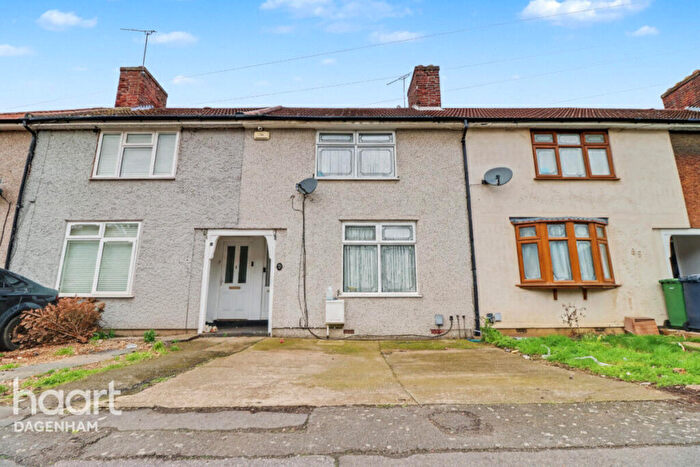
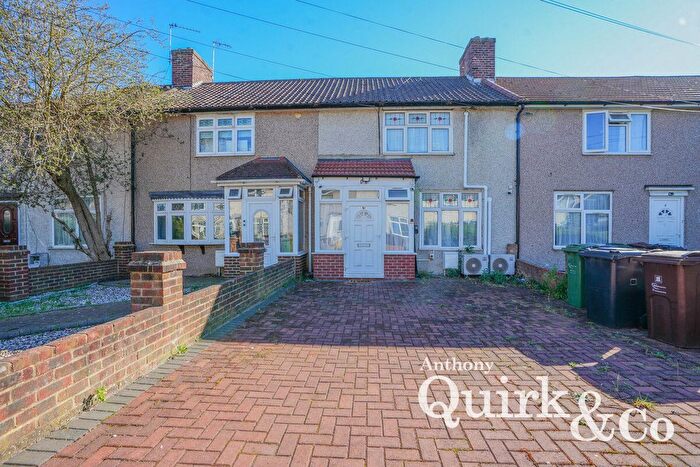
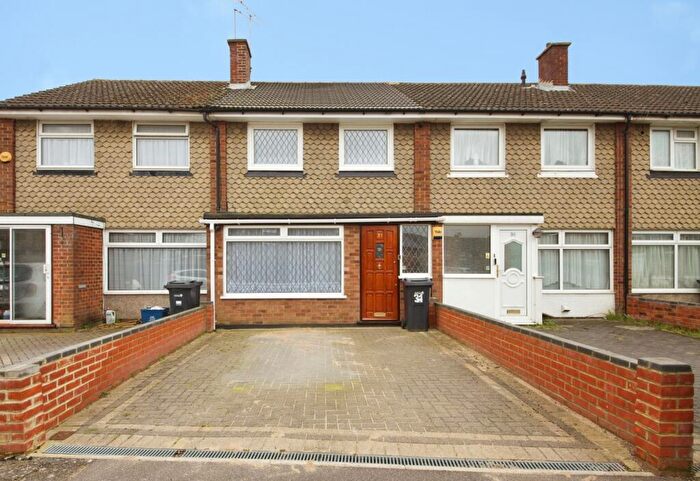
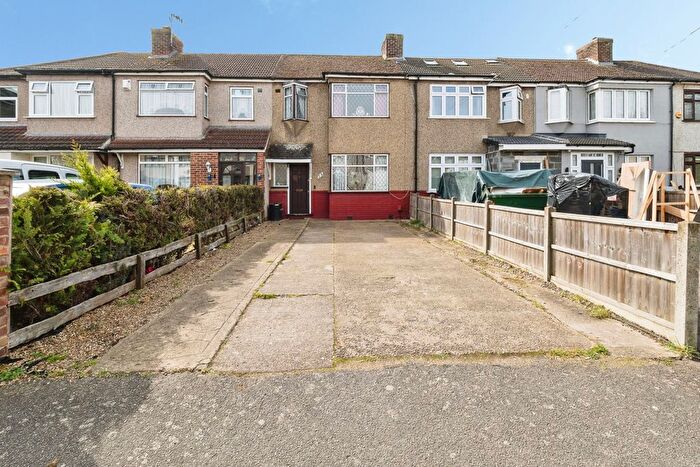
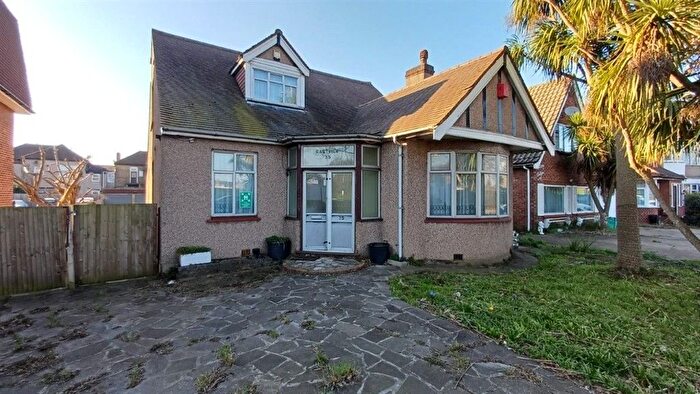
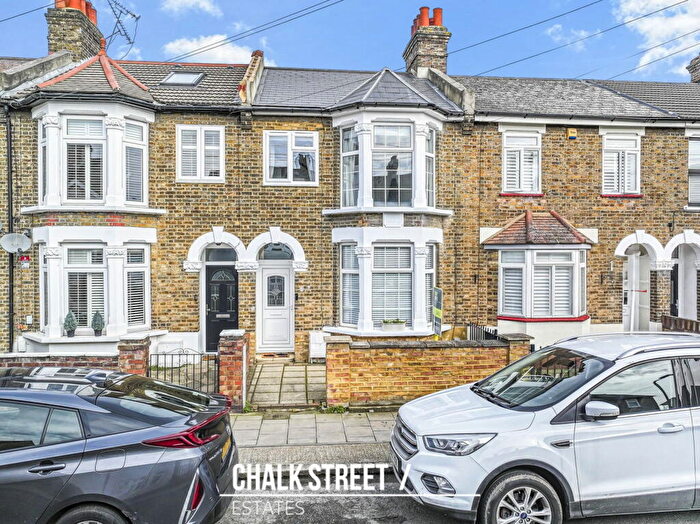
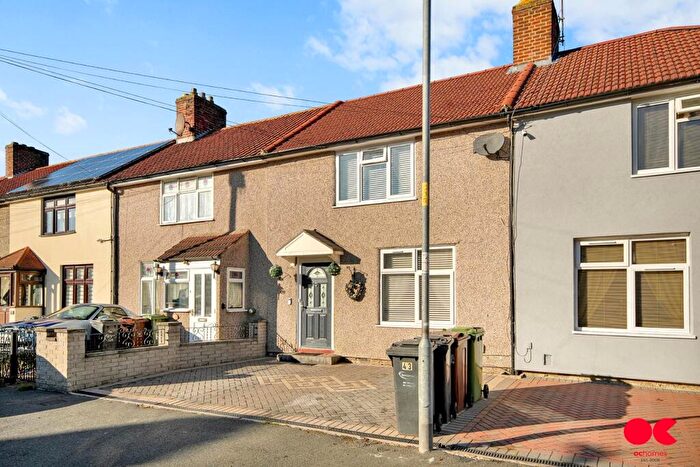
Properties for sale in Dagenham

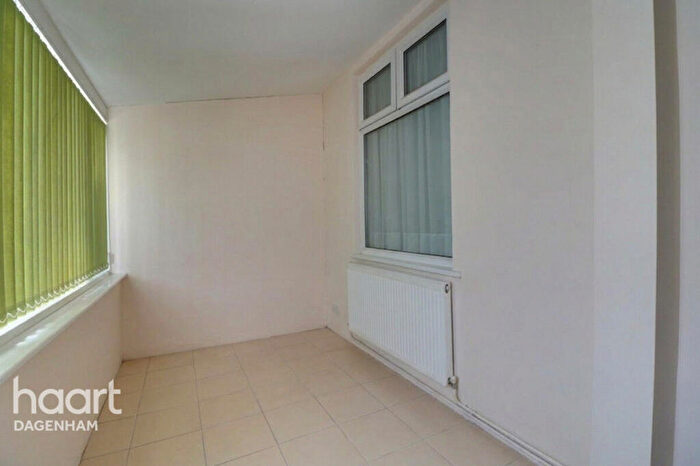
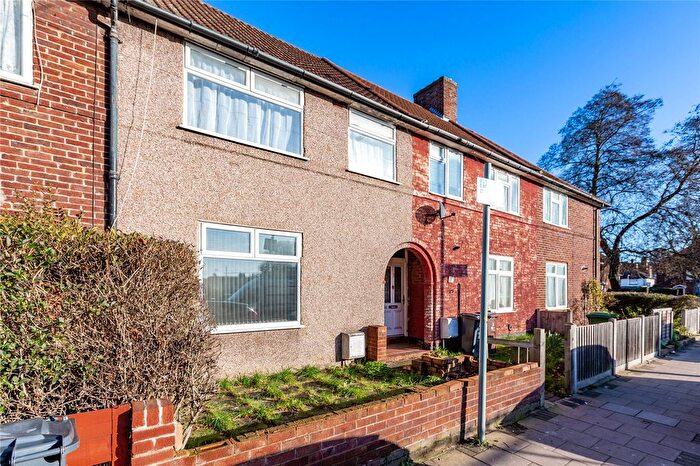


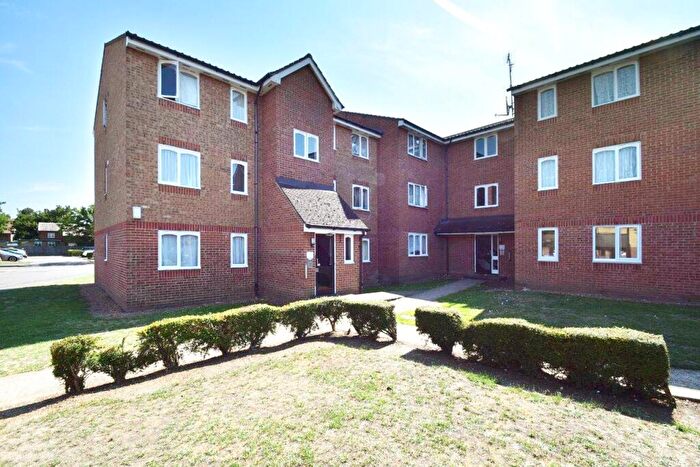
![]()
If you are looking to sell your house, let it out, or receive a property valuation, an expert can help you.
Click the button below to get started.
Neighbourhoods in Dagenham
Navigate through our locations to find the location of your next house in Dagenham, Barking and Dagenham London Borough for sale or to rent.
Transport in Dagenham
Please see below transportation links in this area:
-
 Dagenham Heathway Station
 -
Becontree Station
-
Dagenham East Station
-
 Dagenham Dock Station
 -
 Chadwell Heath Station
 -
Goodmayes Station
-
Upney Station
-
Seven Kings Station
-
Elm Park Station
-
 Romford Station
- FAQ
- Price Paid By Year
- Property Type Price
Frequently asked questions about Dagenham
What is the average price for a property for sale in Dagenham?
The average price for a property for sale in Dagenham is £356,123. This amount is 2% lower than the average price in Barking and Dagenham London Borough. There are more than 10,000 property listings for sale in Dagenham.
What locations have the most expensive properties for sale in Dagenham?
The locations with the most expensive properties for sale in Dagenham are Eastbrook at an average of £383,377, Becontree at an average of £371,488 and Parsloes at an average of £364,869.
What locations have the most affordable properties for sale in Dagenham?
The locations with the most affordable properties for sale in Dagenham are Thames at an average of £309,675, Village at an average of £341,554 and Goresbrook at an average of £345,757.
Which train stations are available in or near Dagenham?
Some of the train stations available in or near Dagenham are Dagenham Dock, Chadwell Heath and Goodmayes.
Which tube stations are available in or near Dagenham?
Some of the tube stations available in or near Dagenham are Dagenham Heathway, Becontree and Dagenham East.
Property Price Paid in Dagenham by Year
The average sold property price by year was:
| Year | Average Sold Price | Price Change |
Sold Properties
|
|---|---|---|---|
| 2025 | £359,838 | 3% |
754 Properties |
| 2024 | £350,071 | -3% |
923 Properties |
| 2023 | £359,253 | 1% |
890 Properties |
| 2022 | £356,490 | 9% |
1,001 Properties |
| 2021 | £324,238 | 4% |
1,315 Properties |
| 2020 | £312,350 | 3% |
909 Properties |
| 2019 | £301,856 | 3% |
1,183 Properties |
| 2018 | £291,868 | -0,5% |
1,262 Properties |
| 2017 | £293,262 | 4% |
1,369 Properties |
| 2016 | £280,572 | 16% |
1,466 Properties |
| 2015 | £236,812 | 12% |
1,550 Properties |
| 2014 | £208,663 | 15% |
1,465 Properties |
| 2013 | £177,345 | 6% |
1,073 Properties |
| 2012 | £167,435 | -2% |
778 Properties |
| 2011 | £169,996 | -0,3% |
881 Properties |
| 2010 | £170,553 | 9% |
813 Properties |
| 2009 | £155,991 | -22% |
683 Properties |
| 2008 | £190,306 | 3% |
990 Properties |
| 2007 | £183,976 | 10% |
2,234 Properties |
| 2006 | £166,063 | 3% |
2,264 Properties |
| 2005 | £161,637 | 3% |
1,789 Properties |
| 2004 | £156,242 | 12% |
2,093 Properties |
| 2003 | £137,761 | 19% |
2,230 Properties |
| 2002 | £111,144 | 22% |
2,070 Properties |
| 2001 | £87,137 | 14% |
1,814 Properties |
| 2000 | £75,181 | 16% |
1,550 Properties |
| 1999 | £62,805 | 8% |
1,500 Properties |
| 1998 | £57,822 | 10% |
1,467 Properties |
| 1997 | £51,825 | 9% |
1,377 Properties |
| 1996 | £47,301 | 0,4% |
1,080 Properties |
| 1995 | £47,109 | - |
982 Properties |
Property Price per Property Type in Dagenham
Here you can find historic sold price data in order to help with your property search.
The average Property Paid Price for specific property types in the last three years are:
| Property Type | Average Sold Price | Sold Properties |
|---|---|---|
| Semi Detached House | £401,683.00 | 277 Semi Detached Houses |
| Terraced House | £375,966.00 | 1,880 Terraced Houses |
| Detached House | £584,857.00 | 14 Detached Houses |
| Flat | £221,964.00 | 396 Flats |