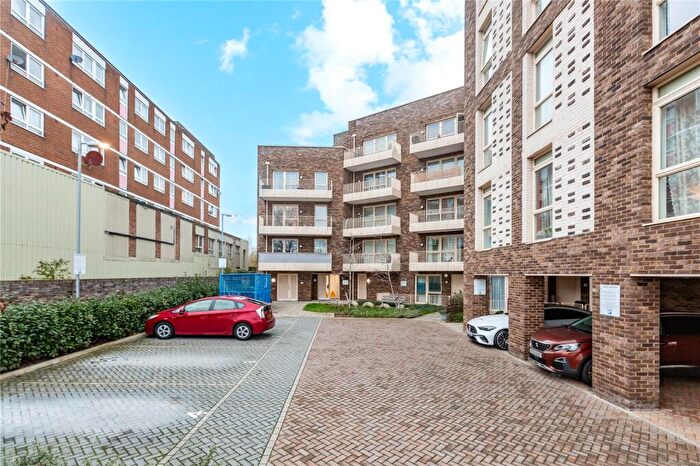
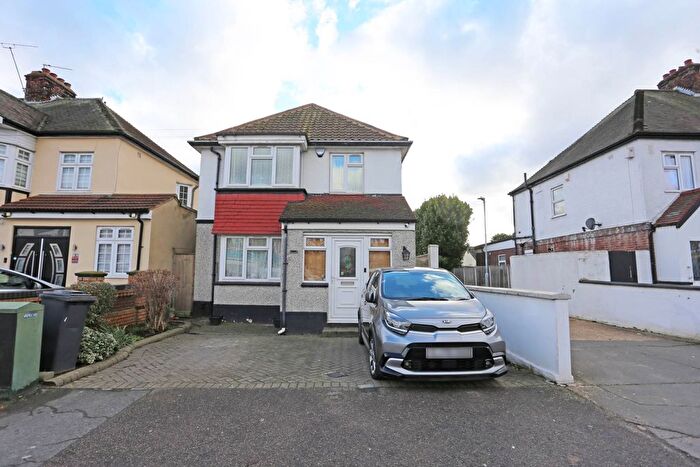
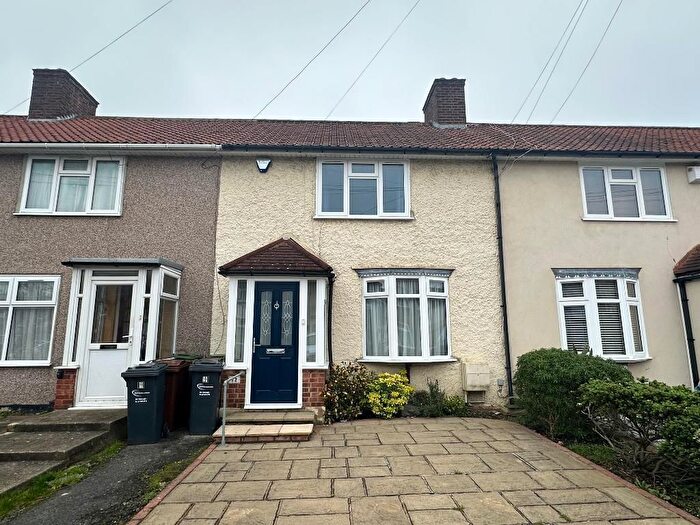
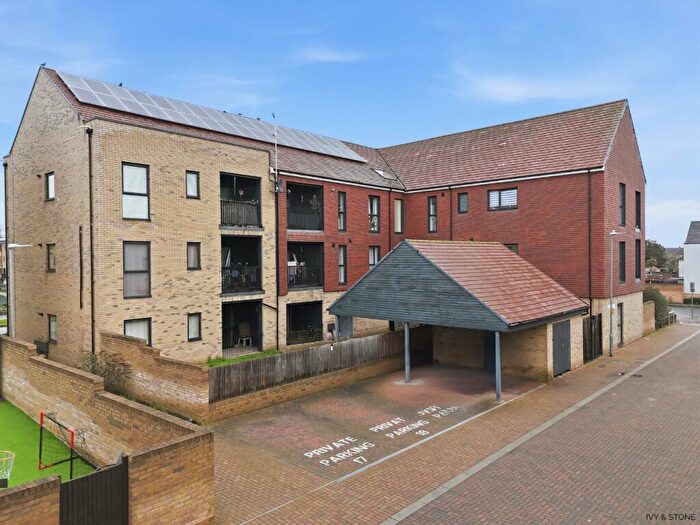
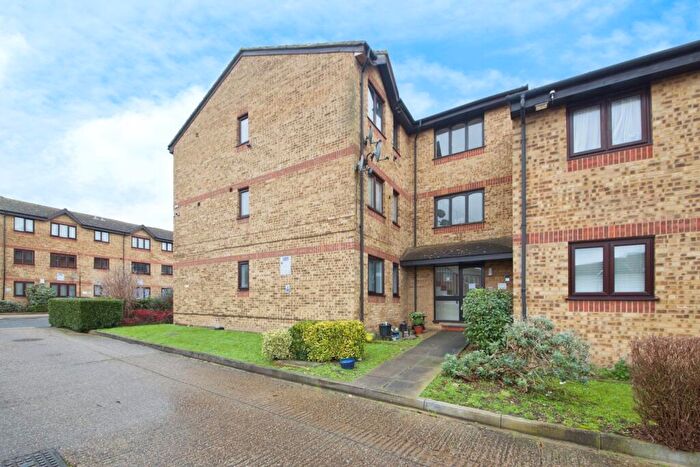
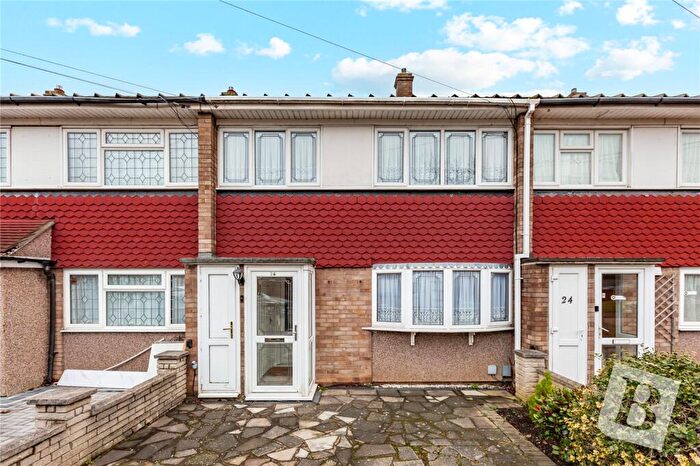
Houses for sale & to rent in Whalebone, Dagenham
House Prices in Whalebone
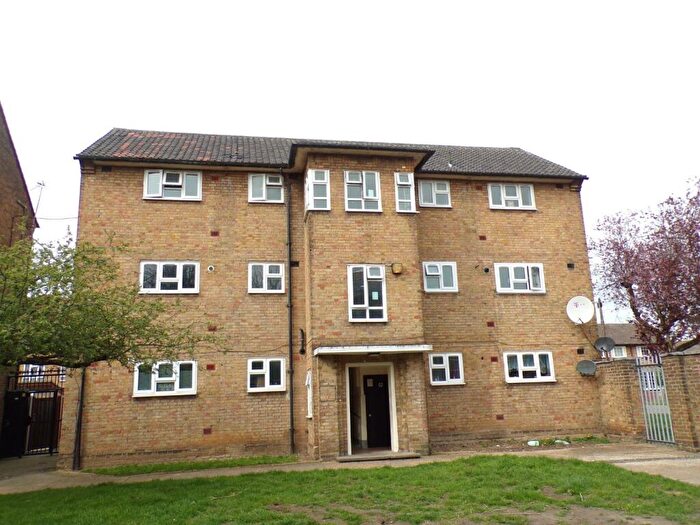
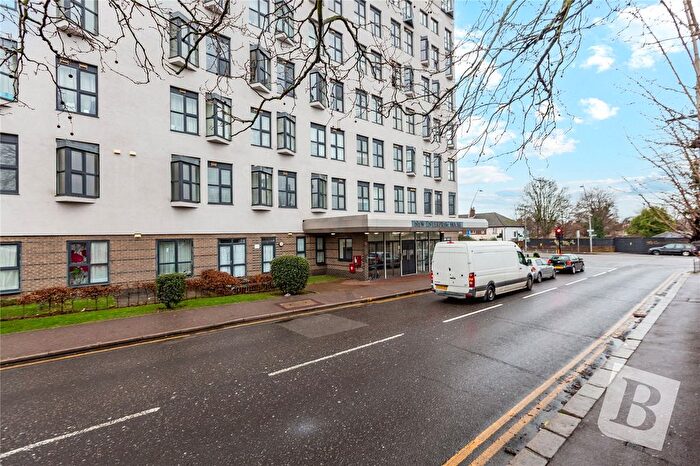
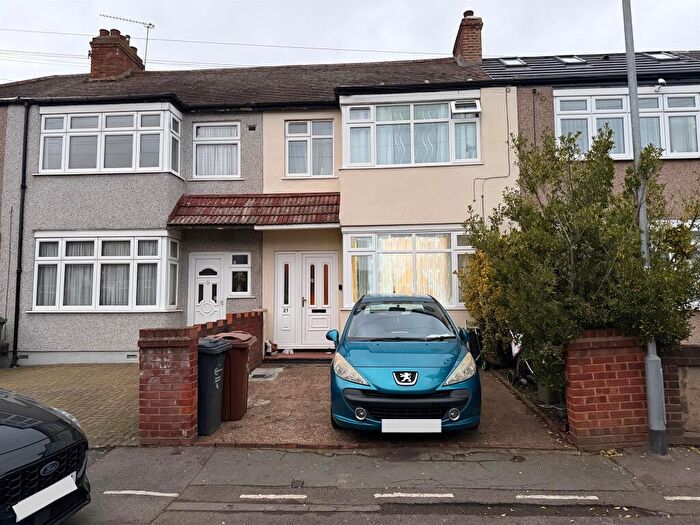
Properties in this part of Whalebone within Dagenham have an average house price of £358,559.00 and had 150 Property Transactions within the last 3 years¹. This area has 1,887 households² , where the most expensive property was sold for £520,000.00.
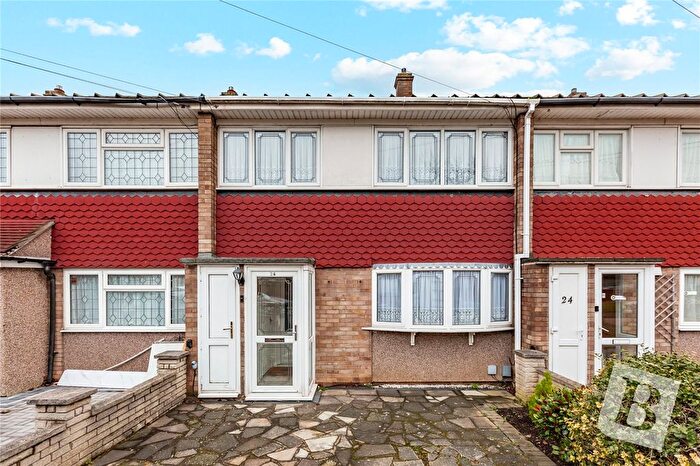
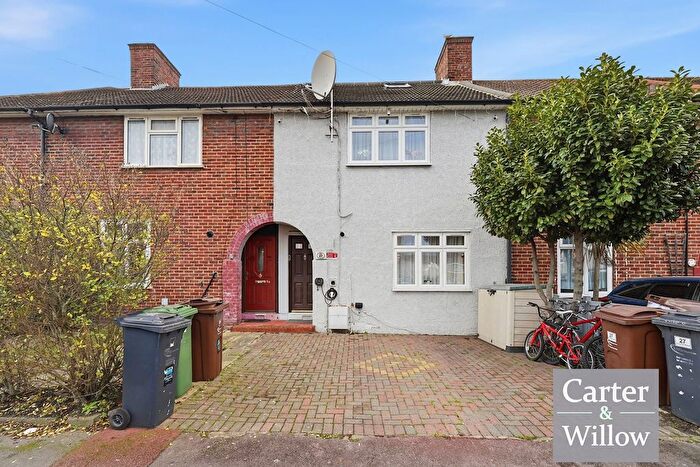
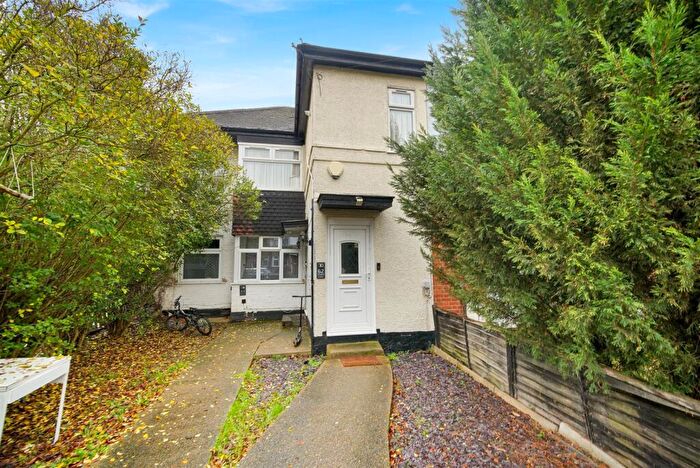
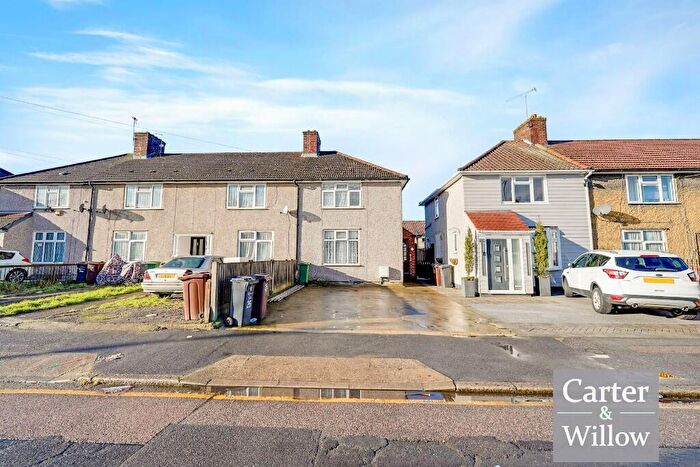
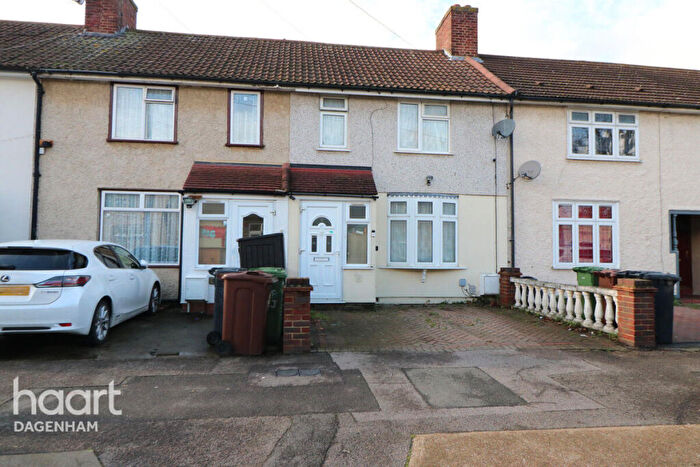
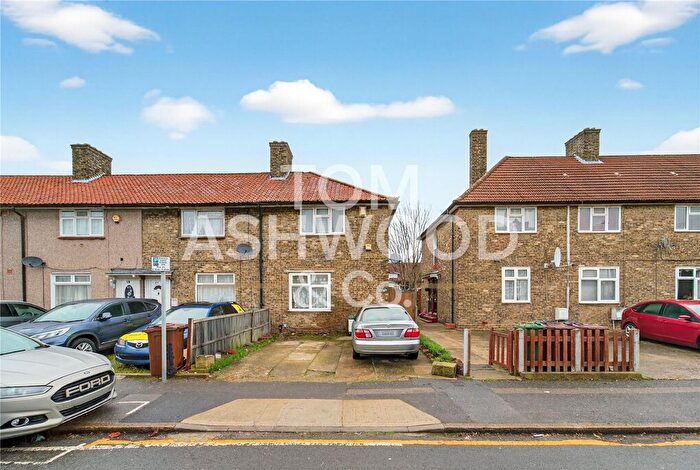
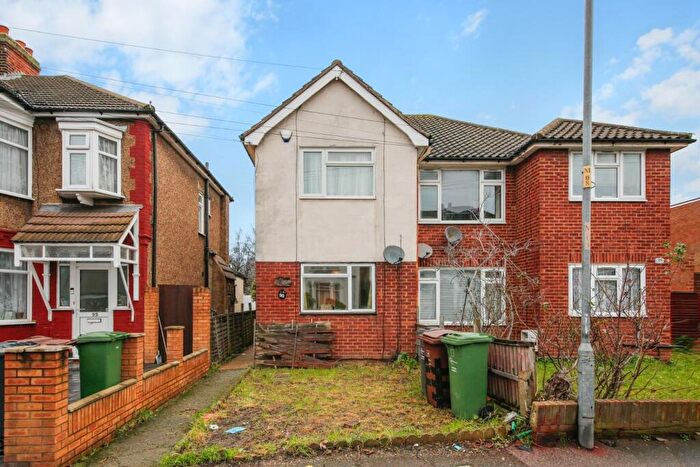
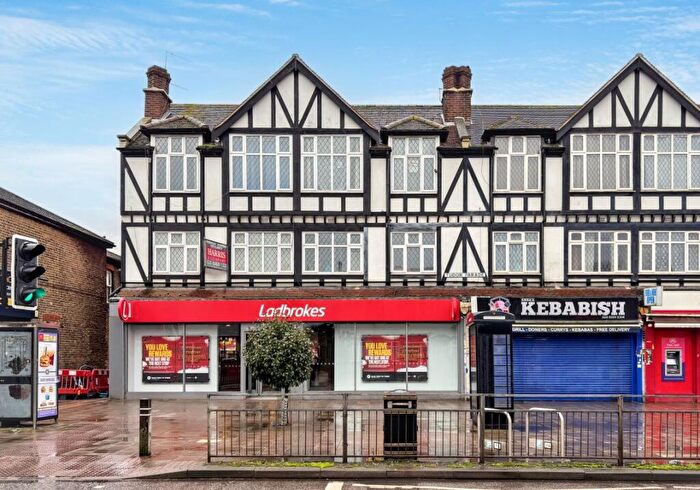
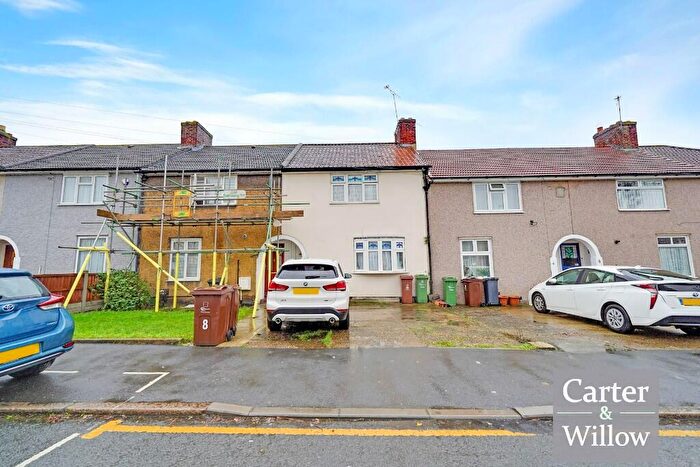
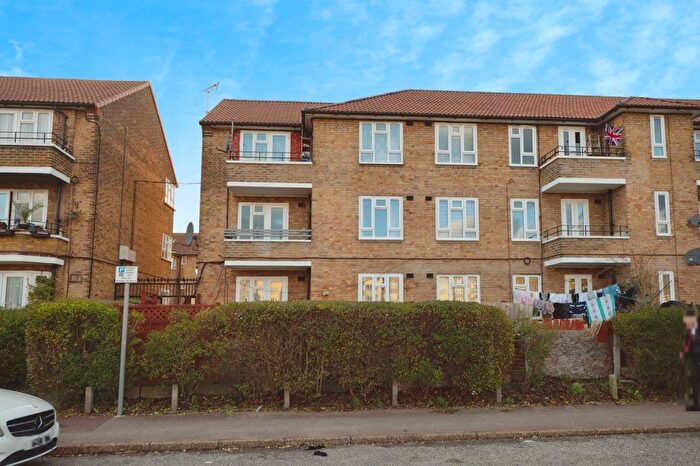
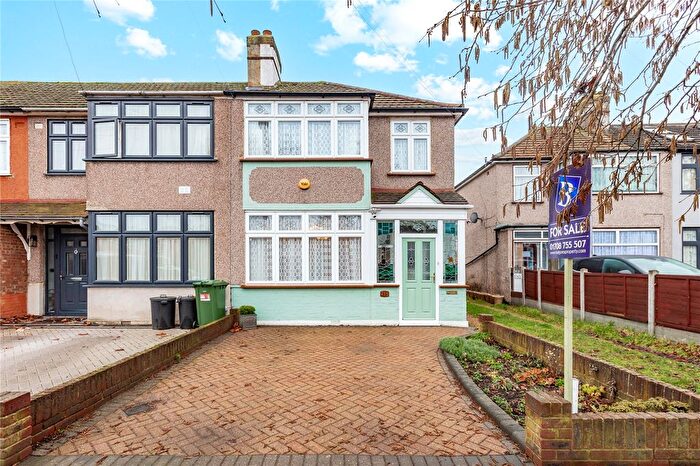
Properties for sale in Whalebone
Roads and Postcodes in Whalebone
Navigate through our locations to find the location of your next house in Whalebone, Dagenham for sale or to rent.
| Streets | Postcodes |
|---|---|
| Ager Avenue | RM8 1EQ |
| Albert Road | RM8 1LR |
| Banner Lane | RM8 1EN |
| Brendon Road | RM8 1LT |
| Calvert Mews | RM8 1AP |
| Cinema Parade | RM8 1AA |
| Coppen Road | RM8 1HJ RM8 1HN RM8 1NU |
| Dowletts Road | RM8 1FJ |
| Ellis Avenue | RM8 1FF |
| Emerald Gardens | RM8 1LG RM8 1LH RM8 1LN |
| Fambridge Road | RM8 1NS |
| Fordyke Road | RM8 1PD RM8 1PH RM8 1PJ |
| Freshwater Road | RM8 1SP RM8 1SH |
| Fullerton Avenue | RM8 1FG |
| Gerald Road | RM8 1PT |
| Grafton Gardens | RM8 1QR |
| Grafton Road | RM8 1QP |
| Gray Avenue | RM8 1LU |
| Green Lane | RM8 1DH RM8 1DJ RM8 1AB RM8 1AL |
| Grosvenor Road | RM8 1NH RM8 1NJ RM8 1NL RM8 1NP RM8 1NR |
| Hennessey Mews | RM8 1EL |
| Henson Road | RM8 1FA |
| James Avenue | RM8 1LD RM8 1LJ |
| Joan Gardens | RM8 1QX |
| Lamberhurst Road | RM8 1PR RM8 1PS |
| Laneside Avenue | RM8 1JD |
| Limbourne Avenue | RM8 1HU RM8 1HX |
| Marlow Road | RM8 1FE |
| Meredith Walk | RM8 1FH |
| Mirravale Trading Estate | RM8 1QD RM8 1YY |
| Morgan Crescent | RM8 1ER |
| Mount Road | RM8 1NA |
| Patrick Crescent | RM8 1EU |
| Purland Close | RM8 1AS |
| Roffe Gardens | RM8 1AX |
| Rosemary Gardens | RM8 1AR |
| Ross Avenue | RM8 1PU |
| Rosslyn Avenue | RM8 1JP RM8 1JR |
| Royal Anglian Way | RM8 1AE RM8 1FL |
| Selinas Lane | RM8 1ES RM8 1HT RM8 1QE RM8 1QH RM8 1TB |
| Spring Close | RM8 1SR RM8 1SW |
| Stanley Avenue | RM8 1JA RM8 1JB RM8 1JH RM8 1JJ RM8 1JL |
| Temple Avenue | RM8 1LL RM8 1LP RM8 1LS RM8 1LX RM8 1NB |
| Tenterden Road | RM8 1PX RM8 1QA |
| The Broadway | RM8 1DZ |
| Torrington Road | RM8 1ND |
| Turnage Road | RM8 1QS RM8 1QT |
| Vaughn Street | RM8 1EP |
| Warley Avenue | RM8 1JS |
| Whalebone Lane South | RM8 1AD RM8 1AH RM8 1AJ RM8 1AT RM8 1BA RM8 1BB RM8 1BJ RM8 1FB RM8 1HB |
| Winifred Road | RM8 1PL RM8 1PP |
| Wood Lane | RM8 1DR |
Transport near Whalebone
-
Chadwell Heath Station
-
Goodmayes Station
-
Dagenham Heathway Station
-
Dagenham East Station
-
Romford Station
-
Becontree Station
-
Seven Kings Station
-
Newbury Park Station
-
Elm Park Station
-
Upney Station
- FAQ
- Price Paid By Year
- Property Type Price
Frequently asked questions about Whalebone
What is the average price for a property for sale in Whalebone?
The average price for a property for sale in Whalebone is £358,559. This amount is 0.79% higher than the average price in Dagenham. There are 1,690 property listings for sale in Whalebone.
What streets have the most expensive properties for sale in Whalebone?
The streets with the most expensive properties for sale in Whalebone are Morgan Crescent at an average of £485,000, Ellis Avenue at an average of £474,000 and Torrington Road at an average of £466,666.
What streets have the most affordable properties for sale in Whalebone?
The streets with the most affordable properties for sale in Whalebone are Spring Close at an average of £177,347, Whalebone Lane South at an average of £258,414 and Limbourne Avenue at an average of £270,666.
Which train stations are available in or near Whalebone?
Some of the train stations available in or near Whalebone are Chadwell Heath, Goodmayes and Romford.
Which tube stations are available in or near Whalebone?
Some of the tube stations available in or near Whalebone are Dagenham Heathway, Dagenham East and Becontree.
Property Price Paid in Whalebone by Year
The average sold property price by year was:
| Year | Average Sold Price | Price Change |
Sold Properties
|
|---|---|---|---|
| 2025 | £400,775 | 12% |
40 Properties |
| 2024 | £352,316 | 5% |
56 Properties |
| 2023 | £333,762 | -10% |
54 Properties |
| 2022 | £367,918 | 12% |
74 Properties |
| 2021 | £323,177 | -1% |
62 Properties |
| 2020 | £326,714 | -1% |
49 Properties |
| 2019 | £331,162 | 23% |
88 Properties |
| 2018 | £255,153 | -25% |
157 Properties |
| 2017 | £318,455 | 5% |
109 Properties |
| 2016 | £301,941 | 23% |
182 Properties |
| 2015 | £232,346 | 8% |
122 Properties |
| 2014 | £214,453 | 10% |
88 Properties |
| 2013 | £192,362 | 15% |
40 Properties |
| 2012 | £164,400 | -5% |
45 Properties |
| 2011 | £172,339 | 1% |
56 Properties |
| 2010 | £170,176 | 1% |
40 Properties |
| 2009 | £167,724 | -24% |
50 Properties |
| 2008 | £207,279 | 11% |
50 Properties |
| 2007 | £185,251 | 7% |
133 Properties |
| 2006 | £173,161 | 4% |
93 Properties |
| 2005 | £165,686 | 2% |
113 Properties |
| 2004 | £162,286 | 11% |
101 Properties |
| 2003 | £144,631 | 19% |
118 Properties |
| 2002 | £117,774 | 24% |
122 Properties |
| 2001 | £89,326 | 11% |
92 Properties |
| 2000 | £79,839 | 14% |
83 Properties |
| 1999 | £68,770 | 5% |
105 Properties |
| 1998 | £65,157 | 15% |
90 Properties |
| 1997 | £55,332 | 7% |
106 Properties |
| 1996 | £51,548 | 0,1% |
73 Properties |
| 1995 | £51,476 | - |
74 Properties |
Property Price per Property Type in Whalebone
Here you can find historic sold price data in order to help with your property search.
The average Property Paid Price for specific property types in the last three years are:
| Property Type | Average Sold Price | Sold Properties |
|---|---|---|
| Semi Detached House | £374,022.00 | 9 Semi Detached Houses |
| Terraced House | £406,591.00 | 106 Terraced Houses |
| Flat | £209,114.00 | 35 Flats |

