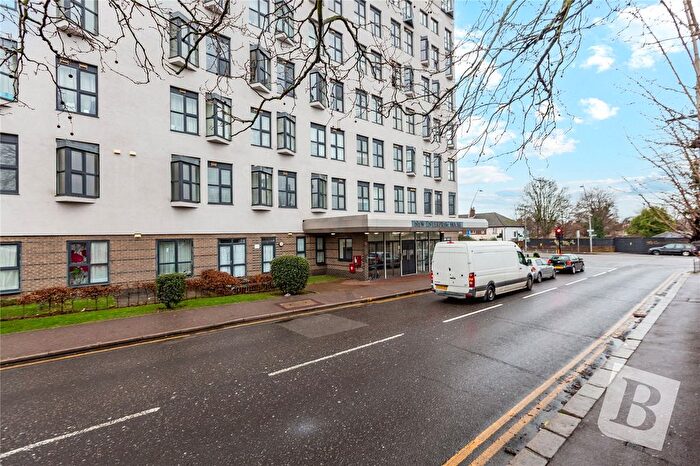
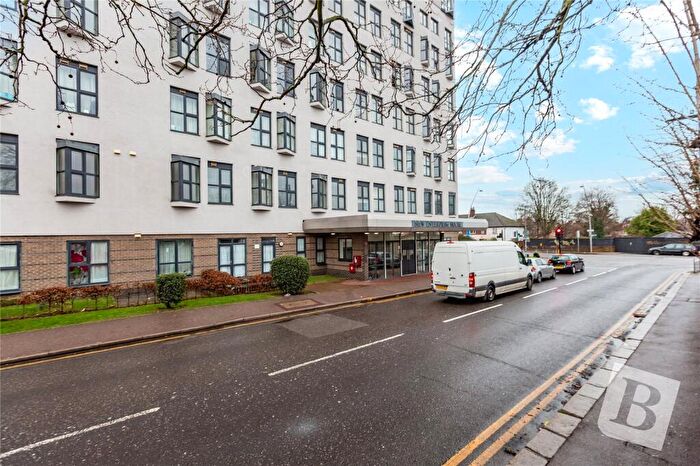
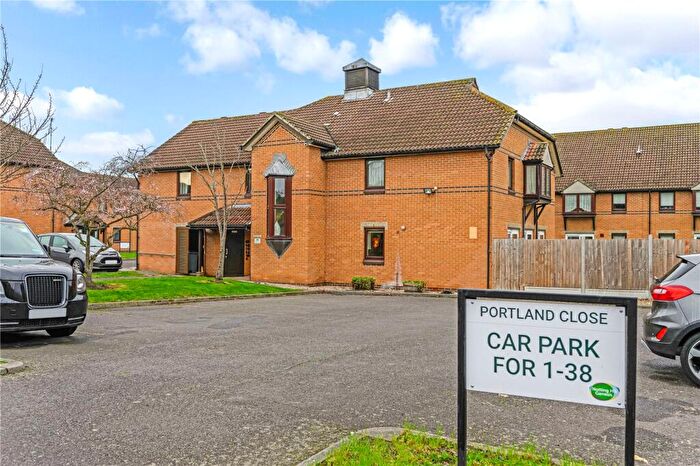
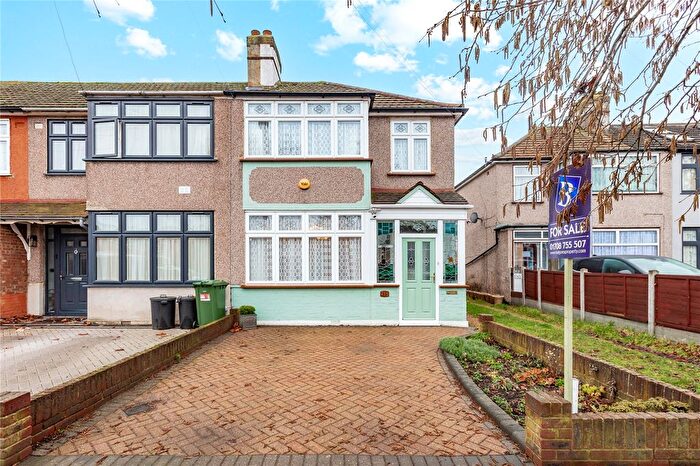
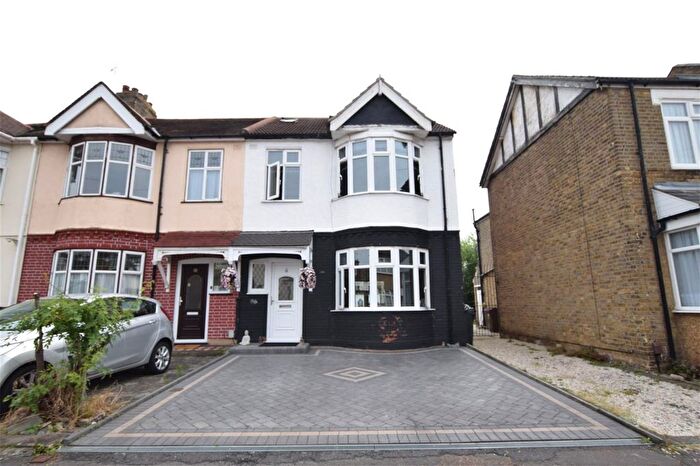
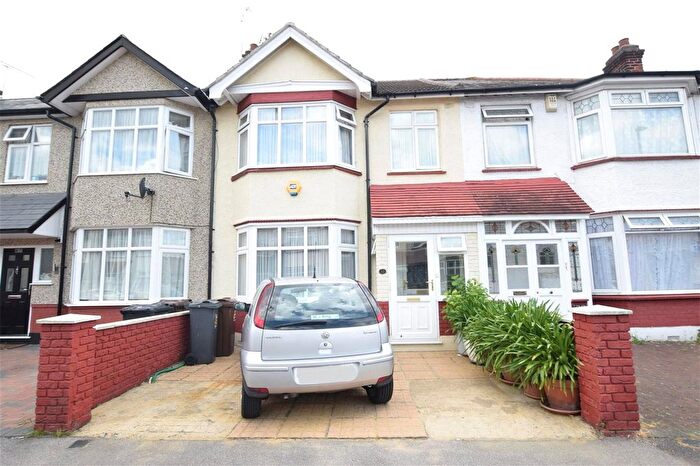
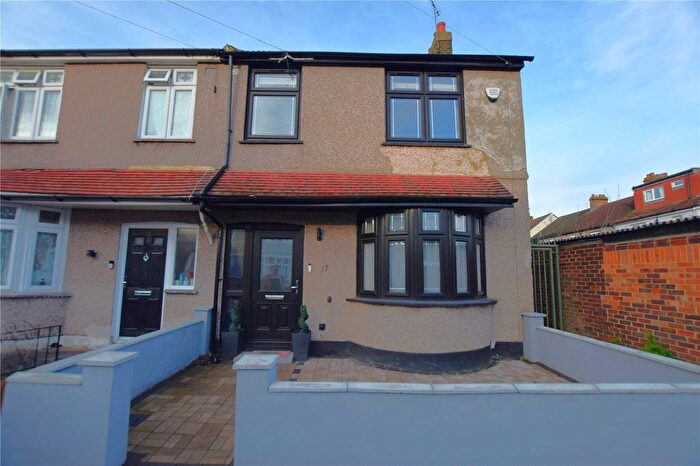
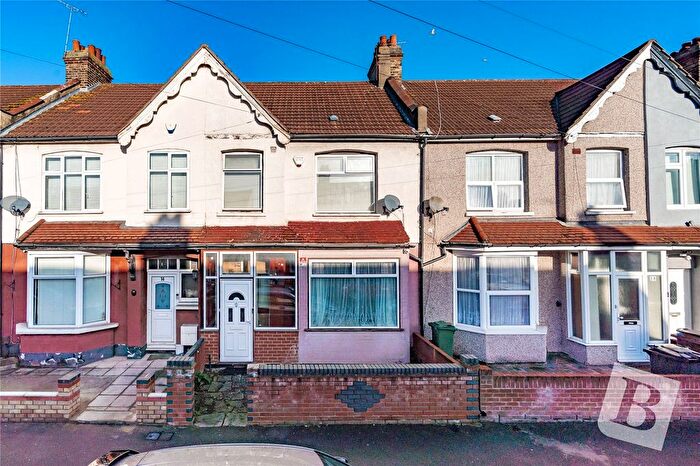
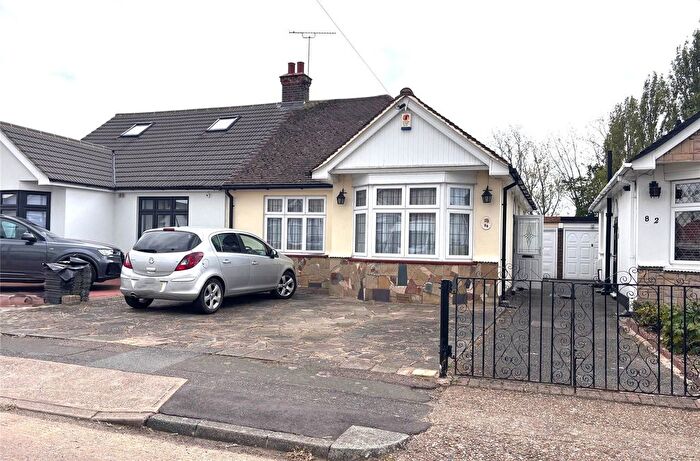
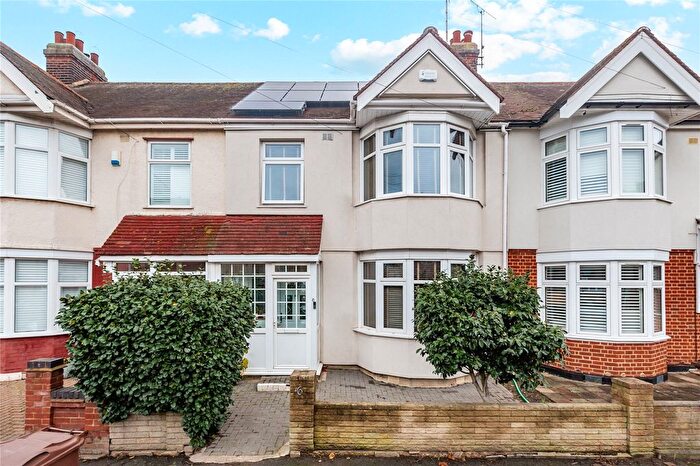
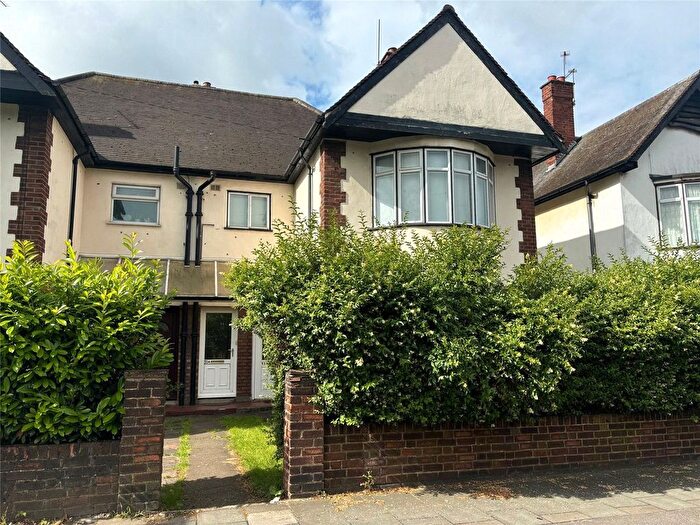
Houses for sale & to rent in Whalebone, Romford
House Prices in Whalebone
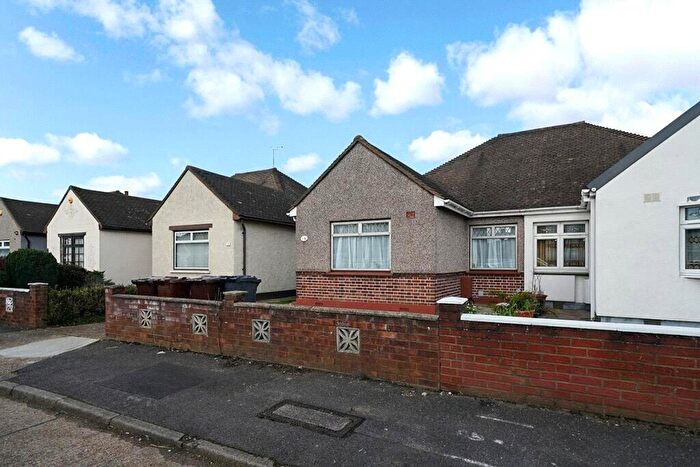
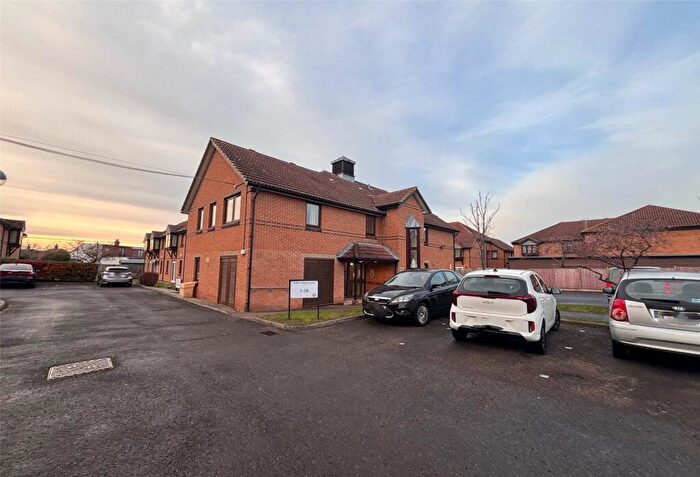
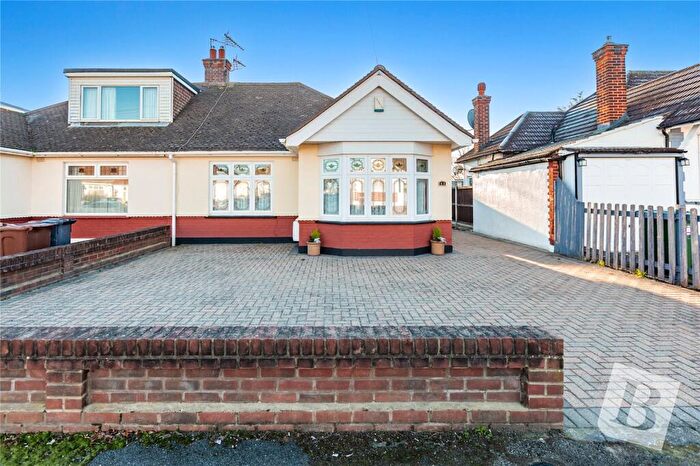
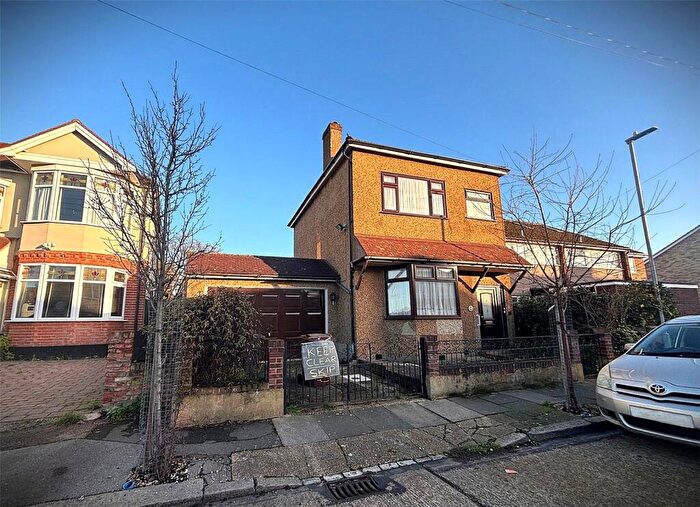
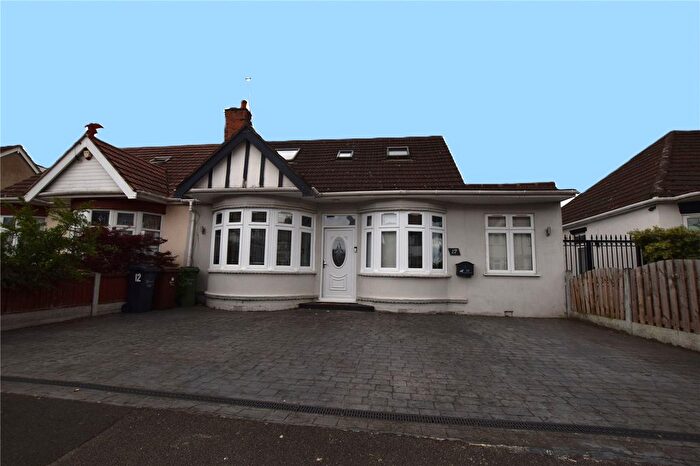
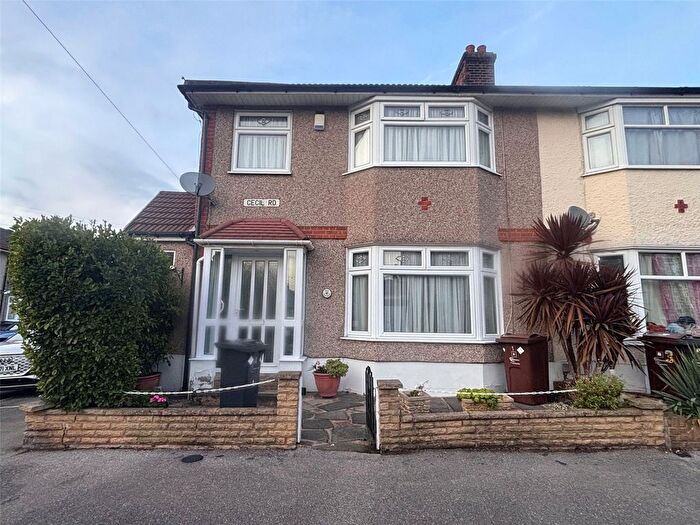
Properties in this part of Whalebone within Romford have an average house price of £401,659.00 and had 213 Property Transactions within the last 3 years¹. This area has 2,080 households² , where the most expensive property was sold for £660,000.00.
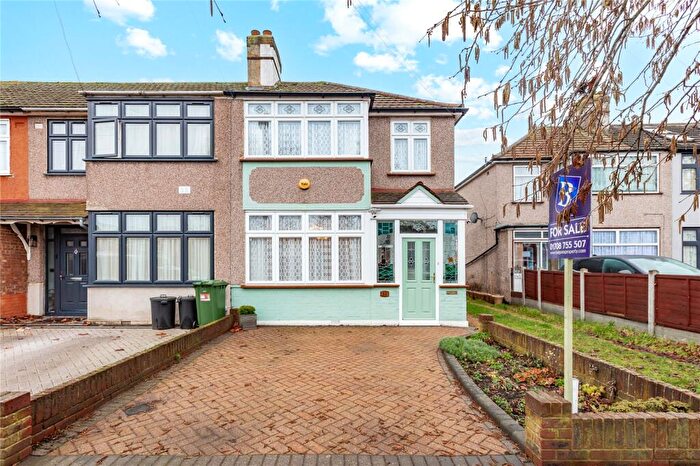
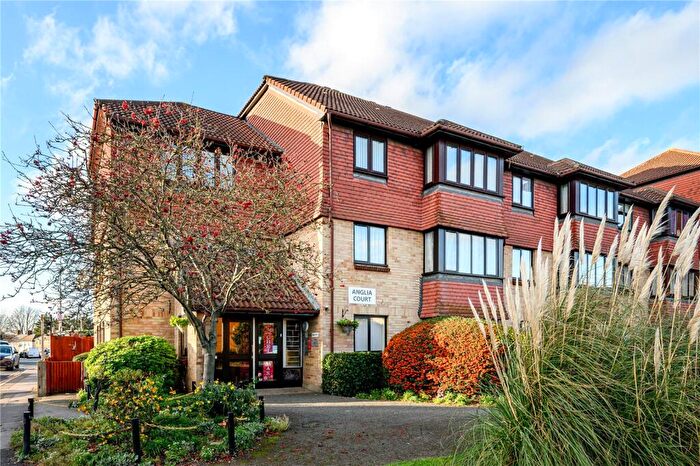
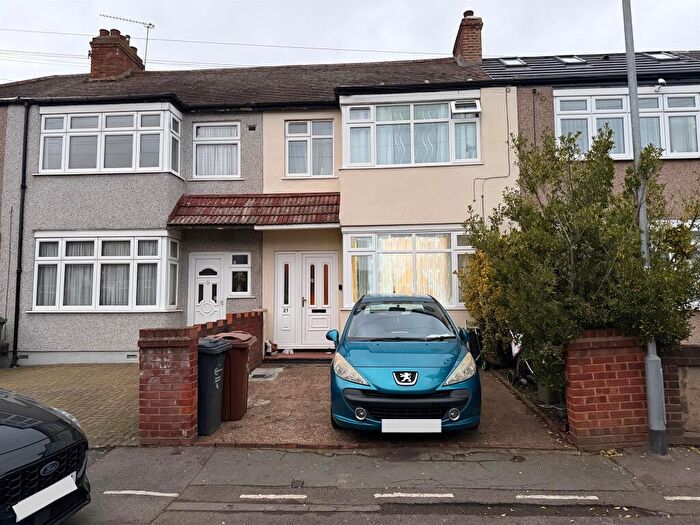
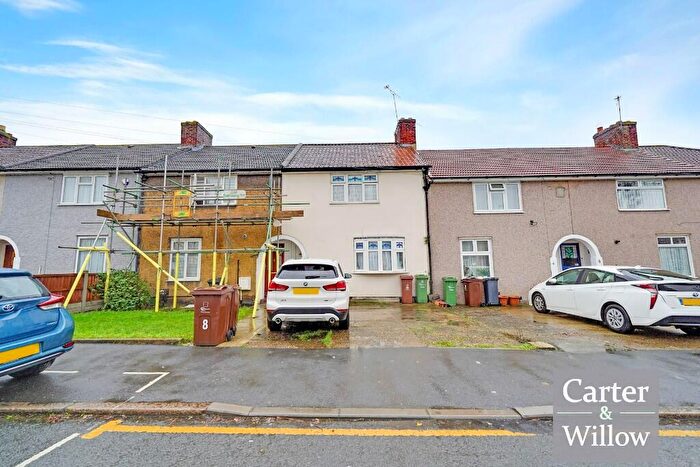
Properties for sale in Whalebone
Roads and Postcodes in Whalebone
Navigate through our locations to find the location of your next house in Whalebone, Romford for sale or to rent.
| Streets | Postcodes |
|---|---|
| Albany Road | RM6 6BP RM6 6BS |
| Back Lane | RM6 4BP |
| Bennett Road | RM6 6EP RM6 6ER RM6 6ES |
| Berengers Court | RM6 6HY |
| Broomfield Road | RM6 6DR RM6 6JT |
| Burchett Way | RM6 6BX |
| Burlington Gardens | RM6 6EL RM6 6ET |
| Cecil Road | RM6 6LA RM6 6LB |
| Coombewood Drive | RM6 6AA RM6 6AB |
| Dairy Mews | RM6 4FP |
| Eric Road | RM6 6JH RM6 6JJ |
| Eustace Road | RM6 6JL RM6 6JP RM6 6JR |
| Farrance Road | RM6 6EB RM6 6EJ |
| Forsters Close | RM6 6DH |
| Gordon Road | RM6 6DB RM6 6DD RM6 6DW |
| Grantham Gardens | RM6 6HH RM6 6HJ RM6 6HL |
| Hainault Road | RM6 6BH RM6 6BJ |
| Heath Road | RM6 6LD RM6 6LH RM6 6LJ |
| Heath Terrace | RM6 6JS |
| Herbert Gardens | RM6 4BS |
| High Road | RM6 6AJ RM6 6AP RM6 6AU RM6 6AX RM6 6BA RM6 6DJ RM6 6GN RM6 6LS RM6 6LU RM6 6NT RM6 6NU RM6 6NX RM6 6PN RM6 6PP RM6 6PR RM6 6AS RM6 6EE |
| Kenneth Road | RM6 6LL RM6 6LP RM6 6LR RM6 6QR |
| Kings Avenue | RM6 6BB RM6 6BD |
| London Road | RM6 6AD RM6 6AH |
| Merten Road | RM6 6EH |
| Morden Road | RM6 6ED |
| Plantagenet Gardens | RM6 6JX |
| Plantagenet Place | RM6 6JU |
| Salcombe Drive | RM6 6DU RM6 6DX |
| Saville Road | RM6 6DS RM6 6DT |
| St Chads Gardens | RM6 6JD |
| St Chads Road | RM6 6JB |
| Station Road | RM6 4BE RM6 4BL |
| Sylvan Avenue | RM6 6BE |
| Tara Close | RM6 6BF |
| Tudor Parade | RM6 6PS |
| Wadeville Avenue | RM6 6EU RM6 6EX RM6 6HA |
| Whalebone Avenue | RM6 6DA |
| Whalebone Grove | RM6 6BL RM6 6BT RM6 6BU |
| Whalebone Lane North | RM6 6RJ RM6 6GE |
| Whalebone Lane South | RM6 6HB RM6 6HP RM6 6HR |
| Woodlands Avenue | RM6 6EA |
Transport near Whalebone
-
Chadwell Heath Station
-
Goodmayes Station
-
Romford Station
-
Seven Kings Station
-
Dagenham Heathway Station
-
Newbury Park Station
-
Dagenham East Station
-
Becontree Station
-
Barkingside Station
-
Fairlop Station
- FAQ
- Price Paid By Year
- Property Type Price
Frequently asked questions about Whalebone
What is the average price for a property for sale in Whalebone?
The average price for a property for sale in Whalebone is £401,659. This amount is 1% higher than the average price in Romford. There are 1,962 property listings for sale in Whalebone.
What streets have the most expensive properties for sale in Whalebone?
The streets with the most expensive properties for sale in Whalebone are London Road at an average of £561,000, Coombewood Drive at an average of £501,000 and Morden Road at an average of £482,500.
What streets have the most affordable properties for sale in Whalebone?
The streets with the most affordable properties for sale in Whalebone are Tudor Parade at an average of £210,000, Grantham Gardens at an average of £240,090 and Whalebone Lane South at an average of £245,250.
Which train stations are available in or near Whalebone?
Some of the train stations available in or near Whalebone are Chadwell Heath, Goodmayes and Romford.
Which tube stations are available in or near Whalebone?
Some of the tube stations available in or near Whalebone are Dagenham Heathway, Newbury Park and Dagenham East.
Property Price Paid in Whalebone by Year
The average sold property price by year was:
| Year | Average Sold Price | Price Change |
Sold Properties
|
|---|---|---|---|
| 2025 | £386,628 | -3% |
35 Properties |
| 2024 | £399,357 | -1% |
56 Properties |
| 2023 | £404,321 | -1% |
56 Properties |
| 2022 | £409,324 | 11% |
66 Properties |
| 2021 | £366,093 | 8% |
77 Properties |
| 2020 | £335,500 | 6% |
44 Properties |
| 2019 | £315,648 | -19% |
71 Properties |
| 2018 | £375,862 | 10% |
68 Properties |
| 2017 | £338,039 | 9% |
91 Properties |
| 2016 | £307,519 | 14% |
76 Properties |
| 2015 | £264,695 | 13% |
89 Properties |
| 2014 | £229,217 | 13% |
88 Properties |
| 2013 | £200,321 | -2% |
78 Properties |
| 2012 | £204,485 | 2% |
57 Properties |
| 2011 | £201,370 | -7% |
58 Properties |
| 2010 | £215,516 | 14% |
62 Properties |
| 2009 | £185,207 | -21% |
46 Properties |
| 2008 | £223,340 | 2% |
53 Properties |
| 2007 | £218,705 | 9% |
159 Properties |
| 2006 | £198,429 | 7% |
128 Properties |
| 2005 | £185,303 | 2% |
124 Properties |
| 2004 | £181,703 | 7% |
128 Properties |
| 2003 | £169,263 | 20% |
104 Properties |
| 2002 | £136,178 | 17% |
123 Properties |
| 2001 | £113,106 | 16% |
139 Properties |
| 2000 | £94,819 | 21% |
115 Properties |
| 1999 | £74,908 | 6% |
138 Properties |
| 1998 | £70,082 | 11% |
91 Properties |
| 1997 | £62,429 | 5% |
111 Properties |
| 1996 | £59,451 | 2% |
94 Properties |
| 1995 | £58,048 | - |
48 Properties |
Property Price per Property Type in Whalebone
Here you can find historic sold price data in order to help with your property search.
The average Property Paid Price for specific property types in the last three years are:
| Property Type | Average Sold Price | Sold Properties |
|---|---|---|
| Semi Detached House | £412,189.00 | 29 Semi Detached Houses |
| Detached House | £531,750.00 | 6 Detached Houses |
| Terraced House | £434,219.00 | 143 Terraced Houses |
| Flat | £237,599.00 | 35 Flats |

