
Houses for sale & to rent in Romford, Barking and Dagenham London Borough
House Prices in Romford
Properties in this part of Romford within the Barking and Dagenham London Borough have an average house price of £395k and had 581 Property Transactions within the last 3 years.¹ This area has 7,939 households² , where the most expensive property was sold for £735k.
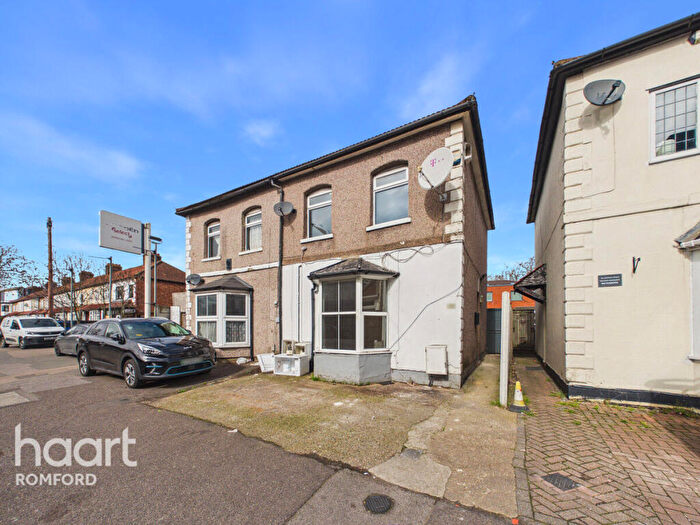
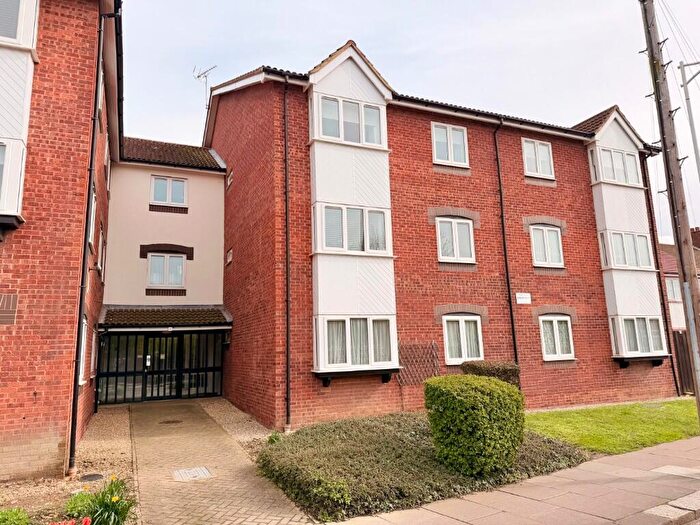
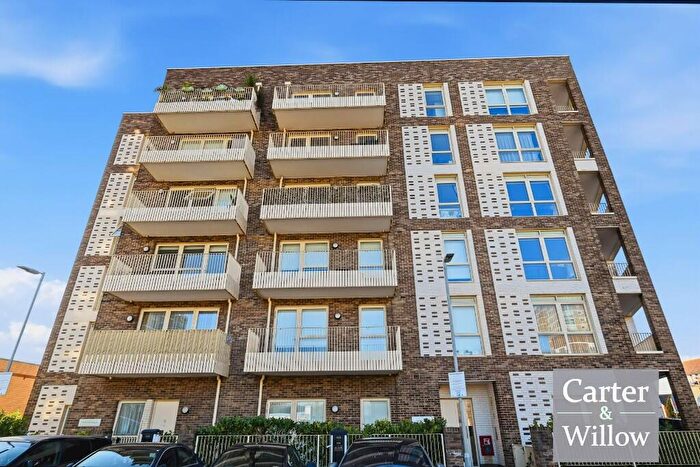
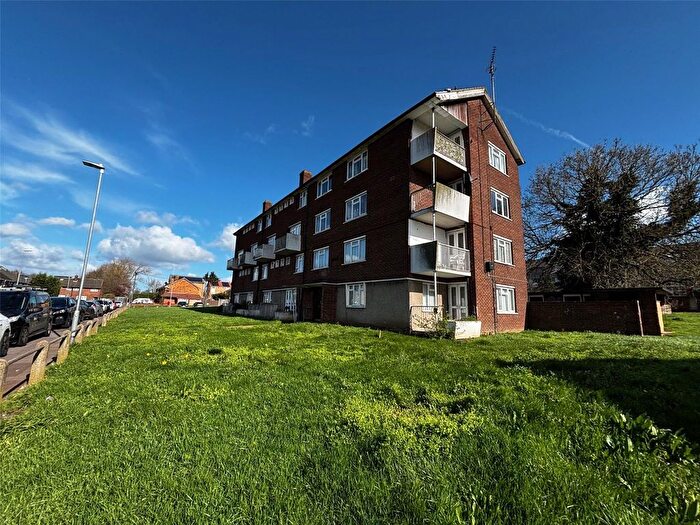
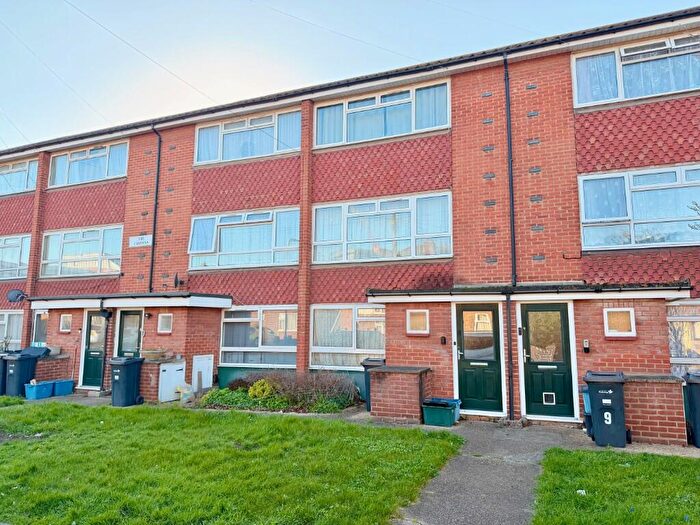
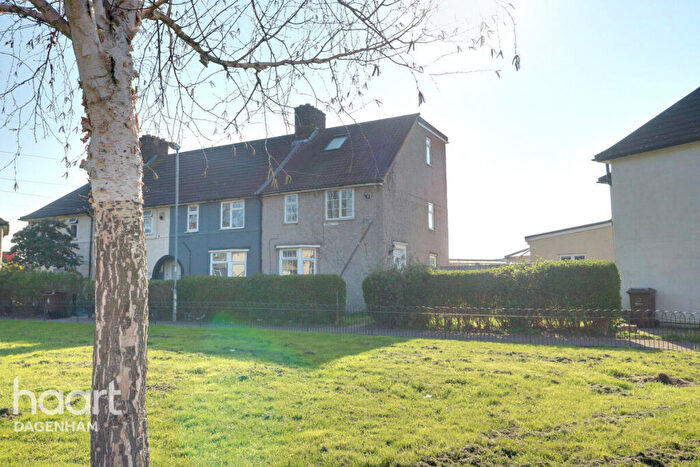
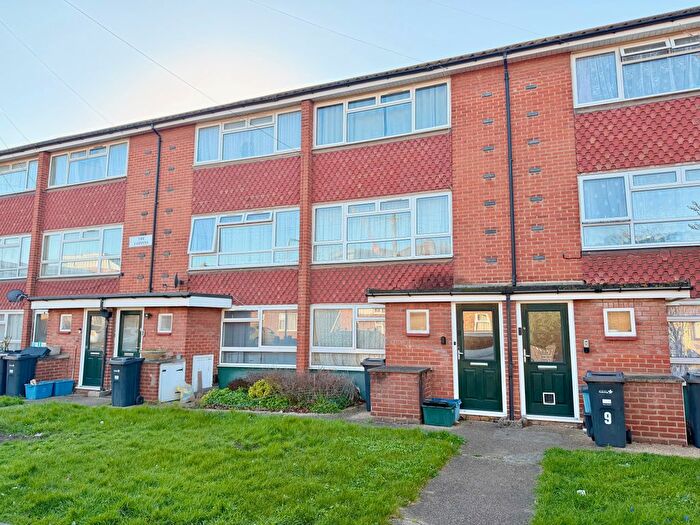
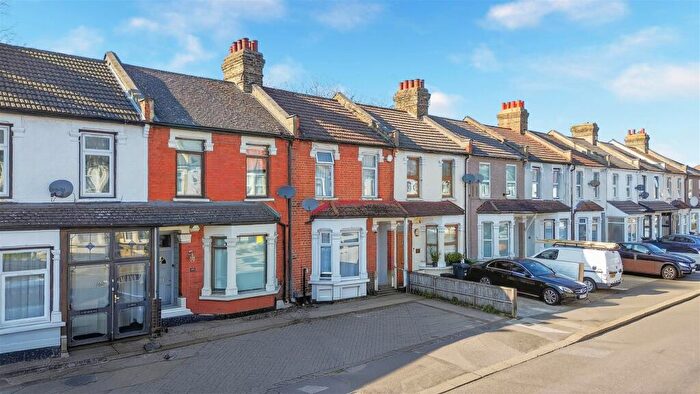
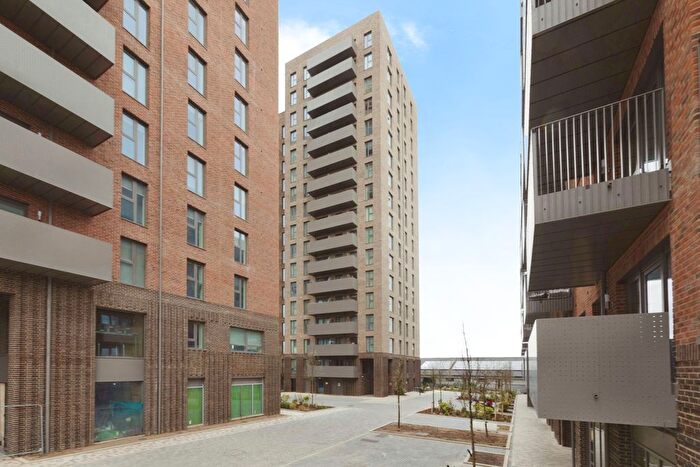
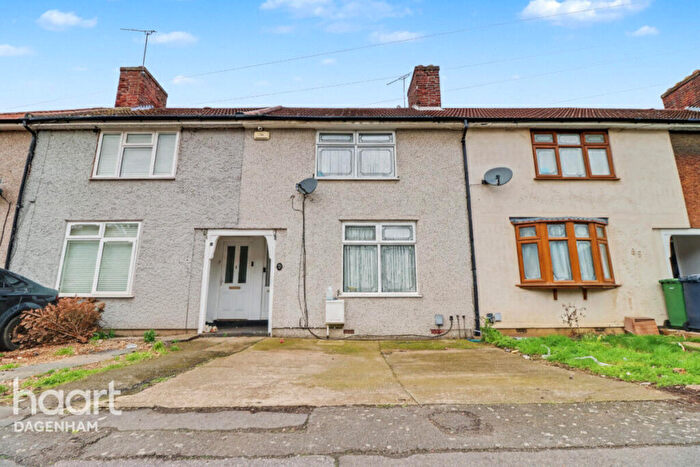
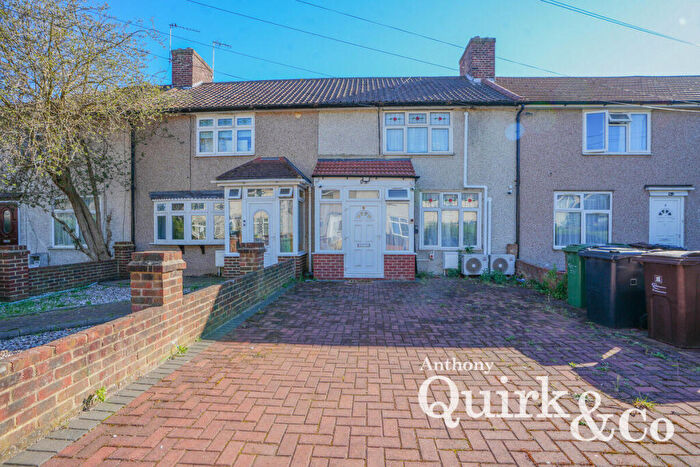
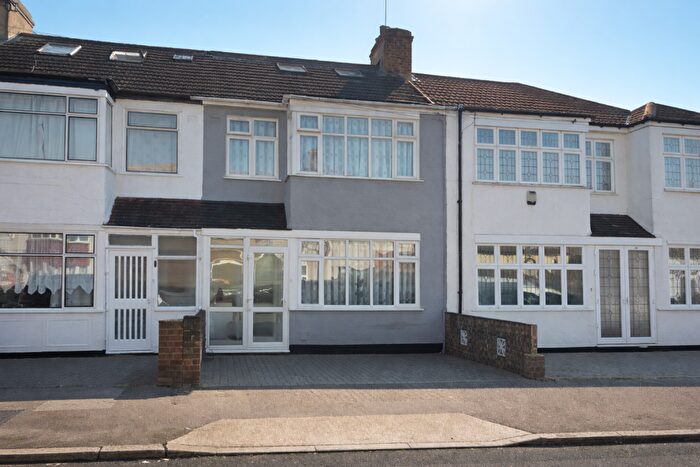
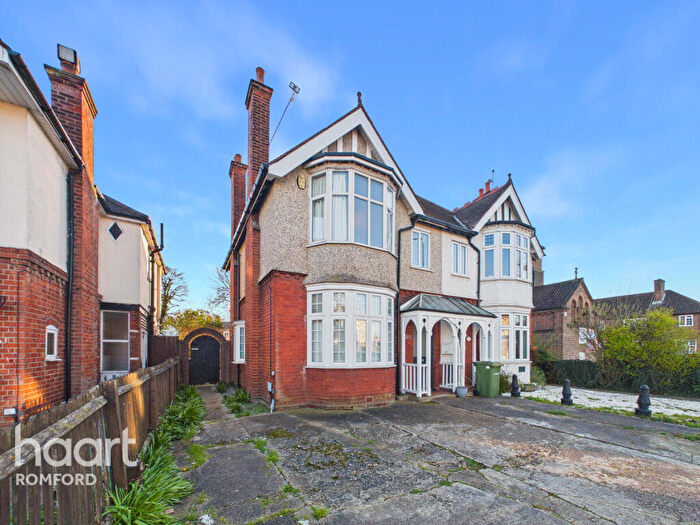
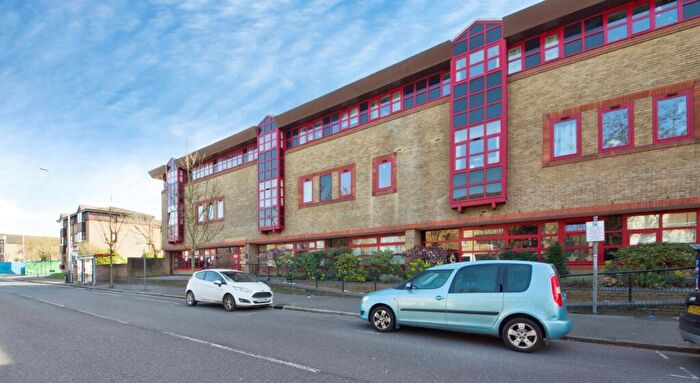
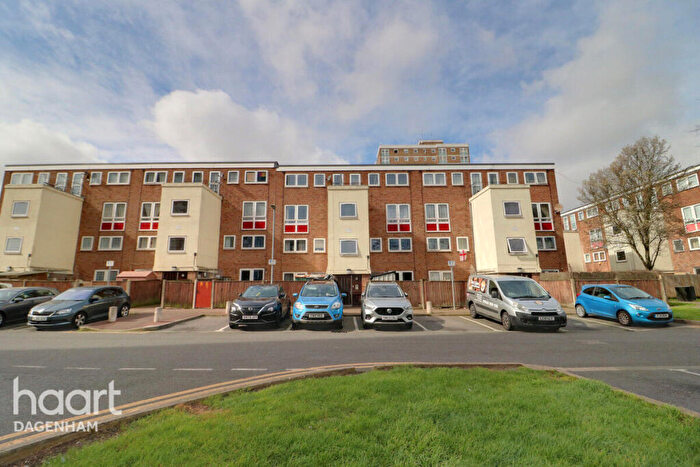
Properties for sale in Romford
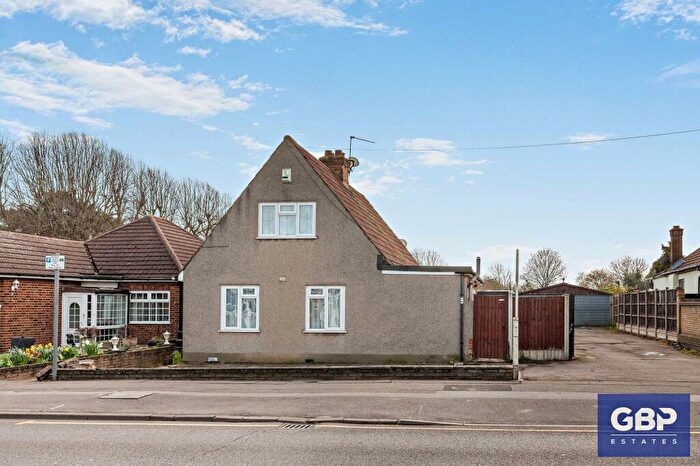
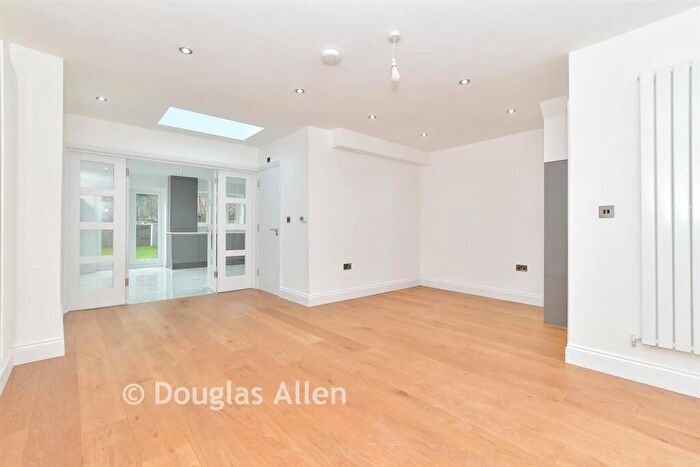
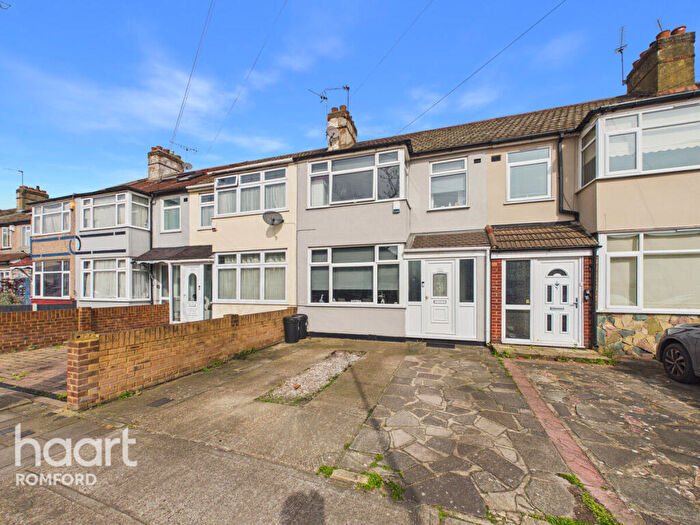
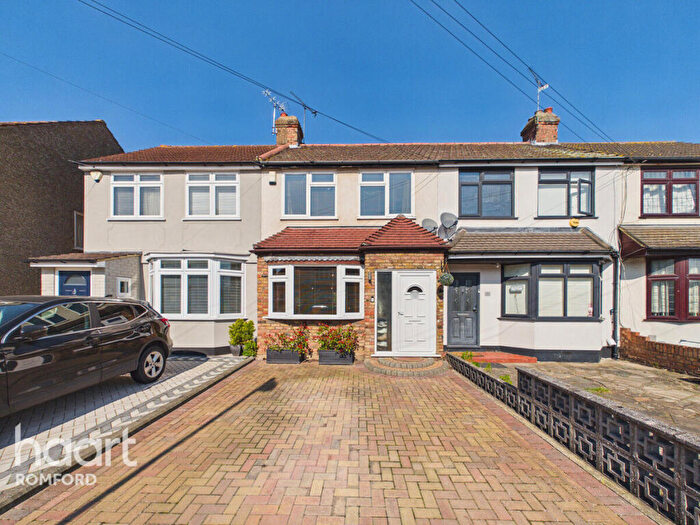
![]()
If you are looking to sell your house, let it out, or receive a property valuation, an expert can help you.
Click the button below to get started.


Neighbourhoods in Romford
Navigate through our locations to find the location of your next house in Romford, Barking and Dagenham London Borough for sale or to rent.
Transport in Romford
Please see below transportation links in this area:
-

 Chadwell Heath Station
 -
Goodmayes Station
-
 Romford Station
 -
Seven Kings Station
-
 Dagenham East Station
 -
Dagenham Heathway Station
-
Newbury Park Station
-
Becontree Station
-
Barkingside Station
-
Gidea Park Station
- FAQ
- Price Paid By Year
- Property Type Price
Frequently asked questions about Romford
What is the average price for a property for sale in Romford?
The average price for a property for sale in Romford is £394,988. This amount is 9% higher than the average price in Barking and Dagenham London Borough. There are more than 10,000 property listings for sale in Romford.
What locations have the most expensive properties for sale in Romford?
The locations with the most expensive properties for sale in Romford are Eastbrook at an average of £411,962 and Whalebone at an average of £397,006.
What locations have the most affordable properties for sale in Romford?
The location with the most affordable properties for sale in Romford is Chadwell Heath at an average of £381,966.
Which train stations are available in or near Romford?
Some of the train stations available in or near Romford are Chadwell Heath, Goodmayes and Romford.
Which tube stations are available in or near Romford?
Some of the tube stations available in or near Romford are Dagenham East, Dagenham Heathway and Newbury Park.
Property Price Paid in Romford by Year
The average sold property price by year was:
| Year | Average Sold Price | Price Change |
Sold Properties
|
|---|---|---|---|
| 2025 | £402,260 | 4% |
173 Properties |
| 2024 | £386,687 | -3% |
229 Properties |
| 2023 | £398,578 | -1% |
179 Properties |
| 2022 | £401,099 | 7% |
261 Properties |
| 2021 | £371,032 | 7% |
334 Properties |
| 2020 | £345,696 | 5% |
210 Properties |
| 2019 | £328,456 | -3% |
320 Properties |
| 2018 | £336,931 | 5% |
358 Properties |
| 2017 | £320,521 | 4% |
307 Properties |
| 2016 | £307,666 | 13% |
271 Properties |
| 2015 | £267,156 | 13% |
275 Properties |
| 2014 | £231,343 | 13% |
281 Properties |
| 2013 | £202,184 | 1% |
239 Properties |
| 2012 | £200,009 | 2% |
203 Properties |
| 2011 | £195,896 | -0,5% |
199 Properties |
| 2010 | £196,858 | 7% |
205 Properties |
| 2009 | £182,905 | -14% |
167 Properties |
| 2008 | £207,984 | -3% |
207 Properties |
| 2007 | £214,260 | 10% |
455 Properties |
| 2006 | £192,610 | 4% |
430 Properties |
| 2005 | £183,994 | 3% |
338 Properties |
| 2004 | £178,018 | 9% |
391 Properties |
| 2003 | £162,428 | 17% |
349 Properties |
| 2002 | £135,141 | 18% |
393 Properties |
| 2001 | £110,280 | 8% |
452 Properties |
| 2000 | £100,942 | 16% |
406 Properties |
| 1999 | £85,195 | 6% |
442 Properties |
| 1998 | £80,040 | 15% |
371 Properties |
| 1997 | £67,982 | 12% |
284 Properties |
| 1996 | £60,005 | 1% |
258 Properties |
| 1995 | £59,386 | - |
189 Properties |
Property Price per Property Type in Romford
Here you can find historic sold price data in order to help with your property search.
The average Property Paid Price for specific property types in the last three years are:
| Property Type | Average Sold Price | Sold Properties |
|---|---|---|
| Flat | £233,869.00 | 111 Flats |
| Semi Detached House | £443,100.00 | 123 Semi Detached Houses |
| Detached House | £480,502.00 | 22 Detached Houses |
| Terraced House | £426,018.00 | 325 Terraced Houses |