
Houses for sale & to rent in Borehamwood, Hertfordshire
House Prices in Borehamwood
Properties in Borehamwood have an average house price of £529k and had 1,148 Property Transactions within the last 3 years.¹
Borehamwood is an area in Hertfordshire with 14,790 households², where the most expensive property was sold for £4.13M.
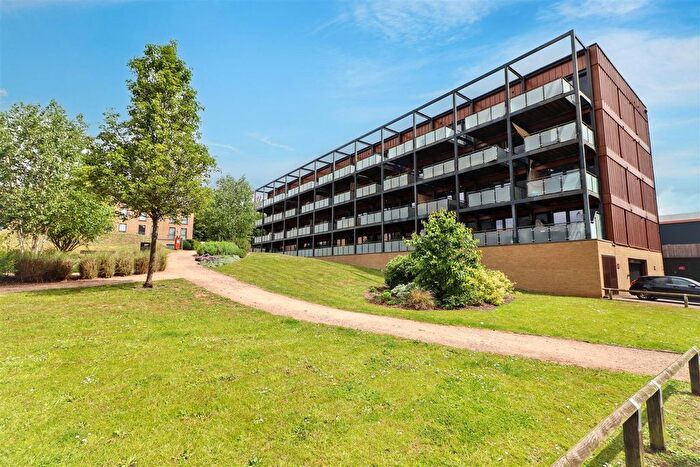
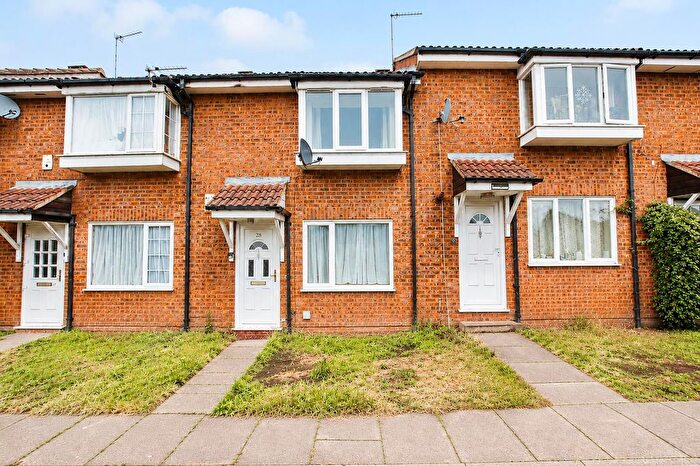
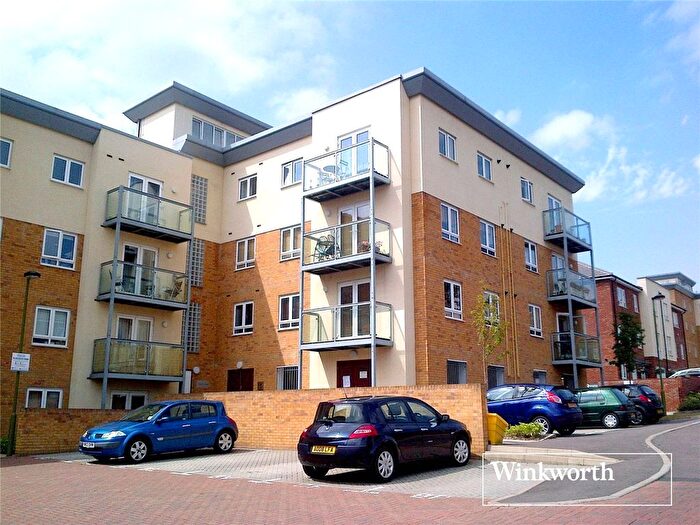
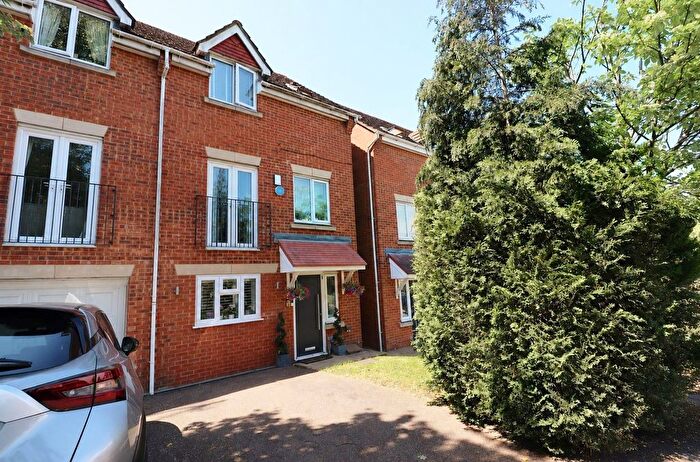
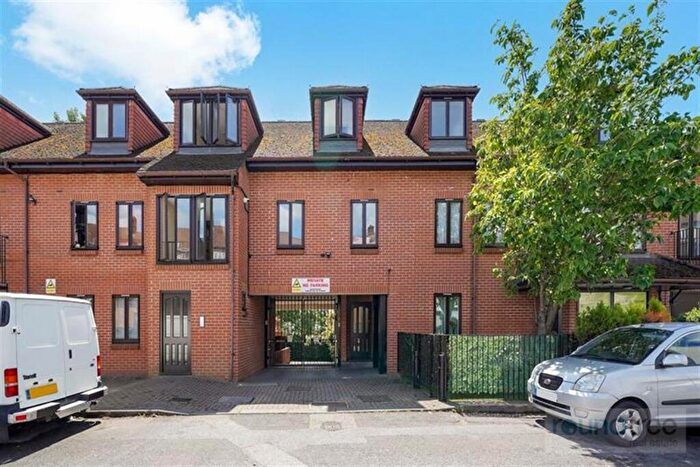
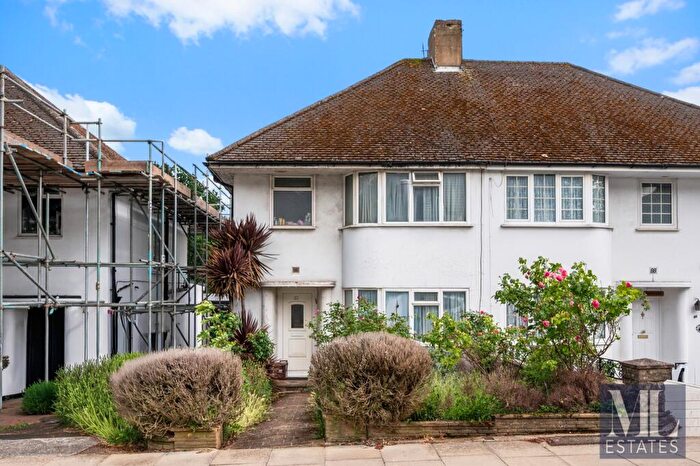
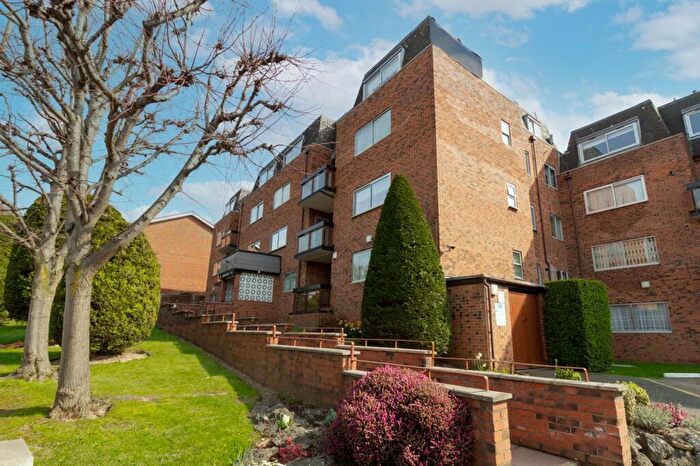
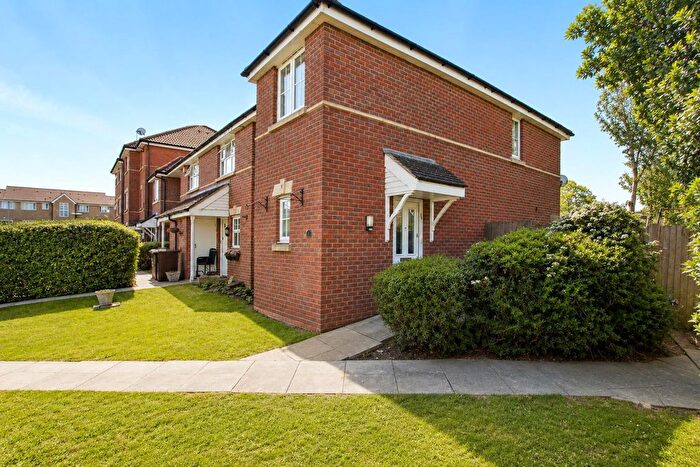
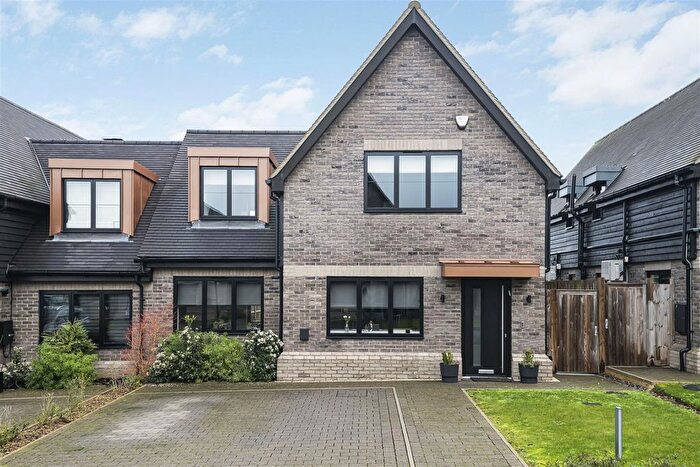
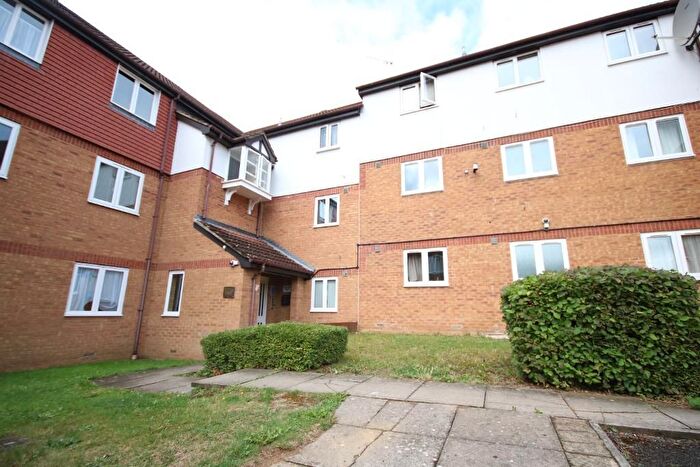
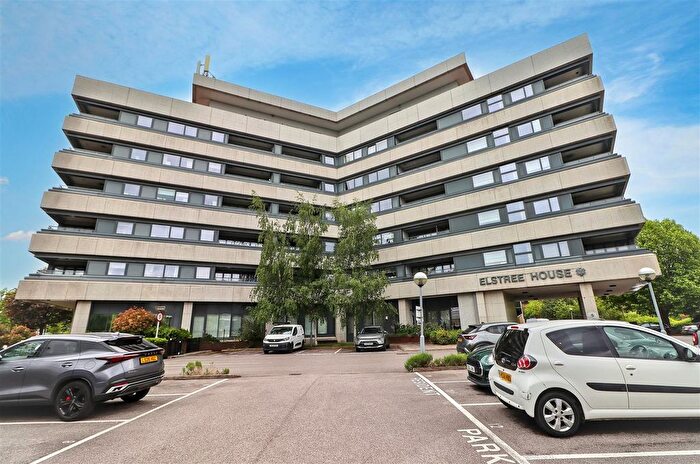
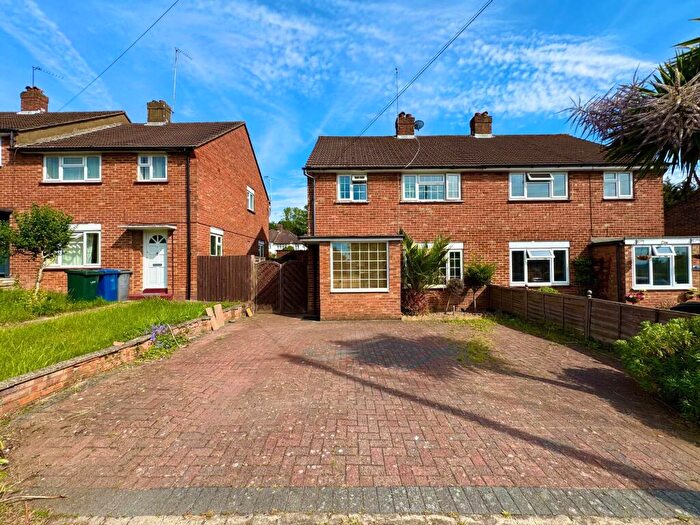
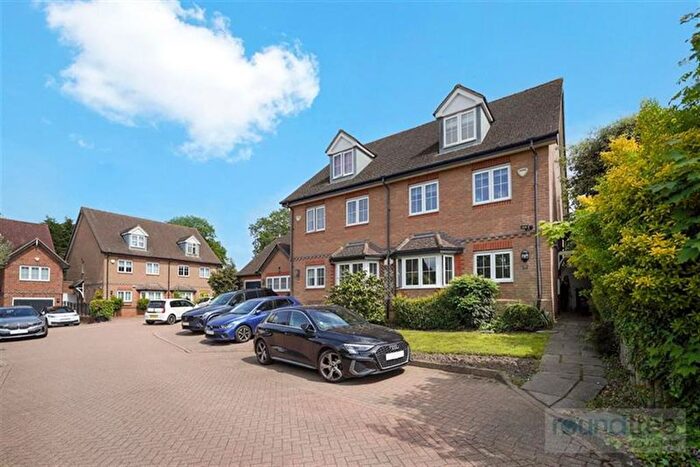
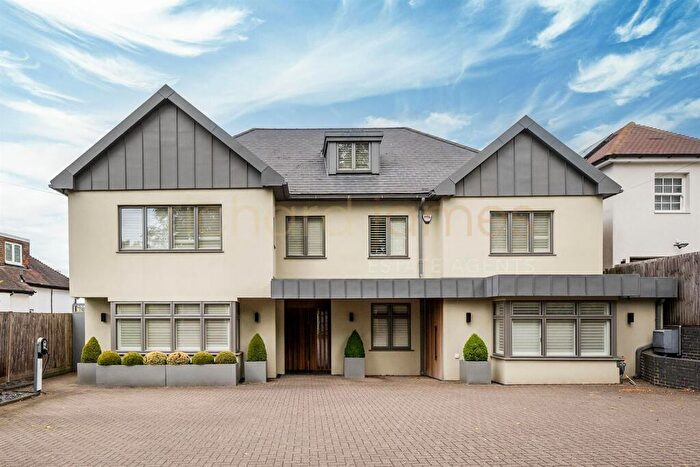
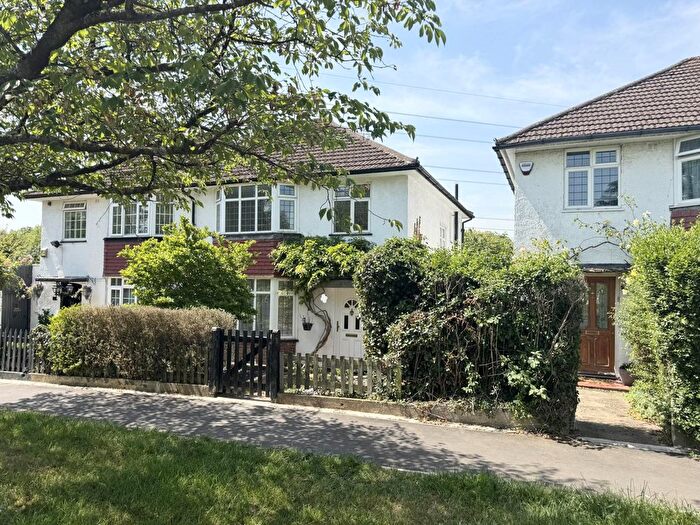
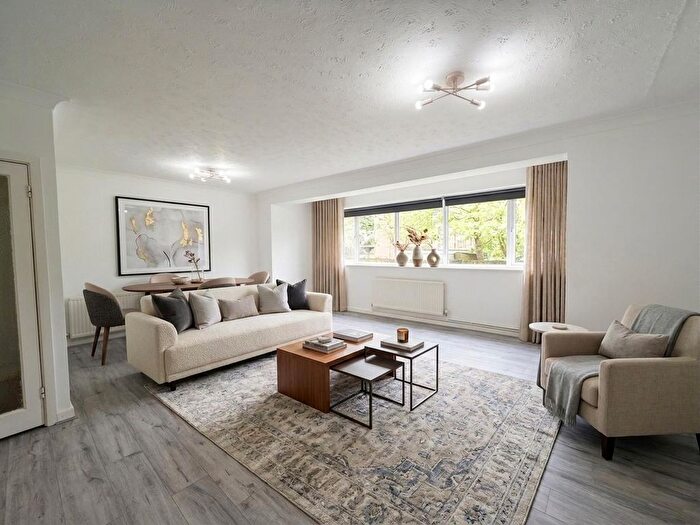
Properties for sale in Borehamwood
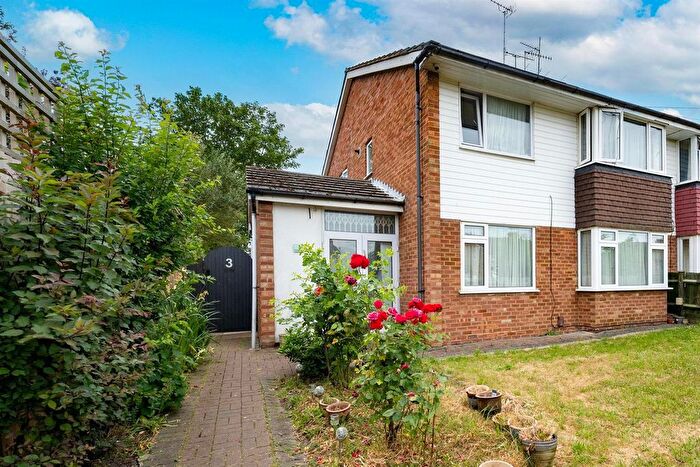
![]()
If you are looking to sell your house, let it out, or receive a property valuation, an expert can help you.
Click the button below to get started.
Neighbourhoods in Borehamwood
Navigate through our locations to find the location of your next house in Borehamwood, Hertfordshire for sale or to rent.
Transport in Borehamwood
Please see below transportation links in this area:


- FAQ
- Price Paid By Year
- Property Type Price
Frequently asked questions about Borehamwood
What is the average price for a property for sale in Borehamwood?
The average price for a property for sale in Borehamwood is £529,312. This amount is 0.63% lower than the average price in Hertfordshire. There are 5,734 property listings for sale in Borehamwood.
What locations have the most expensive properties for sale in Borehamwood?
The locations with the most expensive properties for sale in Borehamwood are Aldenham West at an average of £1,472,500, Elstree at an average of £868,723 and Borehamwood Hillside at an average of £549,095.
What locations have the most affordable properties for sale in Borehamwood?
The locations with the most affordable properties for sale in Borehamwood are Borehamwood Kenilworth at an average of £398,635, Borehamwood Brookmeadow at an average of £448,486 and Borehamwood Cowley Hill at an average of £452,014.
Which train stations are available in or near Borehamwood?
Some of the train stations available in or near Borehamwood are Elstree and Borehamwood and Radlett.
Which tube stations are available in or near Borehamwood?
Some of the tube stations available in or near Borehamwood are Stanmore and Edgware.
Property Price Paid in Borehamwood by Year
The average sold property price by year was:
| Year | Average Sold Price | Price Change |
Sold Properties
|
|---|---|---|---|
| 2026 | £496,869 | -1% |
23 Properties |
| 2025 | £503,056 | -5% |
366 Properties |
| 2024 | £527,728 | -6% |
386 Properties |
| 2023 | £558,715 | -1% |
373 Properties |
| 2022 | £566,019 | 9% |
444 Properties |
| 2021 | £516,558 | 5% |
621 Properties |
| 2020 | £488,865 | 14% |
501 Properties |
| 2019 | £421,034 | 1% |
700 Properties |
| 2018 | £416,896 | -1% |
603 Properties |
| 2017 | £420,476 | -9% |
671 Properties |
| 2016 | £459,480 | 21% |
580 Properties |
| 2015 | £361,982 | 2% |
655 Properties |
| 2014 | £353,154 | 10% |
584 Properties |
| 2013 | £316,731 | 7% |
548 Properties |
| 2012 | £295,975 | -0,1% |
482 Properties |
| 2011 | £296,324 | 1% |
427 Properties |
| 2010 | £292,758 | 12% |
429 Properties |
| 2009 | £257,579 | -1% |
399 Properties |
| 2008 | £259,153 | -8% |
431 Properties |
| 2007 | £280,234 | 9% |
900 Properties |
| 2006 | £254,030 | 7% |
826 Properties |
| 2005 | £236,487 | 2% |
609 Properties |
| 2004 | £231,172 | 9% |
845 Properties |
| 2003 | £209,961 | 9% |
733 Properties |
| 2002 | £190,435 | 18% |
813 Properties |
| 2001 | £156,786 | 8% |
774 Properties |
| 2000 | £144,572 | 15% |
740 Properties |
| 1999 | £123,116 | 5% |
866 Properties |
| 1998 | £117,075 | 20% |
628 Properties |
| 1997 | £93,889 | 6% |
629 Properties |
| 1996 | £88,359 | 3% |
605 Properties |
| 1995 | £85,596 | - |
511 Properties |
Property Price per Property Type in Borehamwood
Here you can find historic sold price data in order to help with your property search.
The average Property Paid Price for specific property types in the last three years are:
| Property Type | Average Sold Price | Sold Properties |
|---|---|---|
| Semi Detached House | £604,627.00 | 284 Semi Detached Houses |
| Detached House | £1,187,928.00 | 91 Detached Houses |
| Terraced House | £480,806.00 | 418 Terraced Houses |
| Flat | £357,346.00 | 355 Flats |