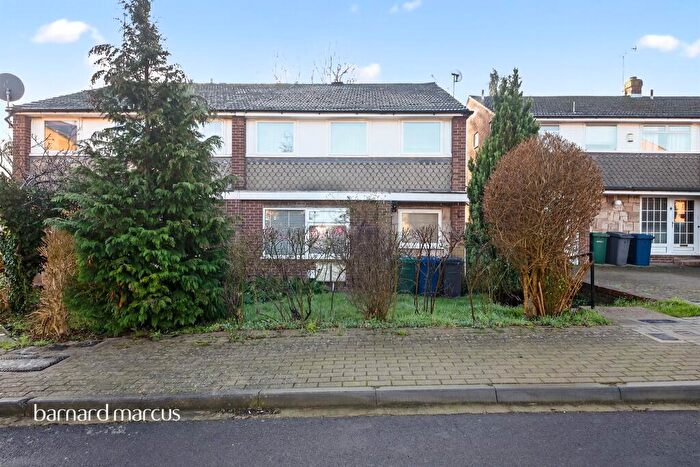
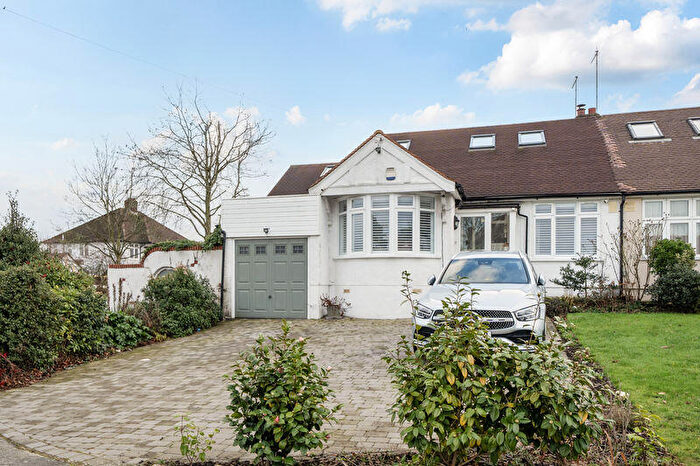
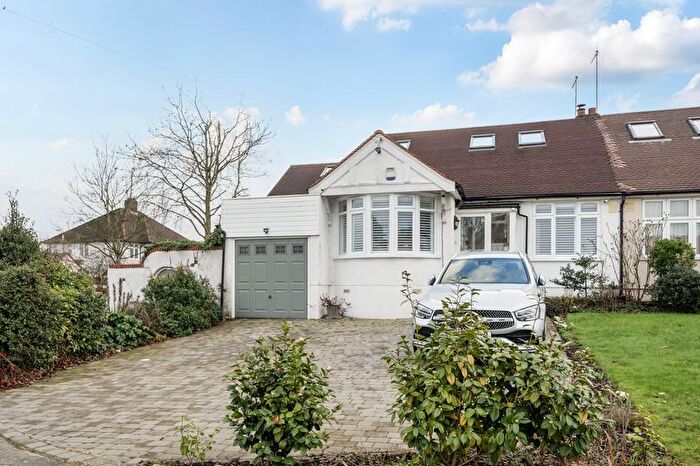
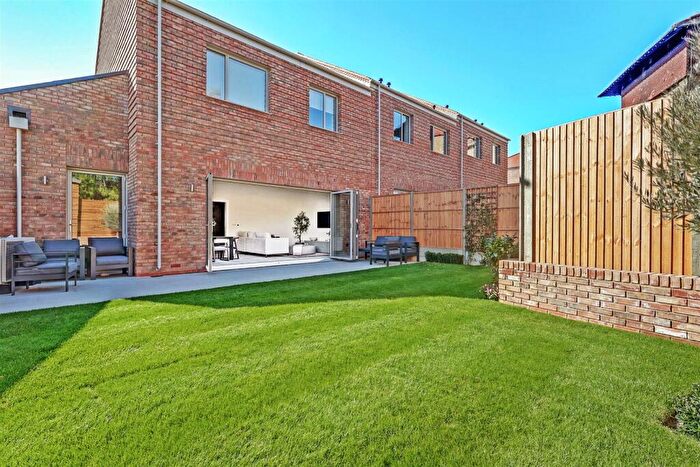
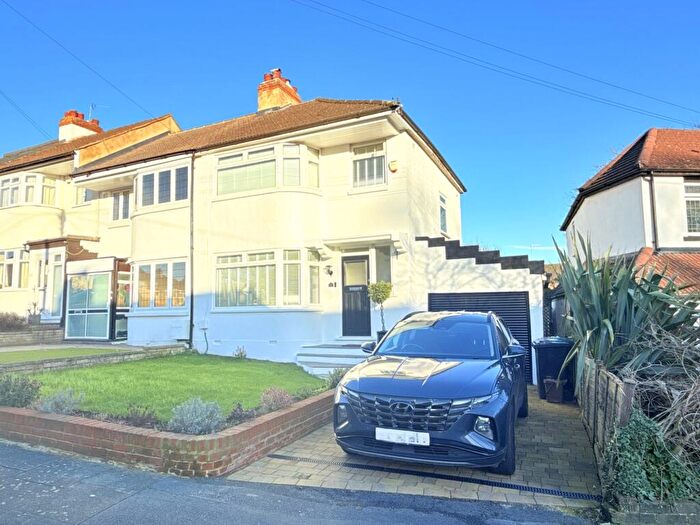
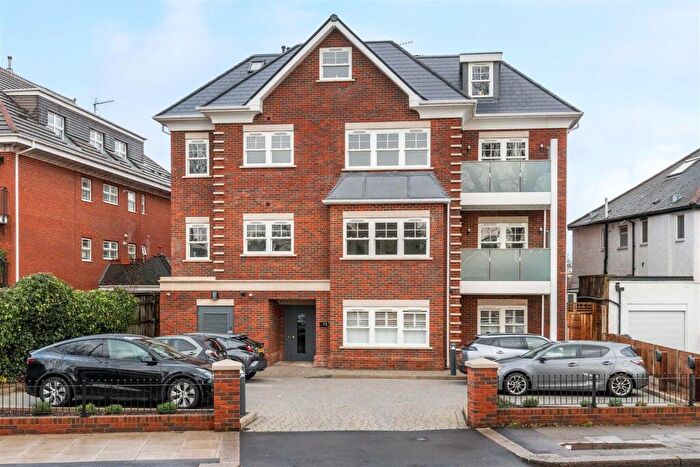
Houses for sale & to rent in Brunswick Park, Barnet
House Prices in Brunswick Park
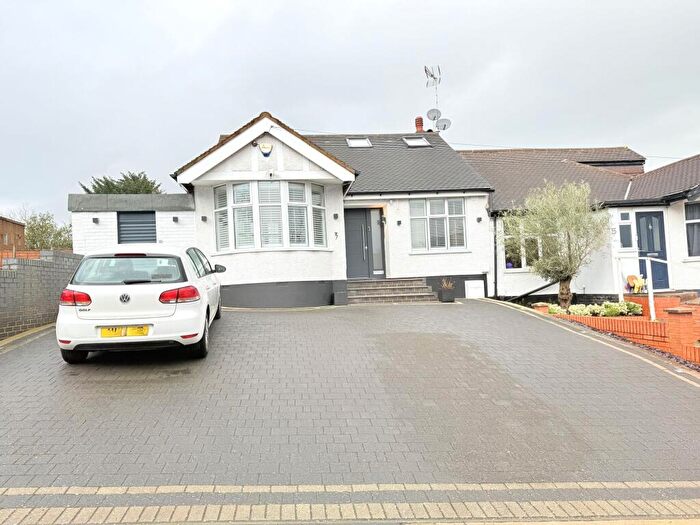
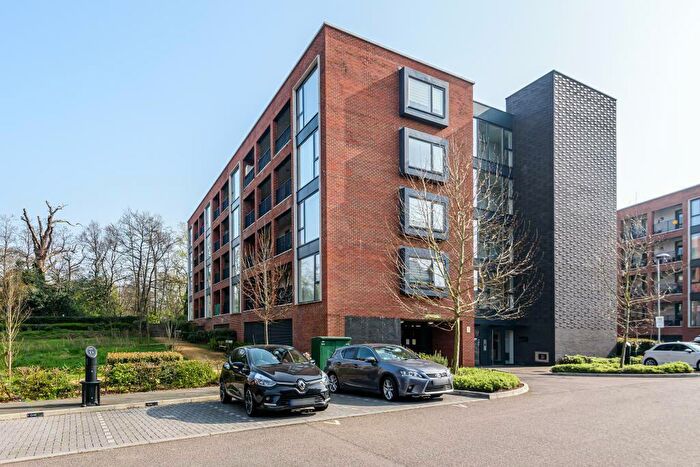
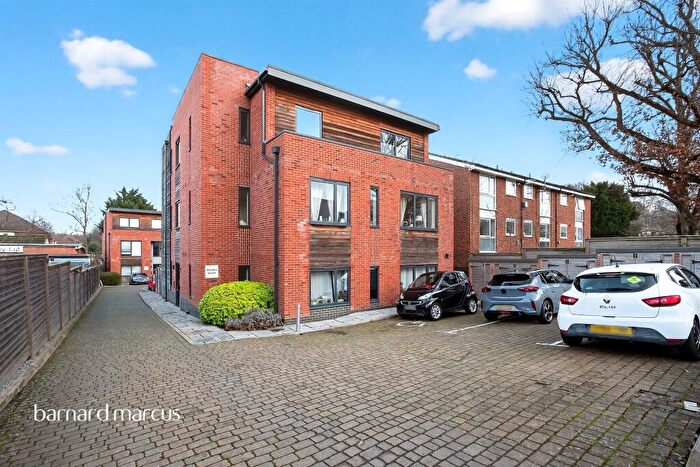
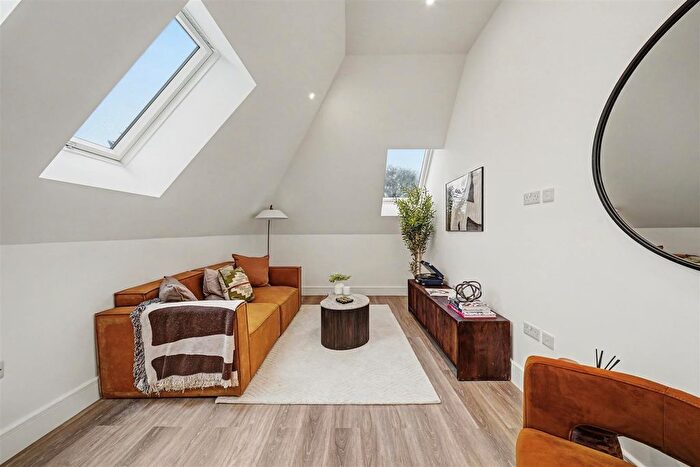
Properties in this part of Brunswick Park within Barnet have an average house price of £619,403.00 and had 117 Property Transactions within the last 3 years¹. This area has 1,347 households² , where the most expensive property was sold for £900,000.00.
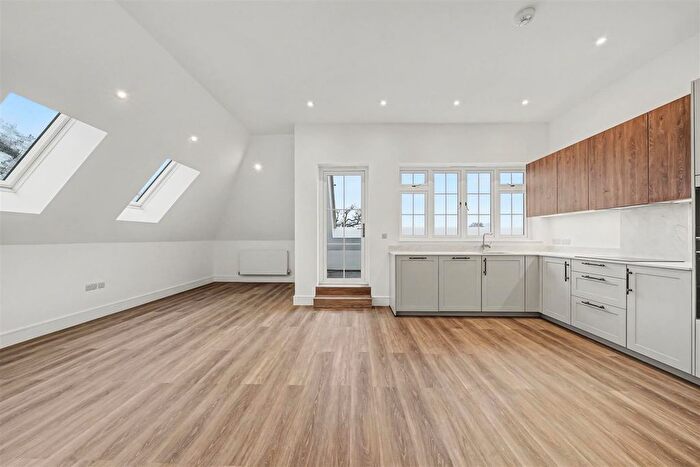
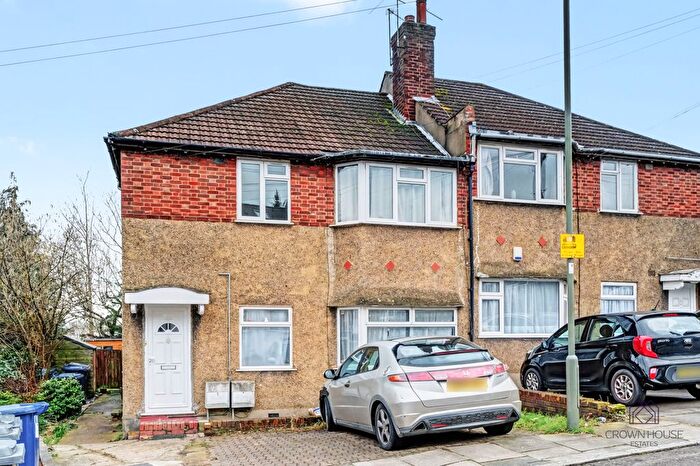
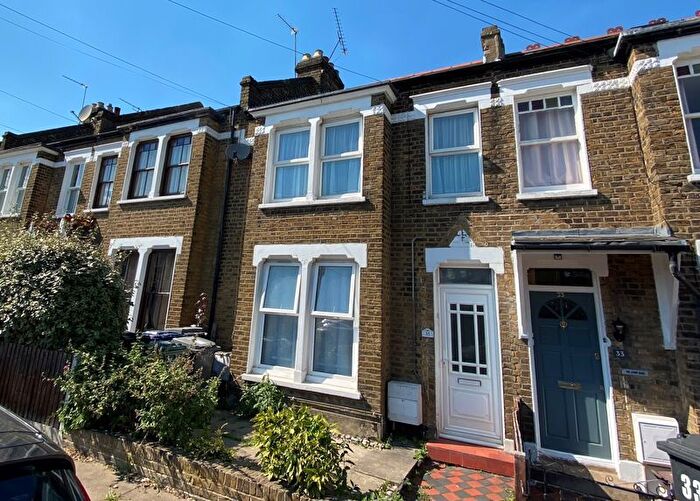
Properties for sale in Brunswick Park
Roads and Postcodes in Brunswick Park
Navigate through our locations to find the location of your next house in Brunswick Park, Barnet for sale or to rent.
| Streets | Postcodes |
|---|---|
| Accommodation Road | EN4 8FT |
| Avondale Avenue | EN4 8LT EN4 8NA EN4 8NB EN4 8ND |
| Brookside South | EN4 8LH EN4 8LJ EN4 8LL EN4 8LN EN4 8LW |
| Burlington Rise | EN4 8NH EN4 8NN |
| Cambridge Close | EN4 8RA |
| Chetwynd Avenue | EN4 8NG |
| Church Hill Road | EN4 8PG EN4 8PH EN4 8PP EN4 8PQ EN4 8XD EN4 8XE |
| Connaught Avenue | EN4 8PJ EN4 8PN |
| Derwent Avenue | EN4 8LU EN4 8LX EN4 8LY EN4 8LZ |
| East Walk | EN4 8JT EN4 8JU EN4 8JX |
| Ferney Road | EN4 8LA EN4 8LB EN4 8LE EN4 8LF |
| Gallants Farm Road | EN4 8ER EN4 8ES EN4 8ET |
| Gillum Close | EN4 8NE |
| Grange Avenue | EN4 8NJ EN4 8NL |
| Haslemere Avenue | EN4 8EU EN4 8EY EN4 8EZ |
| Hereford Avenue | EN4 8EX |
| Lancelot Gardens | EN4 8JY |
| Mallory Gardens | EN4 8LG |
| Myrtle Close | EN4 8PL |
| Parkside Gardens | EN4 8JP EN4 8JR EN4 8JS |
| Uplands Road | EN4 8LD EN4 8NY |
| West Walk | EN4 8NT EN4 8NU EN4 8NX |
| Woodfield Drive | EN4 8PA EN4 8PB EN4 8PD EN4 8PE |
Transport near Brunswick Park
-
Oakleigh Park Station
-
Southgate Station
-
Totteridge and Whetstone Station
-
Cockfosters Station
-
Oakwood Station
-
New Barnet Station
-
New Southgate Station
-
Arnos Grove Station
-
Woodside Park Station
-
Palmers Green Station
- FAQ
- Price Paid By Year
- Property Type Price
Frequently asked questions about Brunswick Park
What is the average price for a property for sale in Brunswick Park?
The average price for a property for sale in Brunswick Park is £619,403. This amount is 3% higher than the average price in Barnet. There are 1,341 property listings for sale in Brunswick Park.
What streets have the most expensive properties for sale in Brunswick Park?
The streets with the most expensive properties for sale in Brunswick Park are Uplands Road at an average of £753,750, Gallants Farm Road at an average of £752,600 and Haslemere Avenue at an average of £750,062.
What streets have the most affordable properties for sale in Brunswick Park?
The streets with the most affordable properties for sale in Brunswick Park are Cambridge Close at an average of £262,250, Avondale Avenue at an average of £417,285 and Grange Avenue at an average of £532,311.
Which train stations are available in or near Brunswick Park?
Some of the train stations available in or near Brunswick Park are Oakleigh Park, New Barnet and New Southgate.
Which tube stations are available in or near Brunswick Park?
Some of the tube stations available in or near Brunswick Park are Southgate, Totteridge and Whetstone and Cockfosters.
Property Price Paid in Brunswick Park by Year
The average sold property price by year was:
| Year | Average Sold Price | Price Change |
Sold Properties
|
|---|---|---|---|
| 2025 | £628,161 | 2% |
34 Properties |
| 2024 | £615,709 | - |
51 Properties |
| 2023 | £615,984 | 1% |
32 Properties |
| 2022 | £607,214 | 5% |
37 Properties |
| 2021 | £577,988 | 2% |
76 Properties |
| 2020 | £568,727 | 7% |
33 Properties |
| 2019 | £529,765 | -6% |
32 Properties |
| 2018 | £559,034 | -3% |
32 Properties |
| 2017 | £576,797 | 10% |
51 Properties |
| 2016 | £517,227 | 6% |
37 Properties |
| 2015 | £483,719 | 12% |
52 Properties |
| 2014 | £427,096 | 12% |
44 Properties |
| 2013 | £377,407 | 3% |
56 Properties |
| 2012 | £366,505 | 8% |
35 Properties |
| 2011 | £337,277 | 3% |
44 Properties |
| 2010 | £326,405 | 8% |
48 Properties |
| 2009 | £300,318 | -13% |
36 Properties |
| 2008 | £338,062 | 6% |
24 Properties |
| 2007 | £317,223 | 8% |
92 Properties |
| 2006 | £292,369 | 8% |
86 Properties |
| 2005 | £269,324 | -4% |
37 Properties |
| 2004 | £280,626 | 12% |
62 Properties |
| 2003 | £245,883 | 12% |
50 Properties |
| 2002 | £216,944 | 11% |
75 Properties |
| 2001 | £193,976 | 15% |
60 Properties |
| 2000 | £164,685 | 16% |
45 Properties |
| 1999 | £138,618 | 15% |
71 Properties |
| 1998 | £117,801 | 11% |
44 Properties |
| 1997 | £105,366 | 10% |
65 Properties |
| 1996 | £95,129 | 12% |
72 Properties |
| 1995 | £83,828 | - |
51 Properties |
Property Price per Property Type in Brunswick Park
Here you can find historic sold price data in order to help with your property search.
The average Property Paid Price for specific property types in the last three years are:
| Property Type | Average Sold Price | Sold Properties |
|---|---|---|
| Semi Detached House | £673,249.00 | 40 Semi Detached Houses |
| Terraced House | £632,593.00 | 66 Terraced Houses |
| Flat | £300,400.00 | 10 Flats |
| Detached House | £785,000.00 | 1 Detached House |

