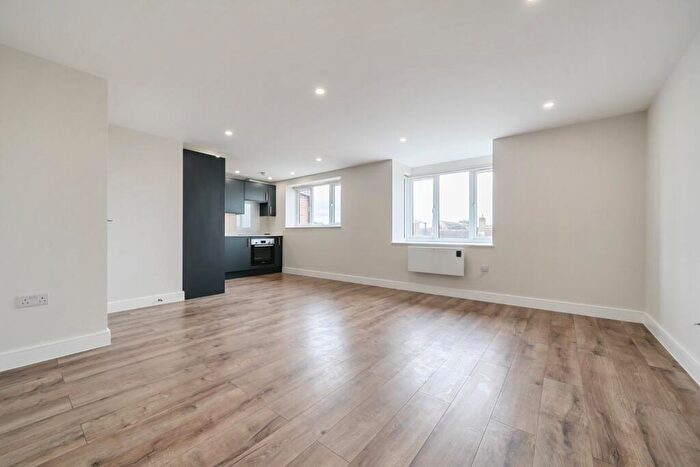
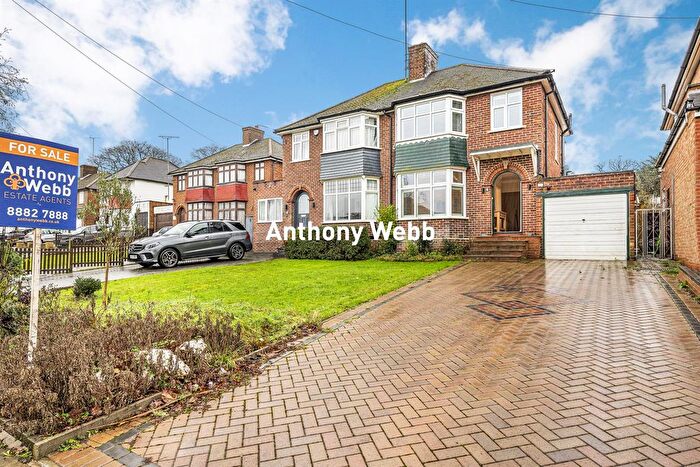
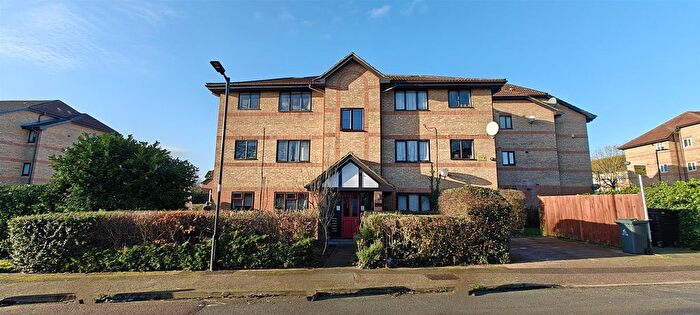
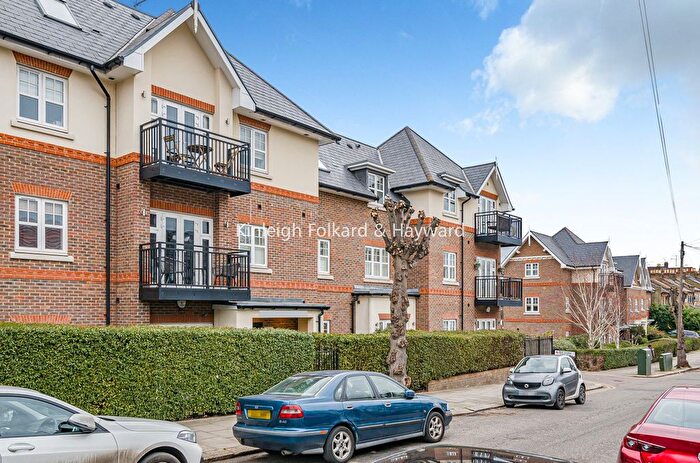
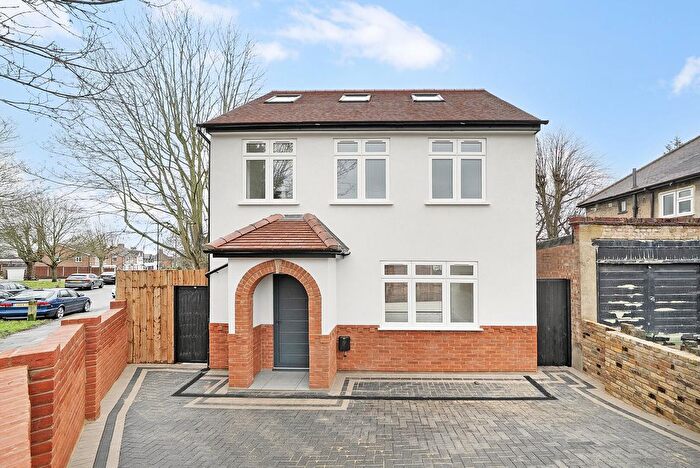
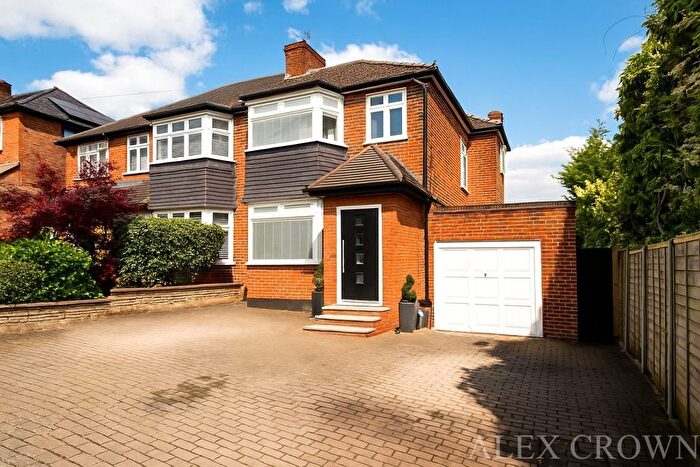
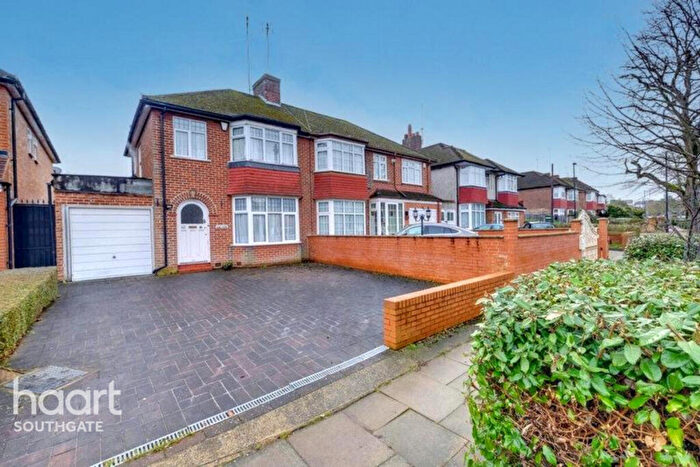
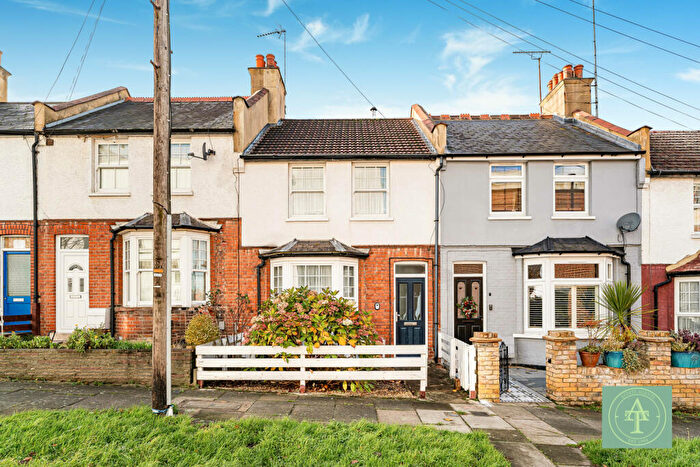
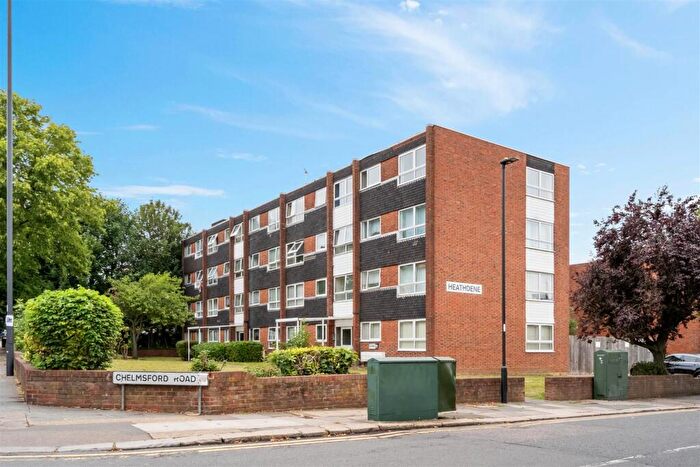
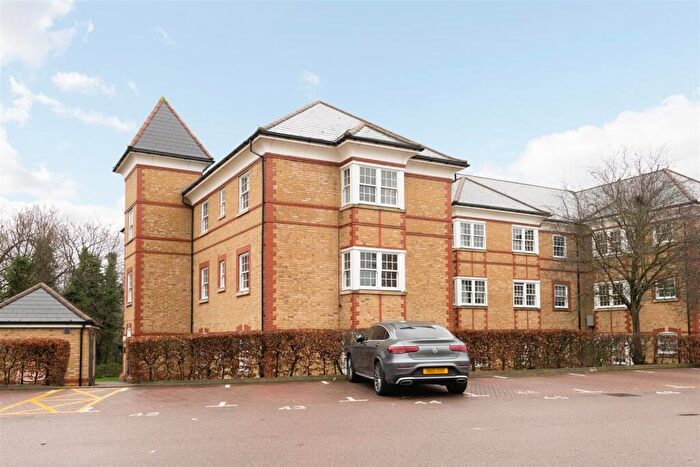
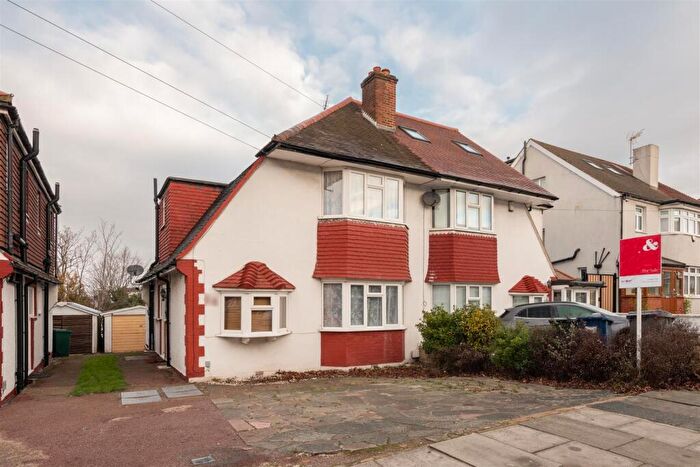
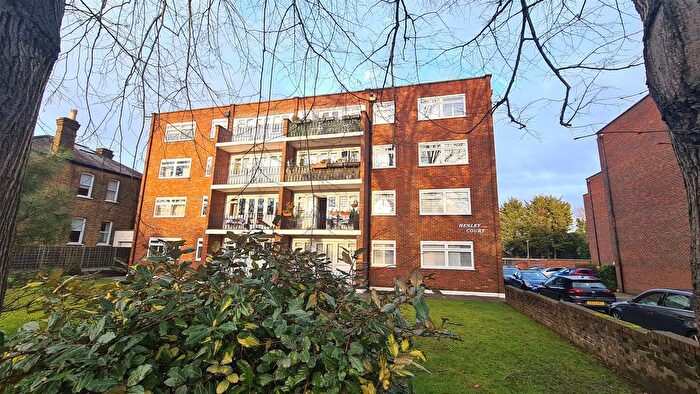
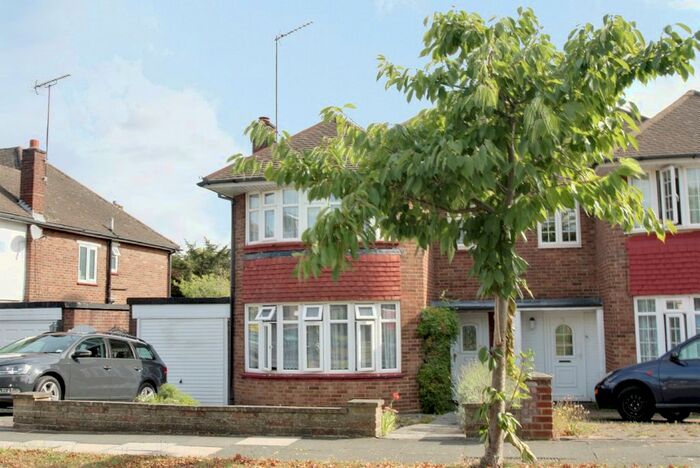
Houses for sale & to rent in Southgate, London
House Prices in Southgate
Properties in this part of Southgate within London have an average house price of £553,308.00 and had 393 Property Transactions within the last 3 years¹. This area has 5,898 households² , where the most expensive property was sold for £2,599,995.00.
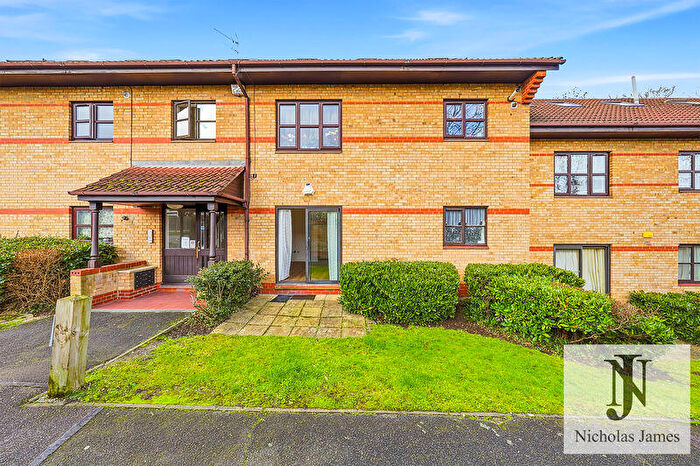
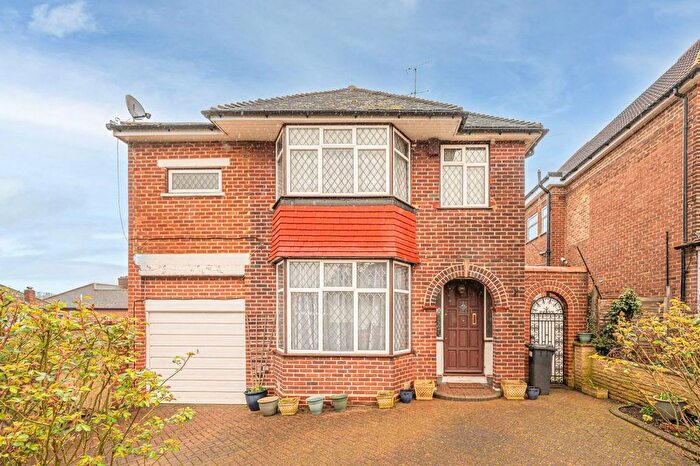
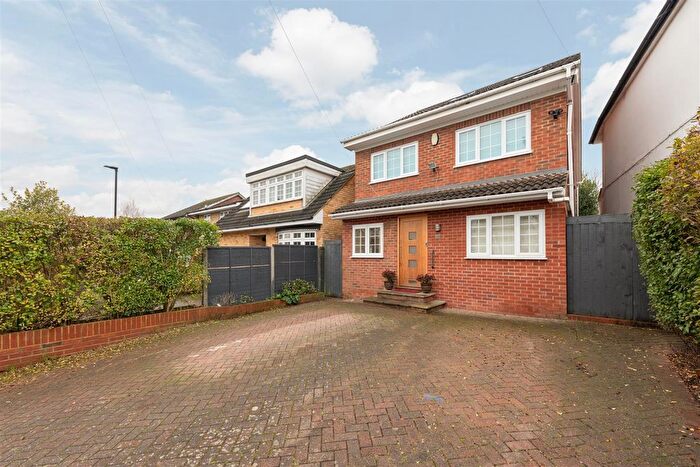
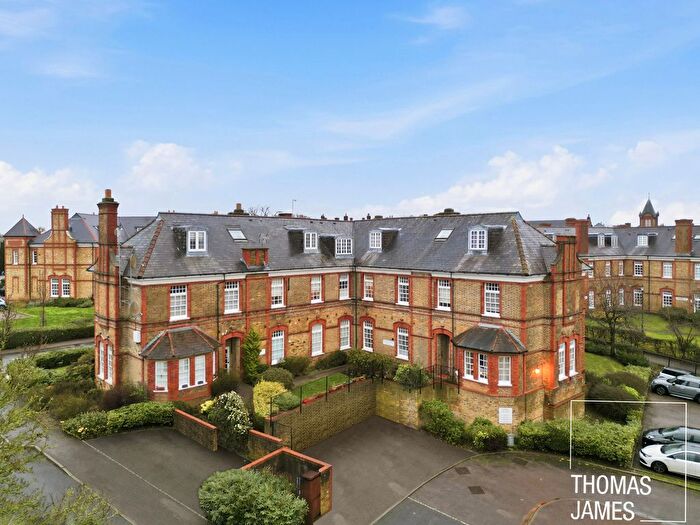
Properties for sale in Southgate
Roads and Postcodes in Southgate
Navigate through our locations to find the location of your next house in Southgate, London for sale or to rent.
Transport near Southgate
-
Southgate Station
-
Oakwood Station
-
Winchmore Hill Station
-
Grange Park Station
-
Palmers Green Station
-
Arnos Grove Station
-
Cockfosters Station
-
New Southgate Station
-
Oakleigh Park Station
-
Enfield Chase Station
- FAQ
- Price Paid By Year
- Property Type Price
Frequently asked questions about Southgate
What is the average price for a property for sale in Southgate?
The average price for a property for sale in Southgate is £553,308. This amount is 4% higher than the average price in London. There are 1,909 property listings for sale in Southgate.
What streets have the most expensive properties for sale in Southgate?
The streets with the most expensive properties for sale in Southgate are Bourne Avenue at an average of £1,693,998, Meadway at an average of £1,396,750 and Merrivale at an average of £1,385,000.
What streets have the most affordable properties for sale in Southgate?
The streets with the most affordable properties for sale in Southgate are Dalrymple Close at an average of £277,857, Isabella Close at an average of £306,250 and Pennington Drive at an average of £307,569.
Which train stations are available in or near Southgate?
Some of the train stations available in or near Southgate are Winchmore Hill, Grange Park and Palmers Green.
Which tube stations are available in or near Southgate?
Some of the tube stations available in or near Southgate are Southgate, Oakwood and Arnos Grove.
Property Price Paid in Southgate by Year
The average sold property price by year was:
| Year | Average Sold Price | Price Change |
Sold Properties
|
|---|---|---|---|
| 2025 | £576,119 | 7% |
107 Properties |
| 2024 | £533,238 | -4% |
142 Properties |
| 2023 | £556,151 | -1% |
144 Properties |
| 2022 | £562,037 | -13% |
195 Properties |
| 2021 | £636,643 | 12% |
227 Properties |
| 2020 | £562,796 | 9% |
129 Properties |
| 2019 | £510,290 | 3% |
153 Properties |
| 2018 | £493,041 | -0,1% |
123 Properties |
| 2017 | £493,423 | -2% |
152 Properties |
| 2016 | £502,982 | 12% |
187 Properties |
| 2015 | £440,681 | 9% |
212 Properties |
| 2014 | £400,675 | 12% |
192 Properties |
| 2013 | £350,944 | 3% |
236 Properties |
| 2012 | £339,758 | 10% |
171 Properties |
| 2011 | £304,512 | -3% |
179 Properties |
| 2010 | £312,641 | 13% |
211 Properties |
| 2009 | £270,876 | -15% |
163 Properties |
| 2008 | £310,833 | 6% |
163 Properties |
| 2007 | £292,999 | 8% |
410 Properties |
| 2006 | £269,577 | -0,3% |
362 Properties |
| 2005 | £270,314 | 5% |
307 Properties |
| 2004 | £256,956 | 8% |
310 Properties |
| 2003 | £235,544 | 11% |
313 Properties |
| 2002 | £209,884 | 12% |
387 Properties |
| 2001 | £183,954 | 6% |
411 Properties |
| 2000 | £173,278 | 21% |
302 Properties |
| 1999 | £136,645 | 13% |
410 Properties |
| 1998 | £119,471 | 3% |
451 Properties |
| 1997 | £116,321 | 10% |
470 Properties |
| 1996 | £104,437 | 8% |
401 Properties |
| 1995 | £96,378 | - |
326 Properties |
Property Price per Property Type in Southgate
Here you can find historic sold price data in order to help with your property search.
The average Property Paid Price for specific property types in the last three years are:
| Property Type | Average Sold Price | Sold Properties |
|---|---|---|
| Semi Detached House | £822,174.00 | 109 Semi Detached Houses |
| Detached House | £1,150,624.00 | 20 Detached Houses |
| Terraced House | £564,250.00 | 52 Terraced Houses |
| Flat | £356,036.00 | 212 Flats |

