
Houses for sale & to rent in Finchley Church End, London
House Prices in Finchley Church End
Properties in this part of Finchley Church End within London have an average house price of £858,339.00 and had 648 Property Transactions within the last 3 years¹. This area has 6,286 households² , where the most expensive property was sold for £4,400,000.00.
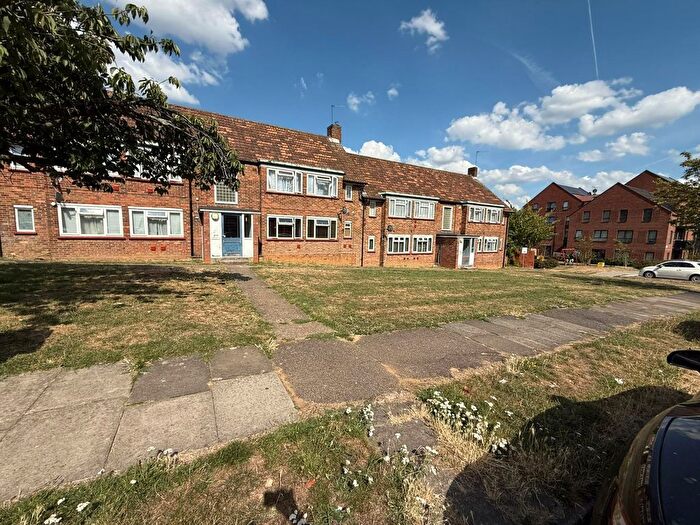
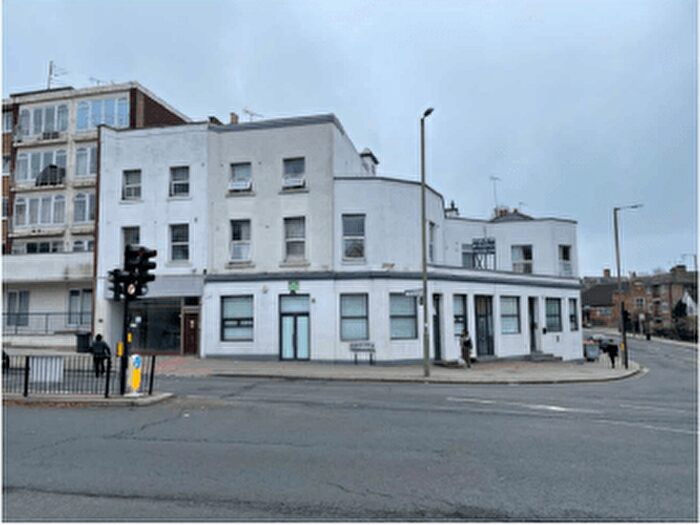
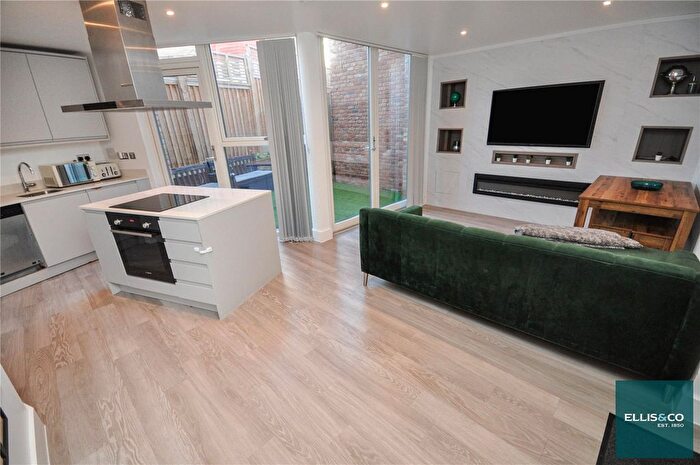
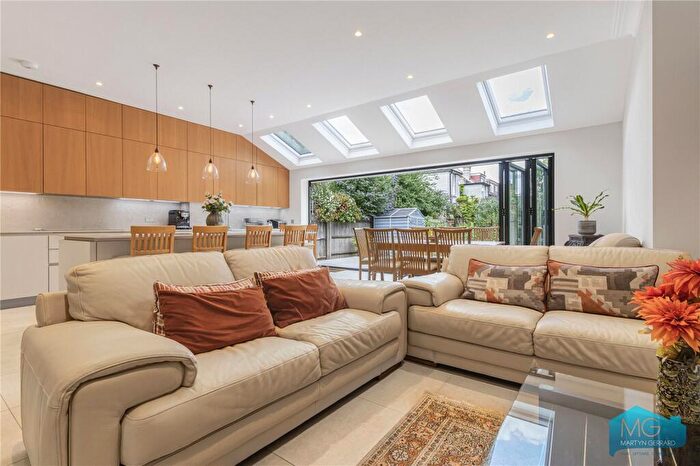
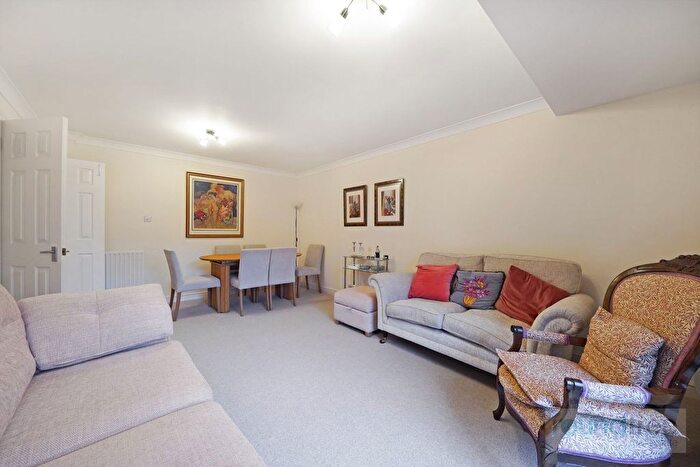
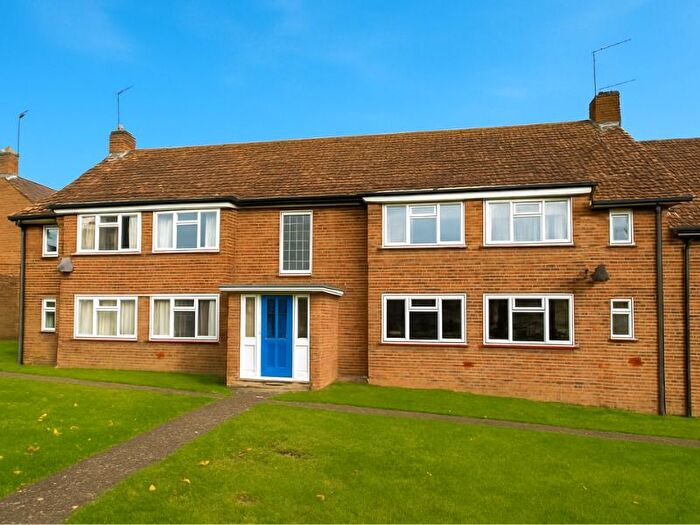
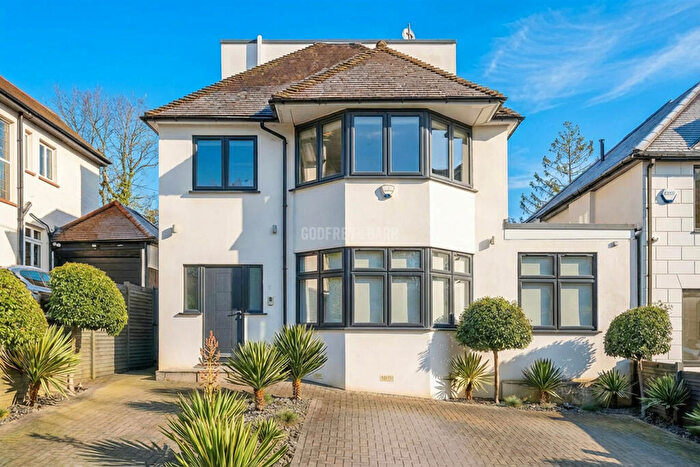
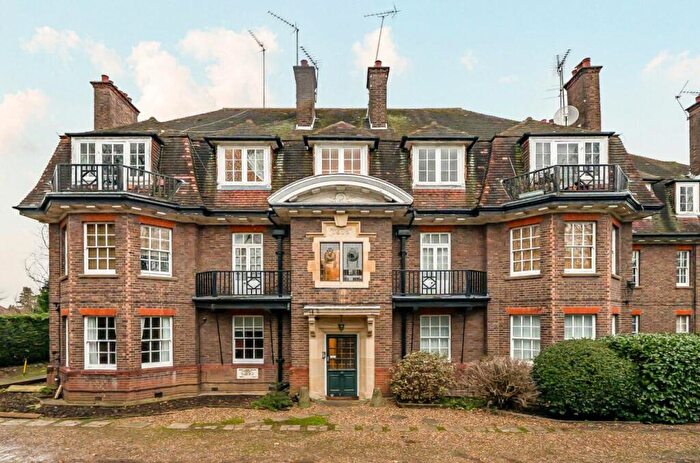
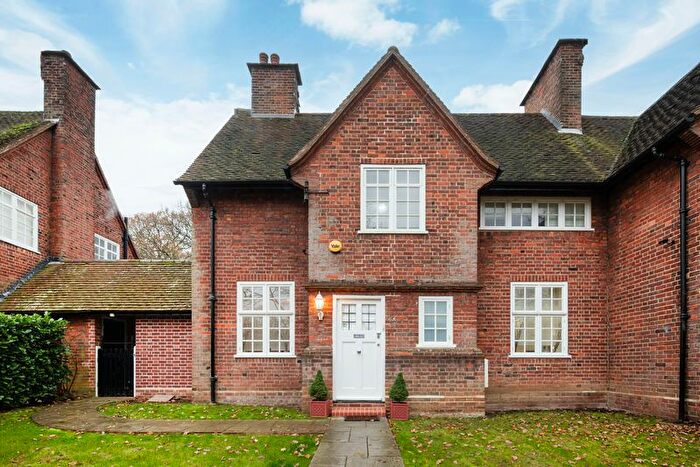
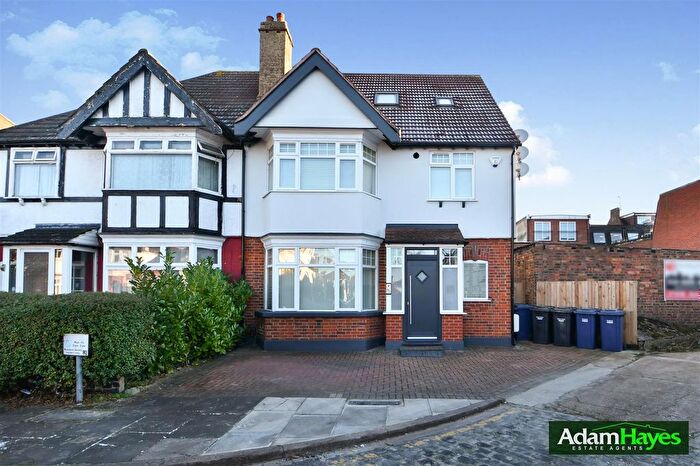
Properties for sale in Finchley Church End
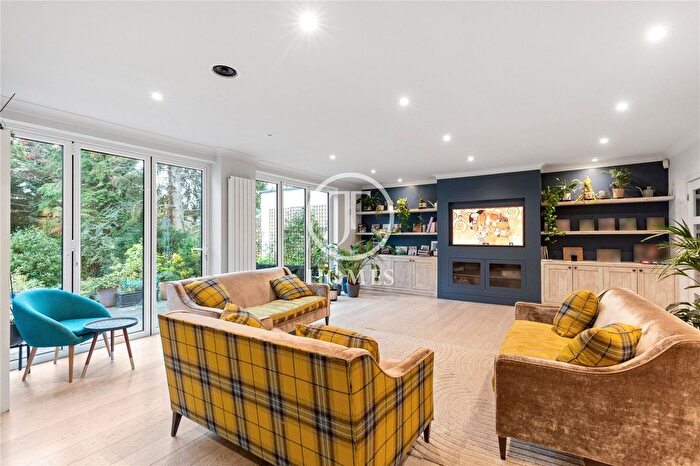

![]()
If you are looking to sell your house, let it out, or receive a property valuation, an expert can help you.
Click the button below to get started.

Roads and Postcodes in Finchley Church End
Navigate through our locations to find the location of your next house in Finchley Church End, London for sale or to rent.
Transport near Finchley Church End
-
 Finchley Central Station
 -
Mill Hill East Station
-
West Finchley Station
-
Hendon Central Station
-
Brent Cross Station
-
Woodside Park Station
-
East Finchley Station
-
Golders Green Station
-
 Hendon Station
 -
Colindale Station
- FAQ
- Price Paid By Year
- Property Type Price
Frequently asked questions about Finchley Church End
What is the average price for a property for sale in Finchley Church End?
The average price for a property for sale in Finchley Church End is £858,339. This amount is 6% higher than the average price in London. There are 3,266 property listings for sale in Finchley Church End.
What streets have the most expensive properties for sale in Finchley Church End?
The streets with the most expensive properties for sale in Finchley Church End are Grass Park at an average of £2,950,000, Hendon Avenue at an average of £2,270,166 and Chessington Avenue at an average of £2,160,000.
What streets have the most affordable properties for sale in Finchley Church End?
The streets with the most affordable properties for sale in Finchley Church End are Great North Way at an average of £324,450, St Michaels Close at an average of £333,666 and Basing Way at an average of £345,125.
Which train stations are available in or near Finchley Church End?
The train station available in or near Finchley Church End is Hendon.
Which tube stations are available in or near Finchley Church End?
Some of the tube stations available in or near Finchley Church End are Finchley Central, Mill Hill East and West Finchley.
Property Price Paid in Finchley Church End by Year
The average sold property price by year was:
| Year | Average Sold Price | Price Change |
Sold Properties
|
|---|---|---|---|
| 2025 | £817,297 | -0,3% |
115 Properties |
| 2024 | £820,110 | -3% |
154 Properties |
| 2023 | £848,657 | -8% |
158 Properties |
| 2022 | £913,257 | 9% |
221 Properties |
| 2021 | £835,458 | 5% |
246 Properties |
| 2020 | £797,143 | 10% |
168 Properties |
| 2019 | £718,098 | -7% |
168 Properties |
| 2018 | £771,282 | 9% |
165 Properties |
| 2017 | £699,066 | 4% |
264 Properties |
| 2016 | £668,157 | -10% |
247 Properties |
| 2015 | £733,350 | 6% |
284 Properties |
| 2014 | £692,403 | 9% |
261 Properties |
| 2013 | £627,679 | 13% |
200 Properties |
| 2012 | £543,671 | 1% |
189 Properties |
| 2011 | £538,813 | -3% |
182 Properties |
| 2010 | £552,307 | 15% |
218 Properties |
| 2009 | £467,654 | -1% |
156 Properties |
| 2008 | £474,562 | -1% |
141 Properties |
| 2007 | £481,032 | 17% |
373 Properties |
| 2006 | £401,406 | 5% |
390 Properties |
| 2005 | £379,795 | 2% |
251 Properties |
| 2004 | £371,682 | 6% |
302 Properties |
| 2003 | £348,334 | 7% |
261 Properties |
| 2002 | £323,369 | 13% |
366 Properties |
| 2001 | £280,940 | 16% |
325 Properties |
| 2000 | £235,229 | 10% |
298 Properties |
| 1999 | £211,425 | 17% |
355 Properties |
| 1998 | £175,678 | 5% |
308 Properties |
| 1997 | £166,996 | 16% |
357 Properties |
| 1996 | £140,441 | -1% |
308 Properties |
| 1995 | £141,916 | - |
260 Properties |
Property Price per Property Type in Finchley Church End
Here you can find historic sold price data in order to help with your property search.
The average Property Paid Price for specific property types in the last three years are:
| Property Type | Average Sold Price | Sold Properties |
|---|---|---|
| Semi Detached House | £1,092,131.00 | 175 Semi Detached Houses |
| Detached House | £1,856,448.00 | 78 Detached Houses |
| Terraced House | £769,336.00 | 39 Terraced Houses |
| Flat | £534,477.00 | 356 Flats |