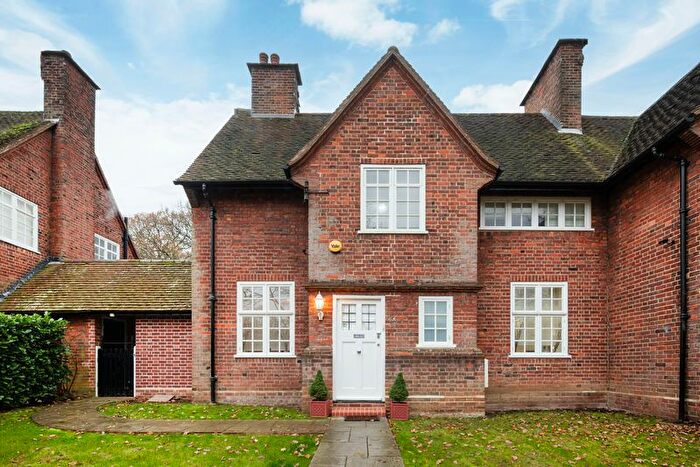
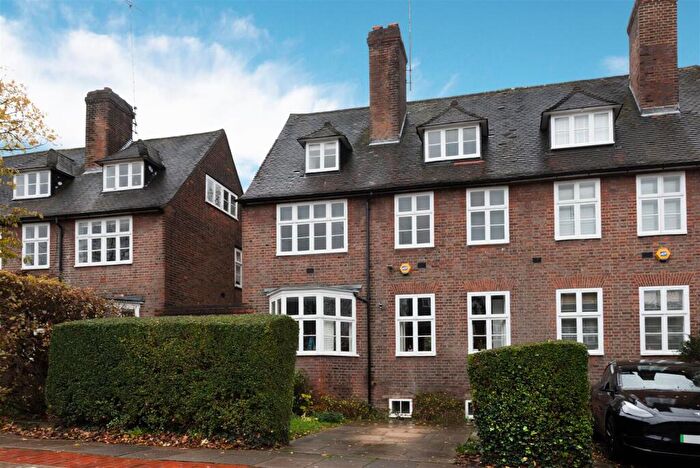
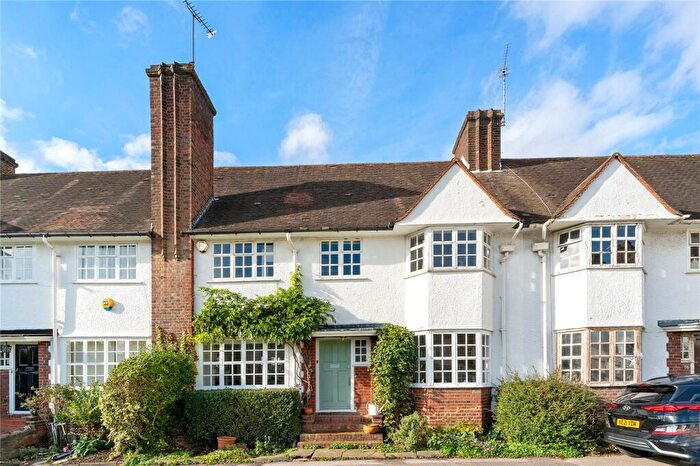
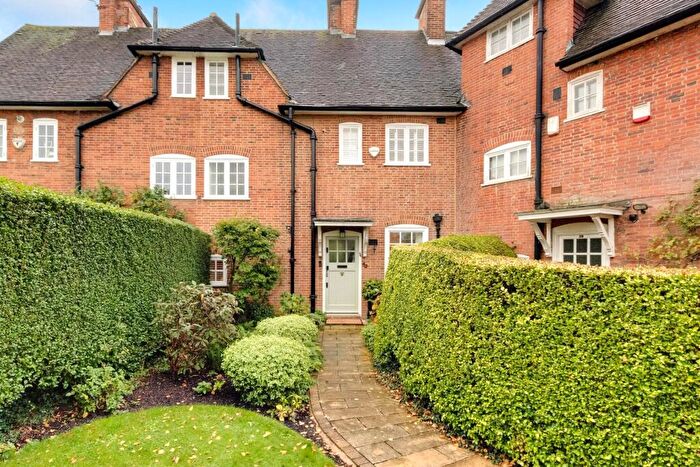
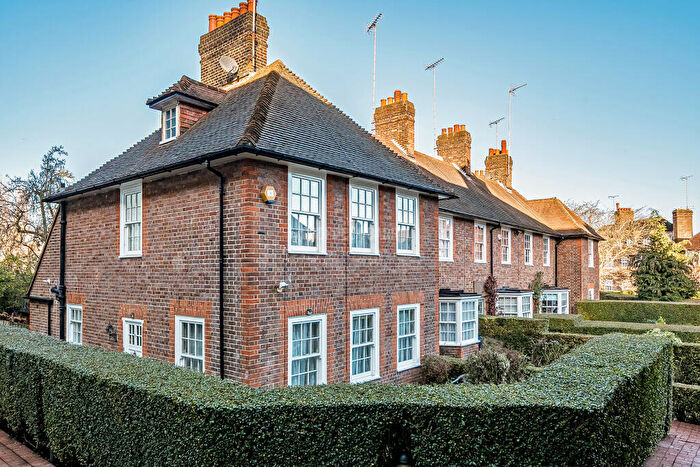
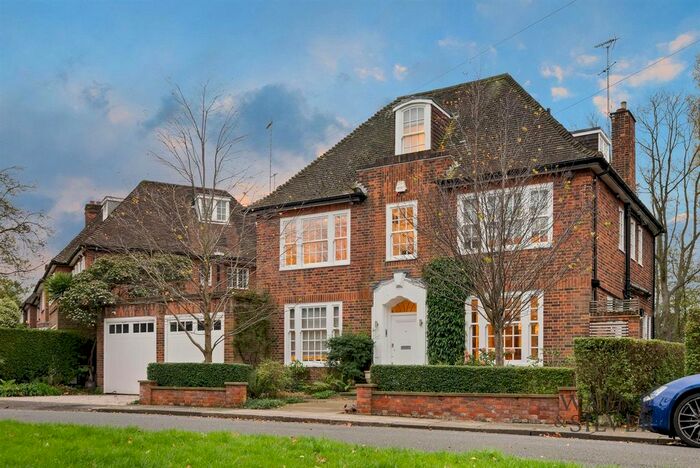
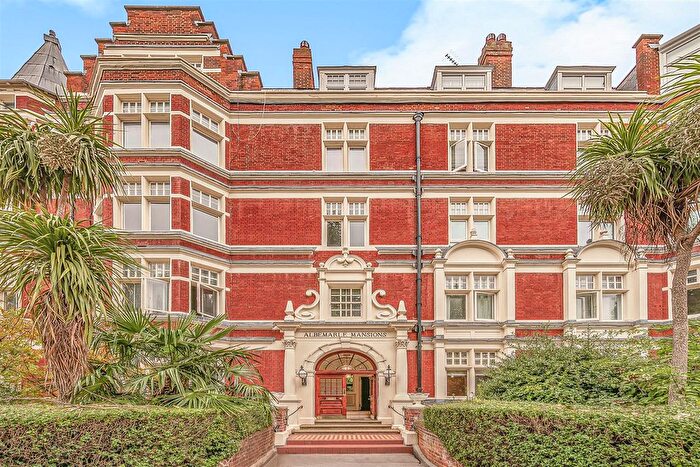
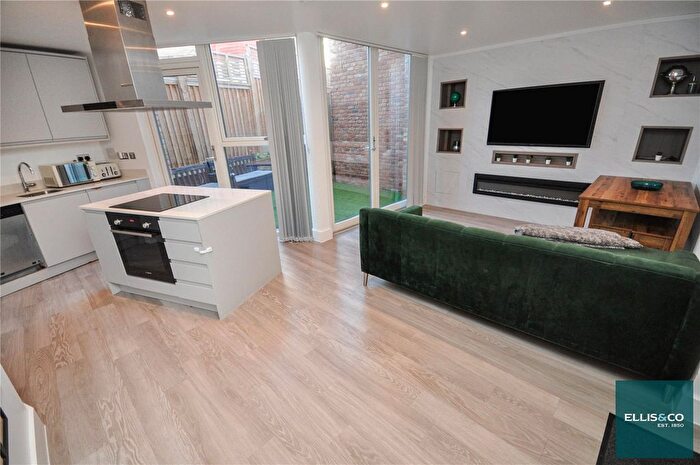
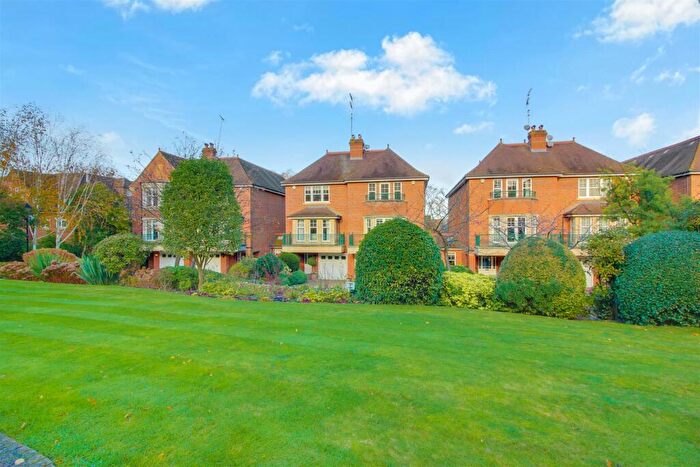
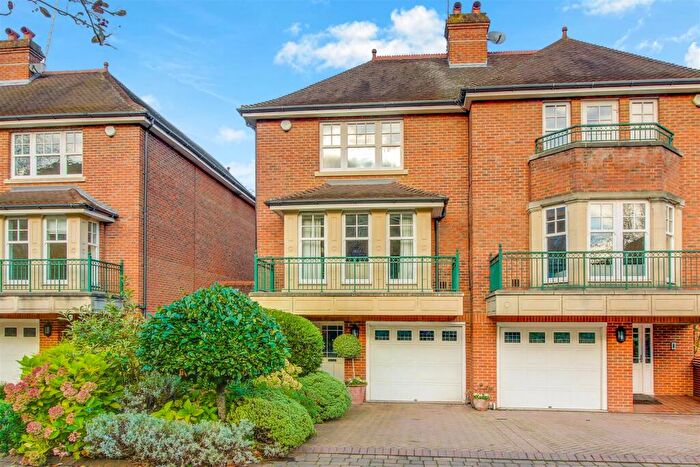
Houses for sale & to rent in Garden Suburb, London
House Prices in Garden Suburb
Properties in this part of Garden Suburb within London have an average house price of £2,000,626.00 and had 745 Property Transactions within the last 3 years¹. This area has 6,252 households² , where the most expensive property was sold for £35,100,000.00.
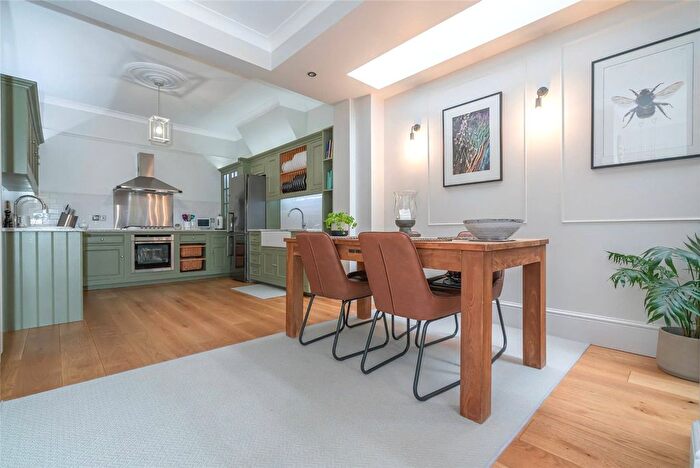
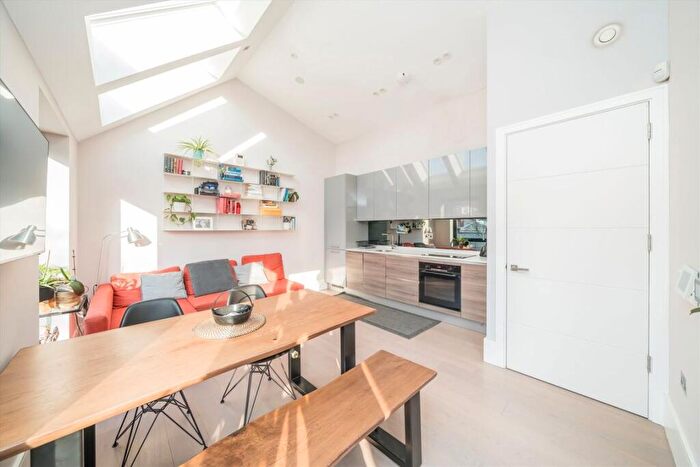
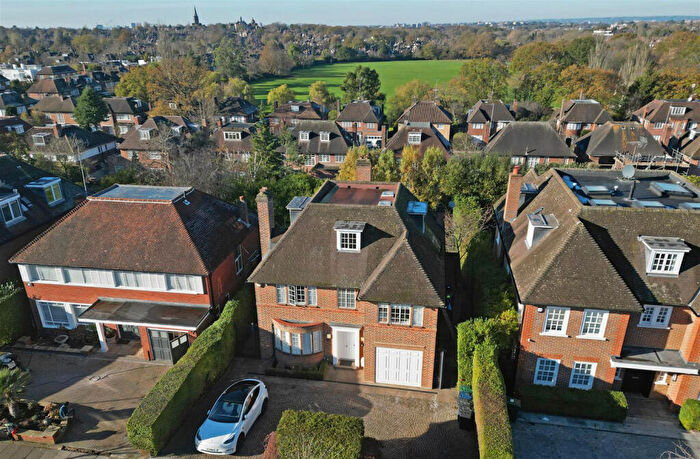
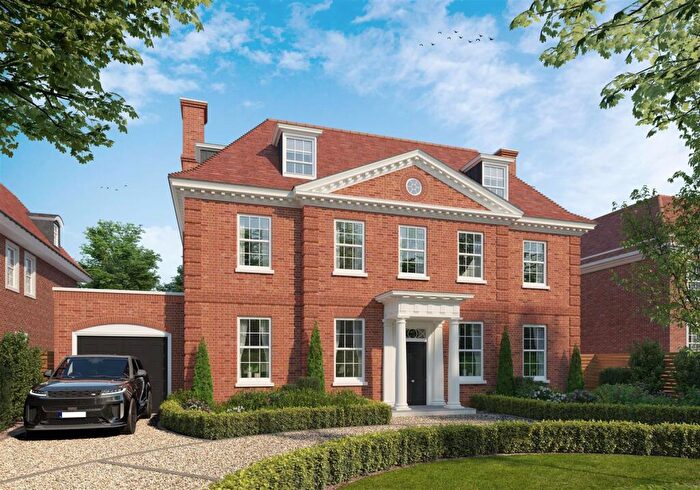
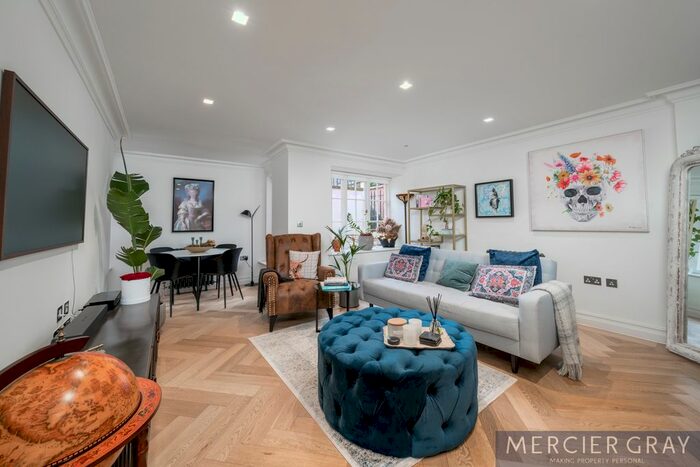
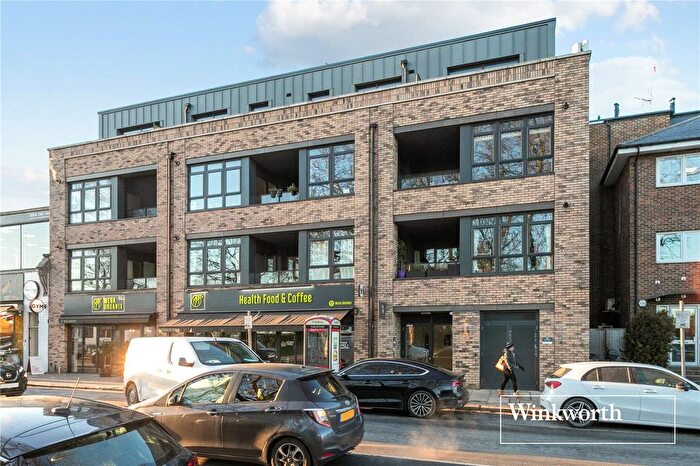
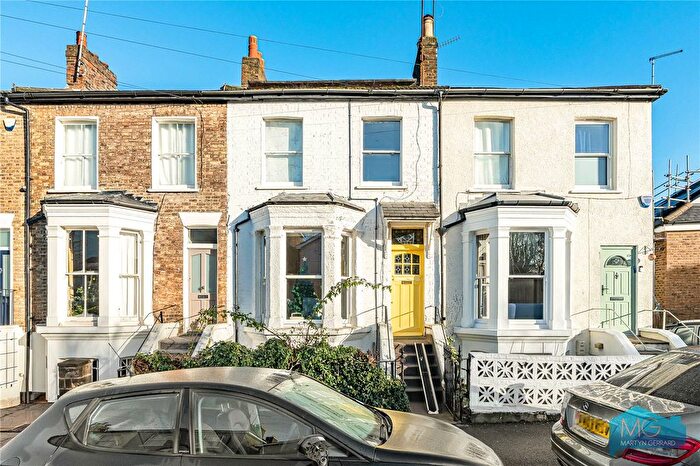
Properties for sale in Garden Suburb
Roads and Postcodes in Garden Suburb
Navigate through our locations to find the location of your next house in Garden Suburb, London for sale or to rent.
Transport near Garden Suburb
-
Golders Green Station
-
East Finchley Station
-
Brent Cross Station
-
Finchley Central Station
-
Hendon Central Station
-
Highgate Station
-
Hampstead Station
-
West Finchley Station
-
Cricklewood Station
-
Hampstead Heath Station
- FAQ
- Price Paid By Year
- Property Type Price
Frequently asked questions about Garden Suburb
What is the average price for a property for sale in Garden Suburb?
The average price for a property for sale in Garden Suburb is £2,000,626. This amount is 147% higher than the average price in London. There are more than 10,000 property listings for sale in Garden Suburb.
What streets have the most expensive properties for sale in Garden Suburb?
The streets with the most expensive properties for sale in Garden Suburb are Winnington Road at an average of £10,547,500, Canons Close at an average of £9,025,000 and Spaniards Close at an average of £8,300,000.
What streets have the most affordable properties for sale in Garden Suburb?
The streets with the most affordable properties for sale in Garden Suburb are Homesfield at an average of £325,000, East End Road at an average of £383,333 and Denison Close at an average of £420,600.
Which train stations are available in or near Garden Suburb?
Some of the train stations available in or near Garden Suburb are Cricklewood and Hampstead Heath.
Which tube stations are available in or near Garden Suburb?
Some of the tube stations available in or near Garden Suburb are Golders Green, East Finchley and Brent Cross.
Property Price Paid in Garden Suburb by Year
The average sold property price by year was:
| Year | Average Sold Price | Price Change |
Sold Properties
|
|---|---|---|---|
| 2025 | £1,553,081 | -34% |
92 Properties |
| 2024 | £2,073,545 | -1% |
240 Properties |
| 2023 | £2,101,484 | 4% |
186 Properties |
| 2022 | £2,022,274 | 22% |
227 Properties |
| 2021 | £1,587,383 | - |
252 Properties |
| 2020 | £1,586,822 | 6% |
171 Properties |
| 2019 | £1,497,762 | -8% |
184 Properties |
| 2018 | £1,621,343 | 2% |
209 Properties |
| 2017 | £1,592,473 | 23% |
214 Properties |
| 2016 | £1,232,134 | 1% |
185 Properties |
| 2015 | £1,222,697 | -9% |
214 Properties |
| 2014 | £1,329,071 | 13% |
272 Properties |
| 2013 | £1,157,109 | 6% |
226 Properties |
| 2012 | £1,091,864 | 8% |
190 Properties |
| 2011 | £1,008,894 | 7% |
201 Properties |
| 2010 | £943,173 | 7% |
255 Properties |
| 2009 | £873,415 | -13% |
188 Properties |
| 2008 | £983,988 | 12% |
187 Properties |
| 2007 | £867,836 | 22% |
339 Properties |
| 2006 | £678,309 | 10% |
369 Properties |
| 2005 | £612,757 | -2% |
277 Properties |
| 2004 | £624,002 | 16% |
306 Properties |
| 2003 | £523,619 | -1% |
323 Properties |
| 2002 | £526,254 | 8% |
401 Properties |
| 2001 | £483,816 | 22% |
346 Properties |
| 2000 | £375,048 | -4% |
360 Properties |
| 1999 | £389,036 | 10% |
405 Properties |
| 1998 | £348,872 | 11% |
370 Properties |
| 1997 | £309,498 | 30% |
365 Properties |
| 1996 | £215,898 | -25% |
410 Properties |
| 1995 | £270,403 | - |
276 Properties |
Property Price per Property Type in Garden Suburb
Here you can find historic sold price data in order to help with your property search.
The average Property Paid Price for specific property types in the last three years are:
| Property Type | Average Sold Price | Sold Properties |
|---|---|---|
| Semi Detached House | £1,607,201.00 | 233 Semi Detached Houses |
| Detached House | £4,682,160.00 | 149 Detached Houses |
| Terraced House | £1,011,014.00 | 103 Terraced Houses |
| Flat | £1,208,509.00 | 260 Flats |

