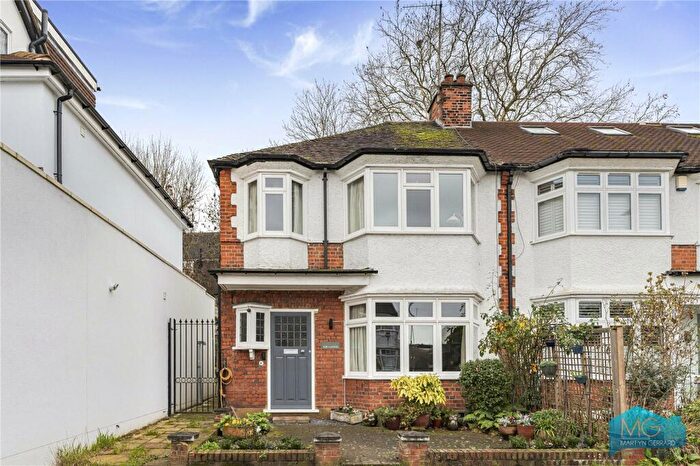
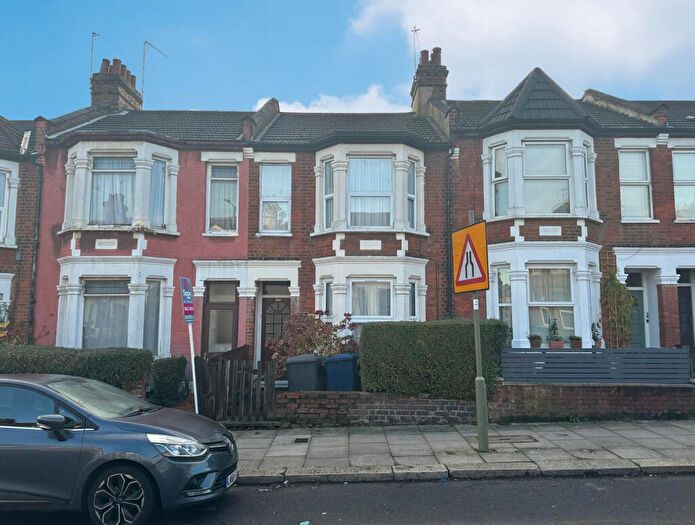
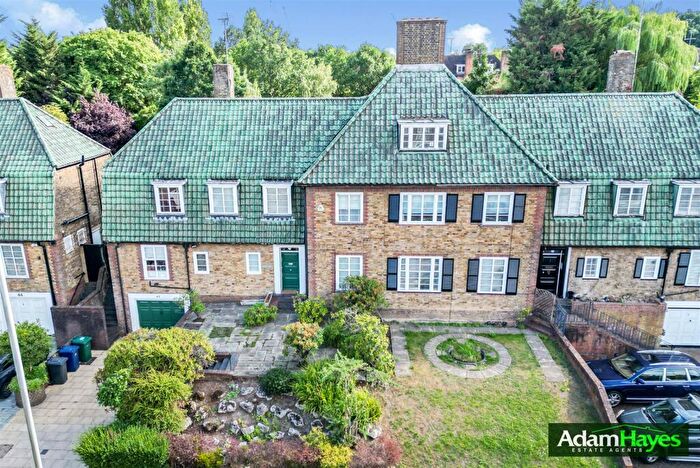
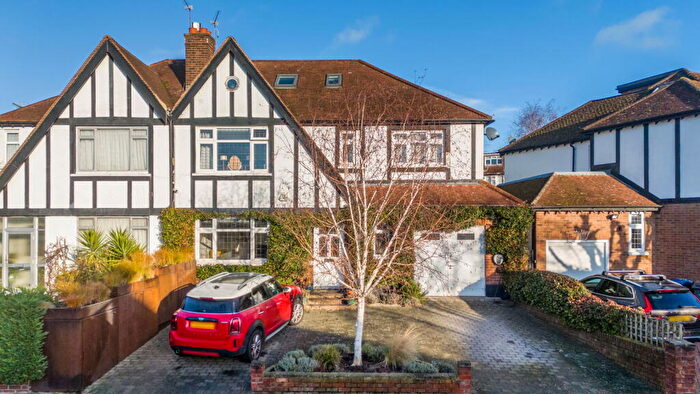
Houses for sale & to rent in East Finchley, London
House Prices in East Finchley
Properties in this part of East Finchley within London have an average house price of £721,465.00 and had 633 Property Transactions within the last 3 years¹. This area has 6,632 households² , where the most expensive property was sold for £2,225,000.00.
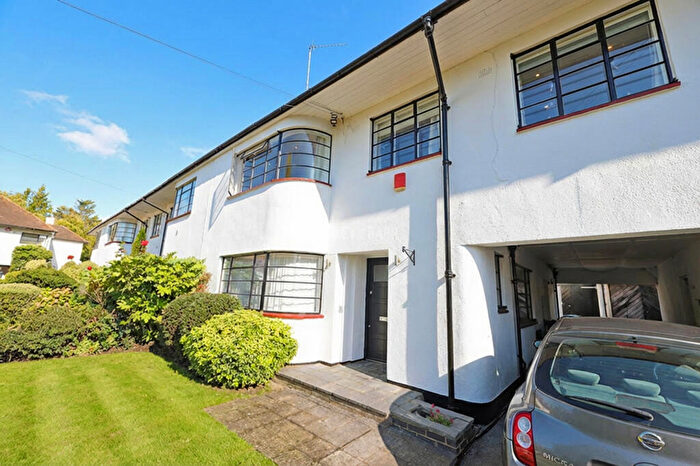
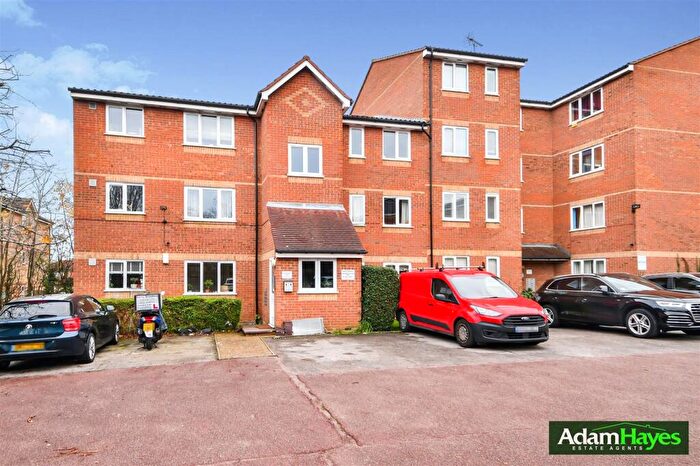
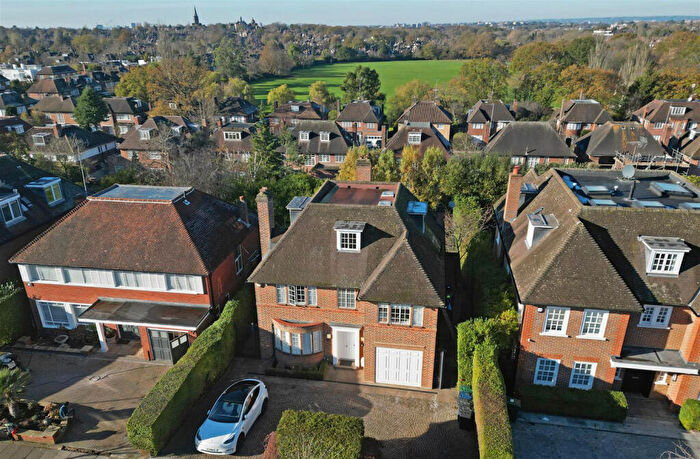
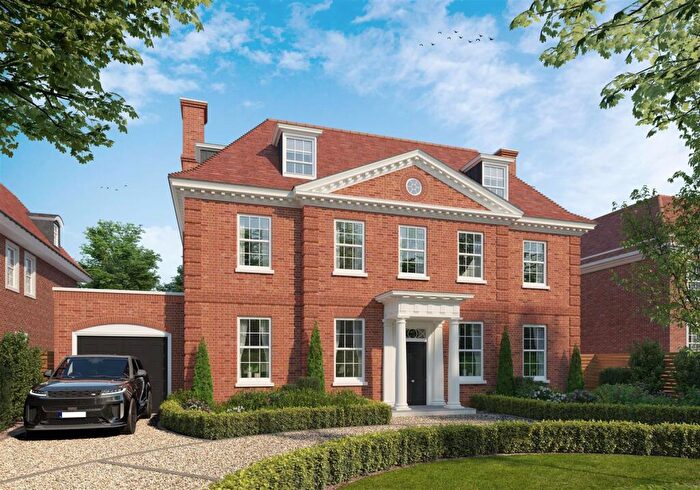
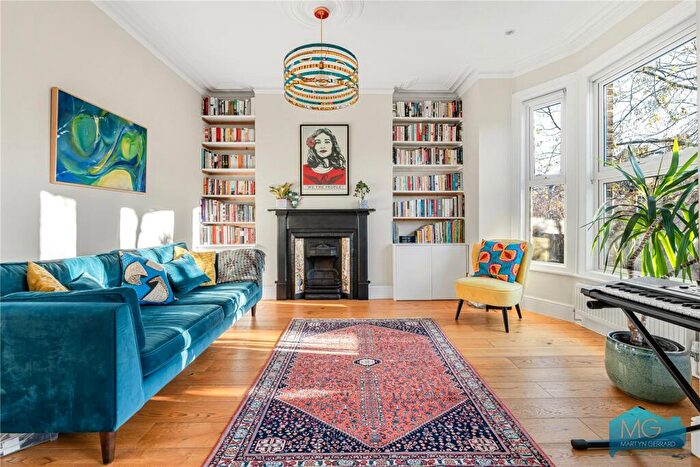
Properties for sale in East Finchley
Roads and Postcodes in East Finchley
Navigate through our locations to find the location of your next house in East Finchley, London for sale or to rent.
| Streets | Postcodes |
|---|---|
| 12a Branksome Court | N2 0RX |
| Abbots Gardens | N2 0JG N2 0JH N2 0JJ N2 0JQ |
| Ashburnham Close | N2 0NH |
| Athos Close | N2 0SR |
| Aumonier Mews | N2 9FA |
| Baronsmere Road | N2 9QB N2 9QD N2 9QE N2 9QG |
| Bedford Mews | N2 9DF |
| Bedford Road | N2 9DA N2 9DB N2 9DZ |
| Benedict Way | N2 0UR |
| Beresford Road | N2 8AT |
| Blackdown Close | N2 8JF |
| Borrowdale Close | N2 8LR |
| Brackenbury Road | N2 0SS N2 0ST N2 0UH |
| Brendon Grove | N2 8JE N2 8JZ |
| Briar Close | N2 0SD N2 0RS |
| Brighton Road | N2 8JU |
| Brim Hill | N2 0EZ N2 0HA N2 0HD |
| Brook Walk | N2 9RB |
| Brownswell Road | N2 8LA |
| Cecilia Close | N2 0UT |
| Chamberlain Road | N2 8JS |
| Chambers Gardens | N2 9AL |
| Chandos Road | N2 9AP N2 9AR |
| Chapel Court | N2 8DB |
| Cherry Tree Road | N2 9QL |
| Church Lane | N2 0TB N2 0TE N2 0TH N2 8DR N2 8DS N2 8DT N2 8DU N2 8DX N2 8HE N2 8DZ |
| Clare Close | N2 0UY |
| Claybrook Close | N2 8JG |
| Coppetts Road | N10 1JW |
| Creighton Avenue | N2 9BD N2 9BG N2 9BH N2 9BP N2 9BQ N2 9BS N2 9BE |
| Cricket Row | N2 0TD |
| Cromwell Close | N2 0LL |
| Dairy Mews | N2 8AH |
| Deanery Close | N2 8NS N2 8NT N2 8NU |
| Deansway | N2 0JF |
| Diploma Avenue | N2 8NX N2 8NY |
| Dunstan Close | N2 0UX |
| Durham Road | N2 9DN N2 9DP N2 9DR N2 9DS N2 9DT |
| Eagans Close | N2 8GA |
| East End Road | N2 0LY N2 0LZ N2 0ND N2 0PT N2 0PZ N2 0RY N2 0SU N2 0SZ N2 0TA N2 0XH N2 8AU N2 8AX N2 8AY N2 8BA N2 0RR N2 0RU N2 0SP N2 8FA |
| Edeleny Close | N2 0FE |
| Elm Gardens | N2 0TF N2 0TQ |
| Elmfield Road | N2 8EB |
| Elmhurst Avenue | N2 0LT N2 0LU |
| Elmshurst Crescent | N2 0LN N2 0LP N2 0LW |
| Ethan Drive | N2 0FD |
| Fairlawn Avenue | N2 9PS |
| Fallows Close | N2 8LG |
| Flaxman Villas | N2 0SH |
| Font Hills | N2 8LE N2 8LF |
| Fortis Green | N2 9EL N2 9EN N2 9JJ N2 9JL N2 9JN N2 9JR |
| Great North Road | N2 0NW |
| Hamilton Road | N2 0SG N2 0SW N2 0SQ |
| Hampstead Heights | N2 0PX |
| Heath View | N2 0QA N2 0QB N2 0QD N2 0QY |
| Heath View Close | N2 0PY |
| Helen Close | N2 0UU |
| Hertford Road | N2 9BU N2 9BX N2 9BW |
| High Road | N2 8AB N2 8AD N2 8AG N2 8AJ N2 8AN N2 8AQ N2 8BW N2 8HD N2 8HH N2 8HL N2 8HR N2 8HS N2 9AB N2 9AD N2 9AE N2 9AH N2 9AS N2 9AY N2 9BT N2 9EB N2 9ED N2 9PJ N2 9PN N2 8AL N2 8AW N2 8HB N2 8HG N2 9AG N2 9BB |
| Hobbs Green | N2 0TG |
| Homefield Gardens | N2 0NA N2 0XL |
| Howard Walk | N2 0HB |
| Huntingdon Road | N2 9DU N2 9DX |
| Indigo Walk | N6 4TB |
| Ingram Road | N2 9QA |
| Juliana Close | N2 0TJ |
| King Street | N2 8DY N2 8EA N2 8PB N2 8PA |
| King Street Mews | N2 8EQ |
| Kitchener Road | N2 8AS |
| Lankaster Gardens | N2 9AJ N2 9AZ N2 9FE N2 9FF N2 9FG N2 9FH |
| Leicester Mews | N2 9EJ |
| Leicester Road | N2 9DY N2 9EA |
| Leopold Road | N2 8BE N2 8BG |
| Leslie Road | N2 8BH N2 8BJ N2 8BL N2 8BN N2 8AP |
| Lewis Gardens | N2 9AN |
| Limerick Mews | N2 9DD |
| Lincoln Road | N2 9DJ N2 9DL N2 9FD |
| Long Lane | N2 8JL N2 8JN N2 8JP N2 8JQ N2 8JW N2 8JX |
| Lucas Gardens | N2 8HJ |
| Maddison Close | N2 8JA |
| Maddison Terrace | N2 8JB |
| Manor Cottages Approach | N2 8JR |
| Manor Park Road | N2 0SJ N2 0SL N2 0SN |
| Market Place | N2 8BB N2 8BD N2 8BF N2 8DD N2 8GS N2 8BQ N2 8DA N2 8DG |
| Maya Road | N2 0PP |
| Neale Close | N2 0LE N2 0LF |
| New Ash Close | N2 8DQ |
| New Oak Road | N2 8LN |
| New Trinity Road | N2 8EE |
| Norfolk Close | N2 8ET N2 8EZ |
| Nursery Road | N2 9RA |
| Oak Lane | N2 8LP N2 8LT |
| Oak Ridge Drive | N2 8DF |
| Oakview Gardens | N2 0NJ |
| Old Farm Road | N2 9RE N2 9RF N2 9RG N2 9RQ |
| Ossulton Way | N2 0LB N2 0LD N2 0LG |
| Park Farm Close | N2 0PU |
| Park Gate | N2 8BY N2 8DJ |
| Park Hall Road | N2 9PT N2 9PU N2 9PX N2 9PY |
| Park Road | N2 8EU N2 8EX N2 8EY |
| Plane Tree Walk | N2 9JP |
| Prospect Place | N2 0XA |
| Prospect Ring | N2 8BP N2 8BS N2 8GR |
| Pulham Avenue | N2 0LR |
| Red Lion Hill | N2 8ED |
| Richmond Road | N2 8JT |
| Sedgemere Avenue | N2 0SX N2 0SY |
| Simms Gardens | N2 8HT |
| St Mary's Green | N2 0UZ |
| Stable Walk | N2 9RD |
| Stanley Road | N2 0NB |
| Strawberry Vale | N2 9AA N2 9BA |
| Summerlee Avenue | N2 9QH N2 9QJ N2 9QP |
| Summerlee Gardens | N2 9QN |
| Sylvester Road | N2 8HN |
| Talbot Avenue | N2 0LS |
| Tarling Road | N2 8LB |
| Taunton Drive | N2 8JD |
| Thackrah Close | N2 8LH |
| The Grange | N2 8EG N2 8EH N2 8EJ N2 8EL N2 8EN N2 8EP N2 8ER N2 8ES N2 8EW N2 8LU N2 8LX N2 8LY N2 8NA N2 8NB N2 8ND N2 8NE N2 8NG N2 8NH N2 8NJ N2 8NL |
| The Leys | N2 0HE |
| The Mead | N2 8LD |
| The Walks | N2 8DN N2 8DE N2 8DL |
| Thomas More Way | N2 0UL |
| Trinity Avenue | N2 0LX |
| Trinity Road | N2 8JH N2 8JJ |
| Twyford Avenue | N2 9NH |
| Vale Close | N2 9NG |
| Vanderville Gardens | N2 8HU |
| William Close | N2 8EF |
| Wilmot Close | N2 8HP |
| N2 2EB N2 2EE N2 0YJ N2 2EF N2 2EN N2 0YX N2 2EQ N2 0YZ N2 0ZE N2 2AD N2 2ER N2 2EU N2 2AG N2 2EW N2 2DT N2 2DE N2 2EX N2 2DF N2 2EY N2 2EZ N2 2FA N2 0AX N2 0FZ N2 0HR N2 0QZ N2 0UF N2 0WA N2 0WS N2 0WX N2 0XF N2 0XQ N2 0XW N2 8YA N2 9WU N2 9ZP N2 2FG N2 2FL N2 2FZ N2 2GA N2 2GB N2 2GD N2 2GF |
Transport near East Finchley
-
East Finchley Station
-
Finchley Central Station
-
West Finchley Station
-
Highgate Station
-
Golders Green Station
-
Woodside Park Station
-
New Southgate Station
-
Mill Hill East Station
-
Brent Cross Station
-
Alexandra Palace Station
- FAQ
- Price Paid By Year
- Property Type Price
Frequently asked questions about East Finchley
What is the average price for a property for sale in East Finchley?
The average price for a property for sale in East Finchley is £721,465. This amount is 11% lower than the average price in London. There are 2,755 property listings for sale in East Finchley.
What streets have the most expensive properties for sale in East Finchley?
The streets with the most expensive properties for sale in East Finchley are Abbots Gardens at an average of £1,547,083, Baronsmere Road at an average of £1,453,750 and Summerlee Avenue at an average of £1,450,555.
What streets have the most affordable properties for sale in East Finchley?
The streets with the most affordable properties for sale in East Finchley are Diploma Avenue at an average of £246,687, Vanderville Gardens at an average of £270,000 and Old Farm Road at an average of £271,071.
Which train stations are available in or near East Finchley?
Some of the train stations available in or near East Finchley are New Southgate and Alexandra Palace.
Which tube stations are available in or near East Finchley?
Some of the tube stations available in or near East Finchley are East Finchley, Finchley Central and West Finchley.
Property Price Paid in East Finchley by Year
The average sold property price by year was:
| Year | Average Sold Price | Price Change |
Sold Properties
|
|---|---|---|---|
| 2025 | £723,475 | -5% |
109 Properties |
| 2024 | £759,899 | 13% |
179 Properties |
| 2023 | £660,240 | -11% |
148 Properties |
| 2022 | £731,427 | 7% |
197 Properties |
| 2021 | £678,892 | 5% |
242 Properties |
| 2020 | £645,476 | 4% |
132 Properties |
| 2019 | £618,680 | -5% |
173 Properties |
| 2018 | £647,087 | -0,2% |
148 Properties |
| 2017 | £648,086 | 11% |
131 Properties |
| 2016 | £577,259 | 8% |
178 Properties |
| 2015 | £532,194 | 8% |
206 Properties |
| 2014 | £492,227 | 10% |
183 Properties |
| 2013 | £445,227 | - |
213 Properties |
| 2012 | £445,035 | 7% |
242 Properties |
| 2011 | £413,747 | -3% |
198 Properties |
| 2010 | £426,530 | 15% |
205 Properties |
| 2009 | £363,977 | -5% |
168 Properties |
| 2008 | £380,406 | 10% |
145 Properties |
| 2007 | £342,752 | 13% |
341 Properties |
| 2006 | £297,902 | 3% |
343 Properties |
| 2005 | £289,370 | 7% |
277 Properties |
| 2004 | £269,569 | 7% |
276 Properties |
| 2003 | £251,770 | 6% |
257 Properties |
| 2002 | £235,487 | 10% |
382 Properties |
| 2001 | £211,143 | 17% |
307 Properties |
| 2000 | £175,780 | 18% |
326 Properties |
| 1999 | £144,494 | 10% |
358 Properties |
| 1998 | £129,401 | 10% |
267 Properties |
| 1997 | £115,957 | 26% |
324 Properties |
| 1996 | £85,933 | -5% |
439 Properties |
| 1995 | £89,862 | - |
228 Properties |
Property Price per Property Type in East Finchley
Here you can find historic sold price data in order to help with your property search.
The average Property Paid Price for specific property types in the last three years are:
| Property Type | Average Sold Price | Sold Properties |
|---|---|---|
| Flat | £423,576.00 | 330 Flats |
| Semi Detached House | £1,210,052.00 | 93 Semi Detached Houses |
| Detached House | £1,127,222.00 | 9 Detached Houses |
| Terraced House | £966,306.00 | 201 Terraced Houses |

