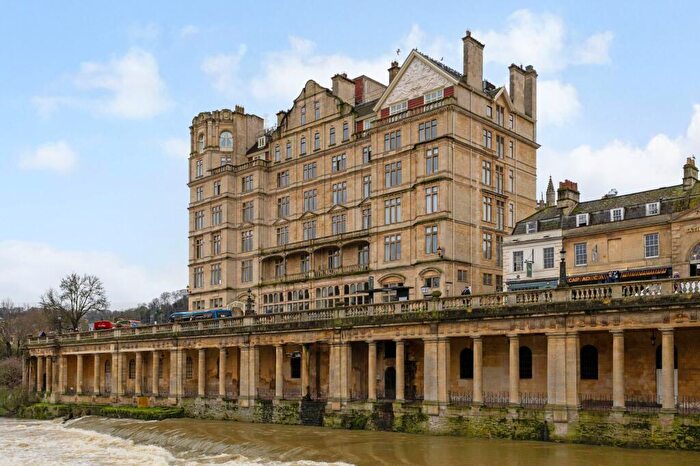
Houses for sale & to rent in Abbey, Bath
House Prices in Abbey
Properties in Abbey have an average house price of £540,874.00 and had 312 Property Transactions within the last 3 years¹.
Abbey is an area in Bath, Bath and North East Somerset with 2,831 households², where the most expensive property was sold for £4,625,000.00.
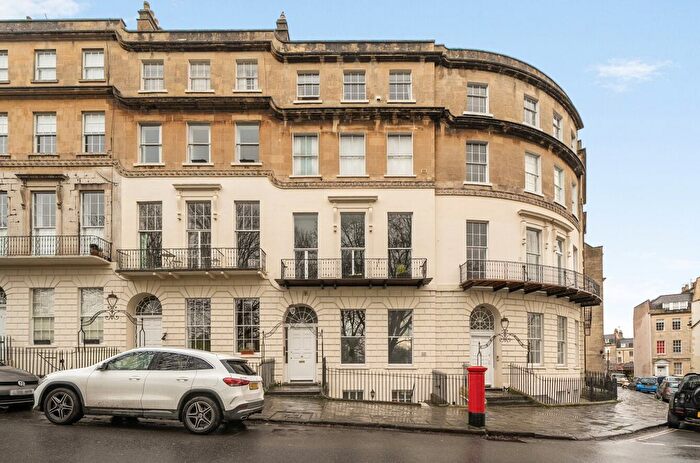
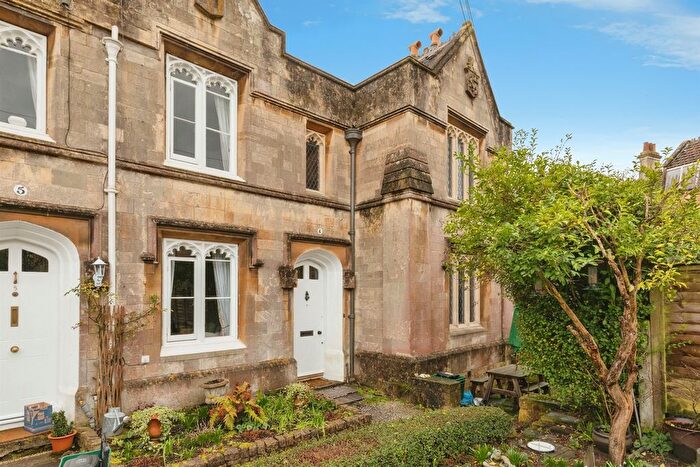
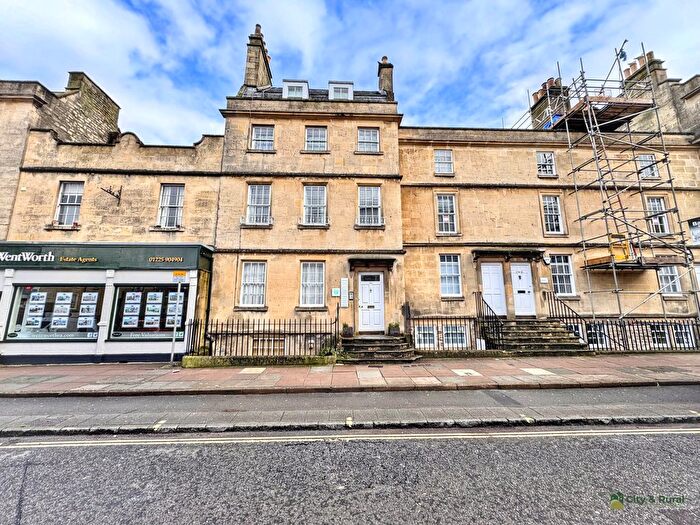
Properties for sale in Abbey
Roads and Postcodes in Abbey
Navigate through our locations to find the location of your next house in Abbey, Bath for sale or to rent.
| Streets | Postcodes |
|---|---|
| Abbey Churchyard | BA1 1LY |
| Abbey Green | BA1 1NR BA1 1NW |
| Abbey Street | BA1 1NN |
| Alfred Street | BA1 2QU BA1 2QX |
| Argyle Street | BA2 4BA BA2 4BQ |
| Bartlett Street | BA1 2QZ |
| Barton Buildings | BA1 2JR |
| Bath Street | BA1 1SA |
| Bathwick Street | BA2 6NZ BA2 6PA |
| Bathwick Villas | BA2 6LS |
| Beehive Yard | BA1 5BB |
| Belmont | BA1 5DZ |
| Bennett Street | BA1 2EX BA1 2QE BA1 2QJ BA1 2QL BA1 2QQ |
| Bladud Buildings | BA1 5LS |
| Broad Street | BA1 5LJ BA1 5LN BA1 5LP BA1 5LW |
| Brock Street | BA1 2LJ BA1 2LN BA1 2LW |
| Brunswick Place | BA1 2RQ |
| Burlington Place | BA1 2SQ |
| Catharine Place | BA1 2PR BA1 2PS |
| Chatham Row | BA1 5BS |
| Church Street | BA1 1NL |
| Circus Mews | BA1 2PW |
| Circus Place | BA1 2PG |
| Cleveland Cottages | BA1 5DD |
| Cleveland Place West | BA1 5DG |
| Cleveland Terrace | BA1 5DF |
| Corn Street | BA1 1UF |
| Daniel Street | BA2 6NB BA2 6ND |
| Darlington Street | BA2 4EA |
| Dorchester Street | BA1 1SS |
| Duke Street | BA2 4AG BA2 4AQ BA2 4AR |
| Edgar Buildings | BA1 2EE |
| Edward Street | BA2 4DU BA2 4DX |
| Fairfield Villas | BA2 6LT |
| Gay Street | BA1 2NT BA1 2PD BA1 2PH |
| George Street | BA1 2EH BA1 2EN |
| Gerrard Buildings | BA2 4DQ |
| Gloucester Street | BA1 2SE |
| Grand Parade | BA2 4DF |
| Great Pulteney Street | BA2 4BP BA2 4BR BA2 4BT BA2 4BU BA2 4BX BA2 4BZ BA2 4DL BA2 4DN BA2 4DP BA2 4DR |
| Grove Street | BA2 6PE BA2 6PJ BA2 6PN |
| Guinea Lane | BA1 5NB |
| Harington Place | BA1 1HF |
| Hay Hill | BA1 5LZ |
| Henrietta Gardens | BA2 6LZ BA2 6NA |
| Henrietta Place | BA2 6PP |
| Henrietta Road | BA2 6LY |
| Henrietta Street | BA2 6LL BA2 6LP BA2 6LR BA2 6LW |
| Henrietta Villas | BA2 6LX |
| High Street | BA1 5AQ |
| Hot Bath Street | BA1 1SJ |
| John Street | BA1 2JL |
| Johnstone Street | BA2 4DH |
| Lansdown Road | BA1 5DU |
| Laura Place | BA2 4BH BA2 4BJ BA2 4BL |
| London Street | BA1 5BU |
| Lower Borough Walls | BA1 1QR |
| Manvers Street | BA1 1JH BA1 1JQ |
| Margaret's Buildings | BA1 2LP |
| Miles's Buildings | BA1 2QS |
| Milsom Place | BA1 1AW |
| Milsom Street | BA1 1DG |
| Nelson Place East | BA1 5DA |
| New Bond Street | BA1 1BA |
| New Marchant's Passage | BA1 1AR |
| North Parade | BA1 1LF BA2 4AJ |
| North Parade Buildings | BA1 1NS |
| Northumberland Place | BA1 5AR |
| Old King Street | BA1 2JW |
| Old Orchard | BA1 5AX |
| Old Orchard Cottages | BA1 5BE |
| Old Orchard Street | BA1 1JU |
| Oxford Row | BA1 2QN BA1 2QW |
| Philip Street | BA1 1AU |
| Pierrepont Place | BA1 1JX |
| Pierrepont Street | BA1 1LA BA1 1LB |
| Princes Buildings | BA1 2ED |
| Pulteney Mews | BA2 4DS |
| Pulteney Road | BA2 4EZ |
| Queen Street | BA1 1HE |
| Quiet Street | BA1 2JS |
| Rivers Street | BA1 2PZ BA1 2QA BA1 2QB |
| Rivers Street Mews | BA1 2QD |
| Rivers Street Place | BA1 2RS |
| Russell Street | BA1 2QF |
| Sawclose | BA1 1EY |
| South Parade | BA2 4AD |
| Southgate | BA1 1TP |
| Southgate Street | BA1 1AQ |
| St Andrews Terrace | BA1 2QR |
| St James's Parade | BA1 1UH BA1 1UL |
| St Johns Road | BA2 6PD BA2 6PL BA2 6PR BA2 6PT BA2 6PX BA2 6PZ |
| St Michaels Place | BA1 1SG |
| Sydney Place | BA2 6NF |
| Terrace Walk | BA1 1LN |
| The Circus | BA1 2ES BA1 2ET BA1 2EU BA1 2EW |
| The Paragon | BA1 5LX BA1 5LY |
| Trim Street | BA1 1HA BA1 1HB |
| Upper Church Street | BA1 2PT |
| Vane Street | BA2 4DY BA2 4DZ |
| Vineyards | BA1 5NA |
| Walcot Street | BA1 5BD BA1 5BG BA1 5BN BA1 5BQ BA1 5BW |
| Westgate Buildings | BA1 1EB |
| Westgate Street | BA1 1EA BA1 1EL BA1 1EQ |
| Wood Street | BA1 2JQ |
| York Street | BA1 1NG |
| BA2 6PS |
Transport near Abbey
- FAQ
- Price Paid By Year
- Property Type Price
Frequently asked questions about Abbey
What is the average price for a property for sale in Abbey?
The average price for a property for sale in Abbey is £540,874. This amount is 1% lower than the average price in Bath. There are 3,337 property listings for sale in Abbey.
What streets have the most expensive properties for sale in Abbey?
The streets with the most expensive properties for sale in Abbey are Bathwick Villas at an average of £2,350,000, Daniel Street at an average of £1,431,666 and Henrietta Villas at an average of £1,363,000.
What streets have the most affordable properties for sale in Abbey?
The streets with the most affordable properties for sale in Abbey are Broad Street at an average of £200,500, Quiet Street at an average of £215,000 and Margaret's Buildings at an average of £220,250.
Which train stations are available in or near Abbey?
Some of the train stations available in or near Abbey are Bath Spa, Oldfield Park and Freshford.
Property Price Paid in Abbey by Year
The average sold property price by year was:
| Year | Average Sold Price | Price Change |
Sold Properties
|
|---|---|---|---|
| 2025 | £499,729 | -13% |
80 Properties |
| 2024 | £562,467 | 3% |
128 Properties |
| 2023 | £545,947 | -2% |
104 Properties |
| 2022 | £558,744 | -5% |
192 Properties |
| 2021 | £585,681 | 32% |
189 Properties |
| 2020 | £395,572 | -51% |
86 Properties |
| 2019 | £598,971 | 29% |
120 Properties |
| 2018 | £424,389 | -6% |
125 Properties |
| 2017 | £449,937 | -8% |
110 Properties |
| 2016 | £487,803 | 2% |
167 Properties |
| 2015 | £476,524 | 25% |
178 Properties |
| 2014 | £355,318 | 8% |
170 Properties |
| 2013 | £328,125 | 1% |
174 Properties |
| 2012 | £324,250 | 0,3% |
212 Properties |
| 2011 | £323,345 | -5% |
131 Properties |
| 2010 | £340,062 | -3% |
146 Properties |
| 2009 | £348,598 | 12% |
131 Properties |
| 2008 | £307,422 | -17% |
125 Properties |
| 2007 | £359,918 | 15% |
206 Properties |
| 2006 | £306,045 | 6% |
197 Properties |
| 2005 | £288,326 | -1% |
157 Properties |
| 2004 | £292,597 | 12% |
185 Properties |
| 2003 | £256,346 | 12% |
192 Properties |
| 2002 | £225,368 | 19% |
231 Properties |
| 2001 | £183,210 | 7% |
226 Properties |
| 2000 | £171,260 | 28% |
186 Properties |
| 1999 | £122,990 | 12% |
239 Properties |
| 1998 | £107,759 | 6% |
169 Properties |
| 1997 | £101,831 | 0,2% |
217 Properties |
| 1996 | £101,616 | 15% |
167 Properties |
| 1995 | £86,166 | - |
114 Properties |
Property Price per Property Type in Abbey
Here you can find historic sold price data in order to help with your property search.
The average Property Paid Price for specific property types in the last three years are:
| Property Type | Average Sold Price | Sold Properties |
|---|---|---|
| Flat | £388,576.00 | 248 Flats |
| Semi Detached House | £1,006,774.00 | 13 Semi Detached Houses |
| Detached House | £2,175,333.00 | 3 Detached Houses |
| Terraced House | £1,099,412.00 | 48 Terraced Houses |

