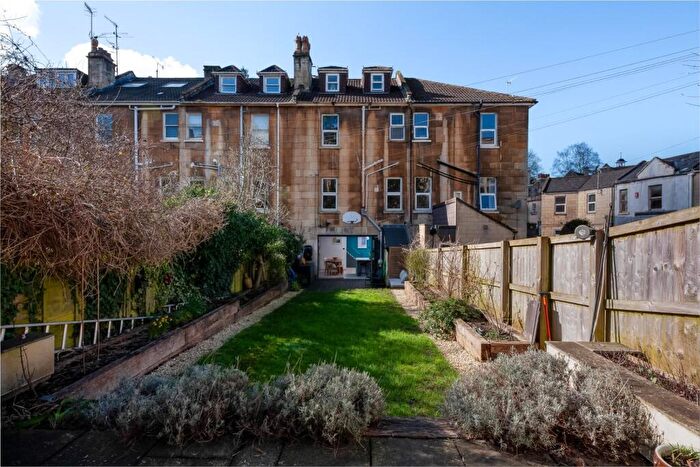
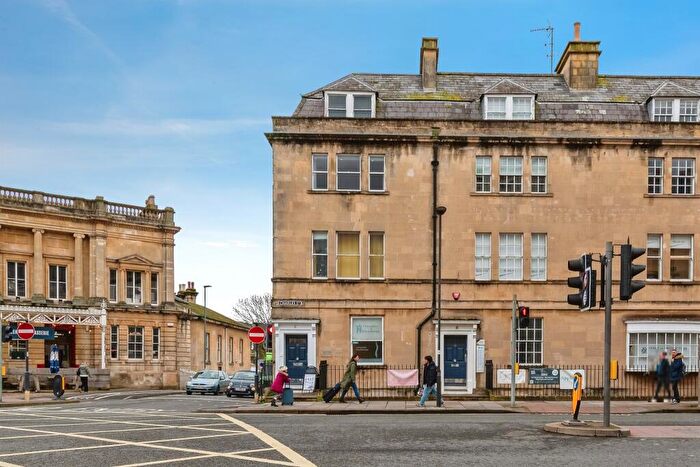
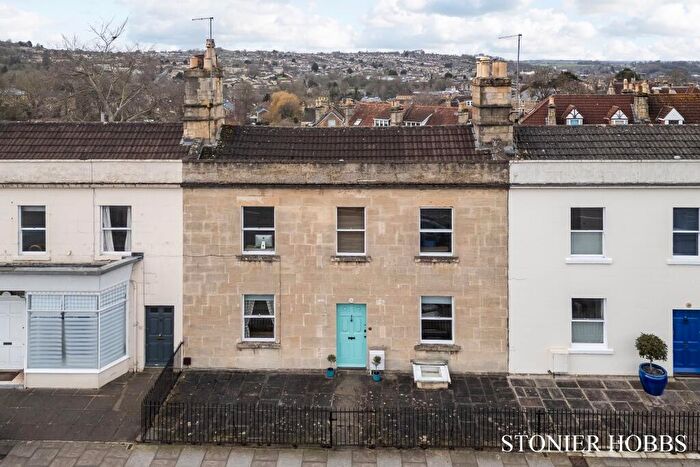
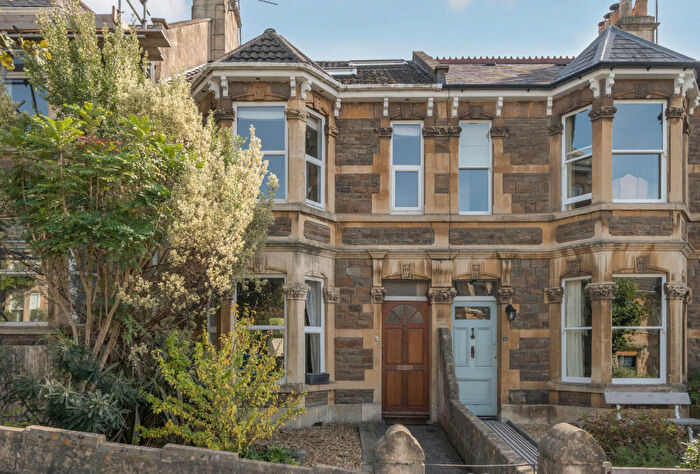
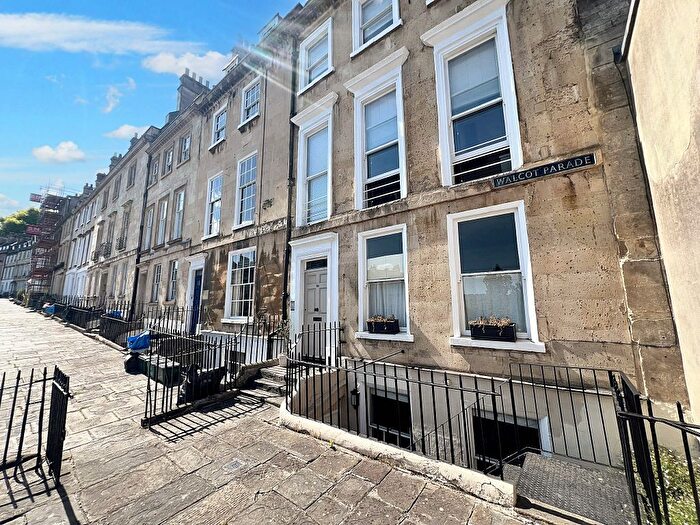
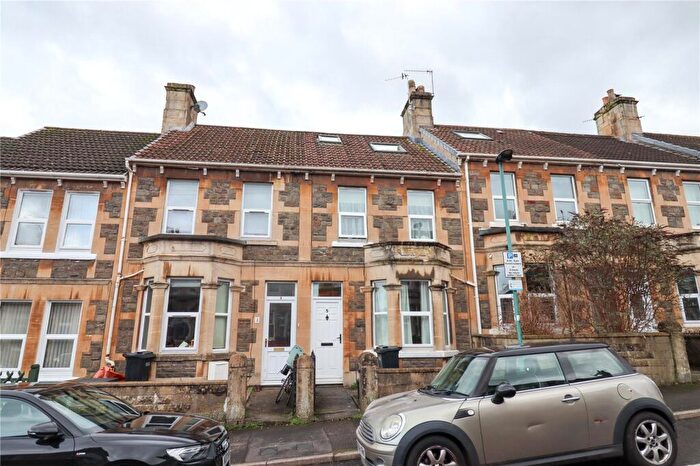
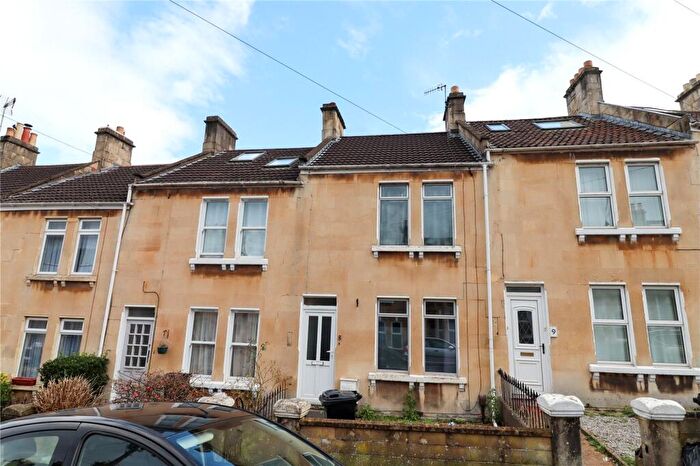
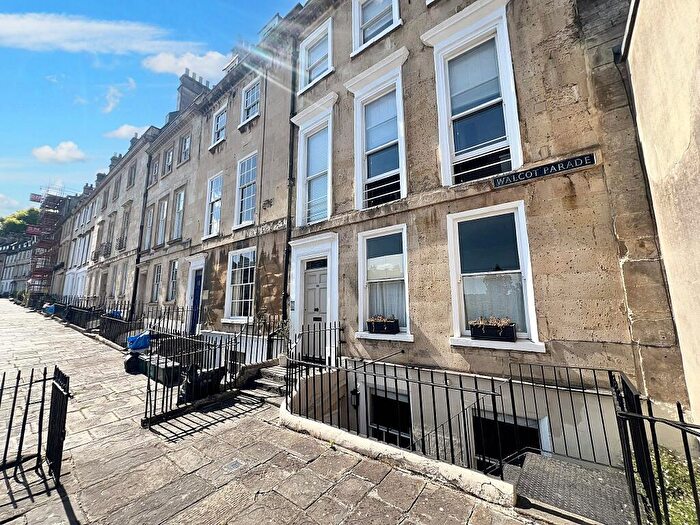
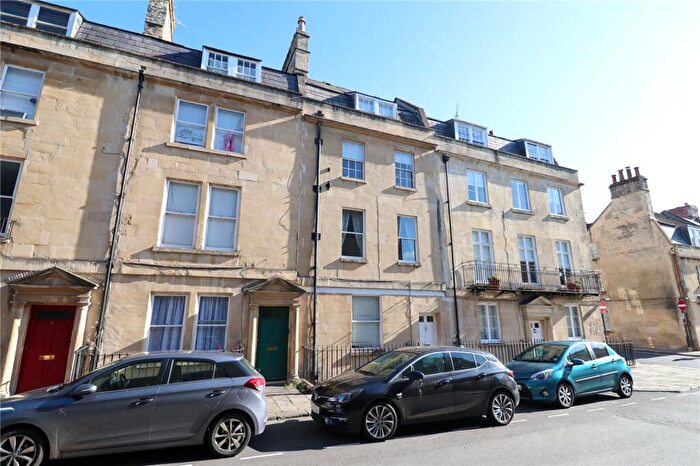
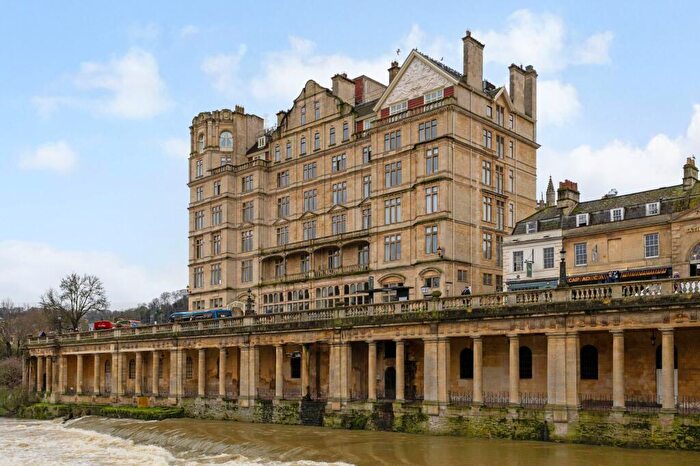
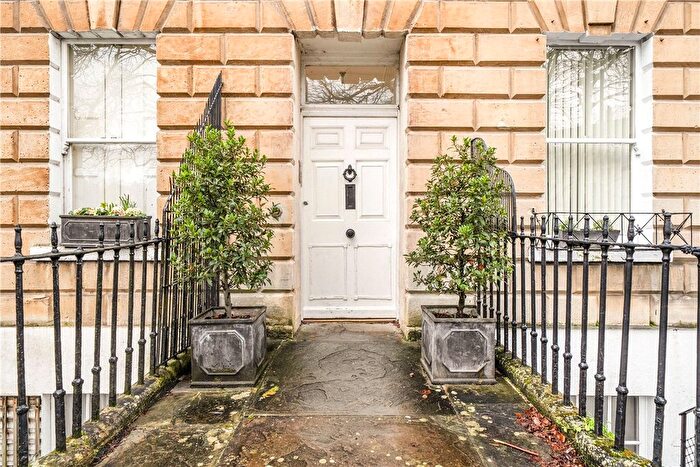
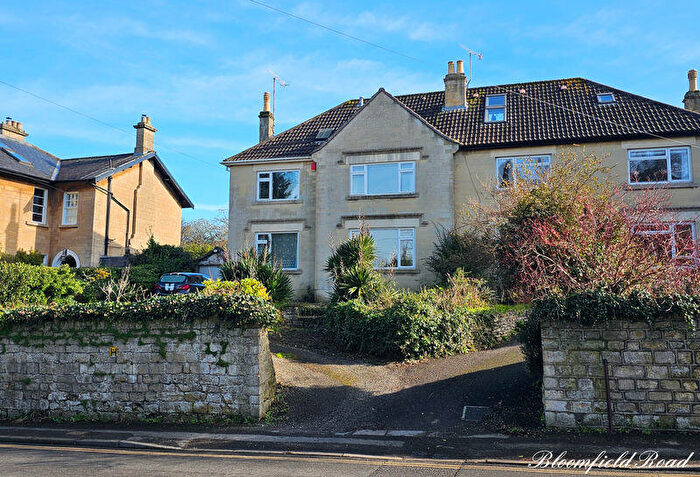
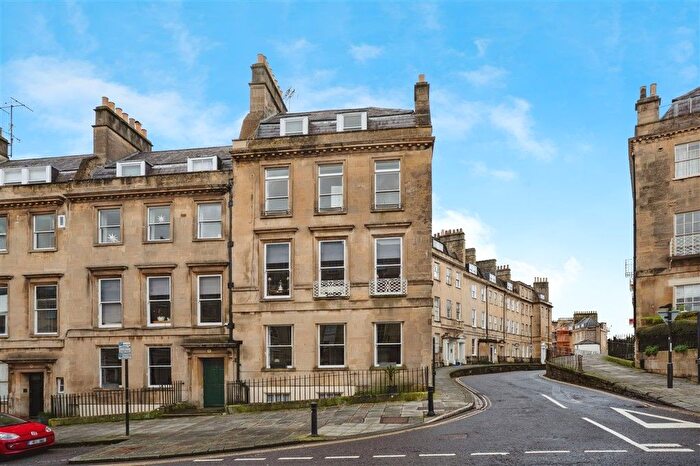
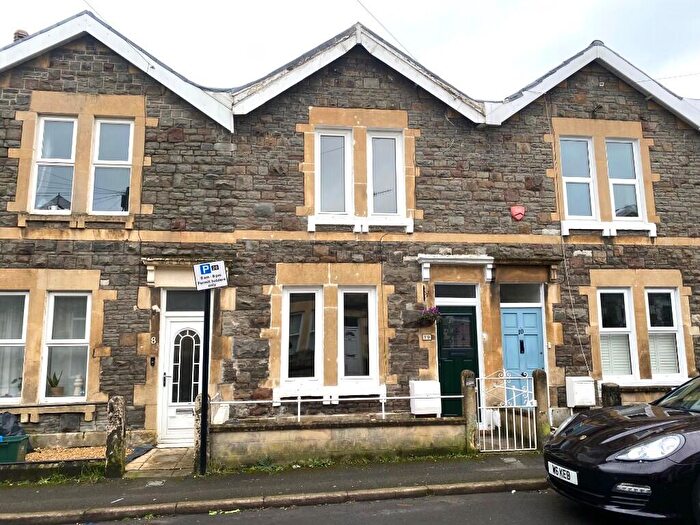
Houses for sale & to rent in Widcombe, Bath
House Prices in Widcombe
Properties in Widcombe have an average house price of £687,716.00 and had 244 Property Transactions within the last 3 years¹.
Widcombe is an area in Bath, Bath and North East Somerset with 2,295 households², where the most expensive property was sold for £3,425,000.00.
Properties for sale in Widcombe
Roads and Postcodes in Widcombe
Navigate through our locations to find the location of your next house in Widcombe, Bath for sale or to rent.
| Streets | Postcodes |
|---|---|
| 65 Prior Park Road | BA2 4NL |
| Abbey View | BA2 6DG |
| Abbey View Gardens | BA2 6DQ |
| Alexandra Road | BA2 4PW |
| Alton Place | BA2 4PR |
| Archway Street | BA2 4JD |
| Bridge Lock Mews | BA2 4DG |
| Broadway | BA2 4JA |
| Brougham Hayes | BA2 3QU |
| Calton Gardens | BA2 4QG |
| Calton Road | BA2 4PP |
| Calton Walk | BA2 4QQ |
| Cambridge Place | BA2 6AB |
| Cambridge Terrace | BA2 6BE |
| Caroline Buildings | BA2 4JH |
| Cedar Villas | BA2 3HW |
| Cedar Way | BA2 3HN |
| Church Lane | BA2 6BD |
| Church Street | BA2 6AZ BA2 6BA BA2 6BB |
| Clarendon Road | BA2 4NJ BA2 4NN |
| Clarendon Villas | BA2 6AG |
| Claverton Buildings | BA2 4LD |
| Combeside | BA2 4LU |
| Daisy Bank | BA2 4NB |
| Ebenezer Terrace | BA2 4JR |
| Excelsior Street | BA2 4JB |
| Ferry Lane | BA2 4HR BA2 4HS |
| Fersfield | BA2 5AR |
| Forefield Place | BA2 4QF |
| Forefield Rise | BA2 4PL |
| Forefield Terrace | BA2 4PD |
| Fox Hill | BA2 5AS BA2 5AT |
| Gordon Road | BA2 4NH |
| Greenway Lane | BA2 4LL BA2 4LN |
| Hatfield Buildings | BA2 6AF |
| Hayden Close | BA2 3JU |
| Hayes Place | BA2 4QW |
| Hayesfield Park | BA2 4QE |
| Highview | BA2 3JT |
| Holloway | BA2 4PS BA2 4PT BA2 4PU |
| Horseshoe Walk | BA2 6DF |
| Lorne Road | BA2 3BY BA2 3BZ |
| Lower Bristol Road | BA2 3BA BA2 3BE BA2 3BG BA2 3BQ BA2 3DL BA2 3DQ |
| Lower Oldfield Park | BA2 3HL BA2 3HP BA2 3HR BA2 3HS |
| Lyncombe Hill | BA2 4PF BA2 4PG BA2 4PH BA2 4PJ BA2 4PN BA2 4PQ |
| Lyncombe Vale | BA2 4LY |
| Lyncombe Vale Road | BA2 4LP BA2 4LR BA2 4LS |
| Macaulay Buildings | BA2 6AS BA2 6AT |
| Magdalen Avenue | BA2 4QB BA2 4QH |
| Magdalen Road | BA2 4QA |
| Millbrook Place | BA2 4JY |
| Oak Street | BA2 3BR |
| Oldfield Place | BA2 3HG |
| Oldfield Road | BA2 3NB BA2 3ND |
| Park Avenue | BA2 4QD |
| Perrymead | BA2 5AX BA2 5AY BA2 5AZ |
| Prior Park Buildings | BA2 4NP |
| Prior Park Cottages | BA2 4NR |
| Prior Park Gardens | BA2 4NQ |
| Prior Park Road | BA2 4NF BA2 4NG BA2 4NW |
| Prospect Road | BA2 6AY |
| Pulteney Avenue | BA2 4HH |
| Pulteney Gardens | BA2 4HG |
| Pulteney Grove | BA2 4HQ |
| Pulteney Terrace | BA2 4HJ |
| Queens Place | BA2 4JQ |
| Ralph Allen Drive | BA2 5AJ |
| Rosemount Lane | BA2 4NE |
| Rossiter Road | BA2 4JP |
| Southcot Place | BA2 4PE |
| Southville Terrace | BA2 4LZ |
| Spring Crescent | BA2 4HZ |
| Spring Gardens Road | BA2 4HY |
| St Marks Gardens | BA2 4PZ |
| St Marks Road | BA2 4PA |
| St Marys Buildings | BA2 3AT |
| St Matthews Place | BA2 4JJ |
| St Peters Terrace | BA2 3BT BA2 3BU |
| Summerlays Court | BA2 4HU |
| Summerlays Place | BA2 4HN |
| Sunnybank | BA2 4NA |
| Sussex Place | BA2 4LA |
| Sydenham Buildings | BA2 3BS |
| The Tyning | BA2 6AL |
| Thornbank Place | BA2 3HH |
| Thornbank Villas | BA2 3HJ |
| Tyning End | BA2 6AN BA2 6AP BA2 6AW |
| Upper Oldfield Park | BA2 3HT BA2 3JX BA2 3JZ BA2 3LB |
| Victoria Road | BA2 3QY |
| Victoria Terrace | BA2 3QZ |
| Wells Road | BA2 3AN BA2 3AP BA2 3AR BA2 3AS BA2 3BB |
| Westmoreland Street | BA2 3HE |
| Widcombe Crescent | BA2 6AH |
| Widcombe Hill | BA2 6AA BA2 6AD BA2 6AE BA2 6AR BA2 6ED |
| Widcombe Parade | BA2 4JT |
| Widcombe Terrace | BA2 6AJ |
Transport near Widcombe
- FAQ
- Price Paid By Year
- Property Type Price
Frequently asked questions about Widcombe
What is the average price for a property for sale in Widcombe?
The average price for a property for sale in Widcombe is £687,716. This amount is 25% higher than the average price in Bath. There are 5,972 property listings for sale in Widcombe.
What streets have the most expensive properties for sale in Widcombe?
The streets with the most expensive properties for sale in Widcombe are 65 Prior Park Road at an average of £3,300,000, Prospect Road at an average of £3,250,000 and Sunnybank at an average of £1,812,500.
What streets have the most affordable properties for sale in Widcombe?
The streets with the most affordable properties for sale in Widcombe are Summerlays Court at an average of £142,000, Lower Bristol Road at an average of £217,142 and Summerlays Place at an average of £257,500.
Which train stations are available in or near Widcombe?
Some of the train stations available in or near Widcombe are Bath Spa, Oldfield Park and Freshford.
Property Price Paid in Widcombe by Year
The average sold property price by year was:
| Year | Average Sold Price | Price Change |
Sold Properties
|
|---|---|---|---|
| 2025 | £628,819 | -19% |
69 Properties |
| 2024 | £748,505 | 11% |
93 Properties |
| 2023 | £668,332 | 6% |
82 Properties |
| 2022 | £625,868 | 3% |
78 Properties |
| 2021 | £606,767 | -3% |
123 Properties |
| 2020 | £623,158 | 12% |
67 Properties |
| 2019 | £549,005 | -15% |
90 Properties |
| 2018 | £631,685 | 10% |
63 Properties |
| 2017 | £571,654 | 6% |
80 Properties |
| 2016 | £539,563 | 9% |
85 Properties |
| 2015 | £491,291 | 6% |
105 Properties |
| 2014 | £462,309 | -2% |
105 Properties |
| 2013 | £471,131 | 16% |
106 Properties |
| 2012 | £394,170 | -3% |
65 Properties |
| 2011 | £405,212 | 8% |
97 Properties |
| 2010 | £371,941 | 19% |
80 Properties |
| 2009 | £302,596 | -21% |
85 Properties |
| 2008 | £366,846 | 2% |
74 Properties |
| 2007 | £360,085 | 3% |
138 Properties |
| 2006 | £347,644 | 15% |
154 Properties |
| 2005 | £293,961 | -3% |
122 Properties |
| 2004 | £304,036 | 12% |
115 Properties |
| 2003 | £266,255 | 10% |
135 Properties |
| 2002 | £238,990 | 18% |
154 Properties |
| 2001 | £194,991 | 21% |
144 Properties |
| 2000 | £153,545 | 10% |
92 Properties |
| 1999 | £138,418 | 11% |
122 Properties |
| 1998 | £123,183 | 17% |
129 Properties |
| 1997 | £102,178 | 11% |
151 Properties |
| 1996 | £91,081 | -14% |
126 Properties |
| 1995 | £103,381 | - |
101 Properties |
Property Price per Property Type in Widcombe
Here you can find historic sold price data in order to help with your property search.
The average Property Paid Price for specific property types in the last three years are:
| Property Type | Average Sold Price | Sold Properties |
|---|---|---|
| Semi Detached House | £1,002,053.00 | 28 Semi Detached Houses |
| Detached House | £1,759,850.00 | 20 Detached Houses |
| Terraced House | £652,836.00 | 129 Terraced Houses |
| Flat | £303,469.00 | 67 Flats |

