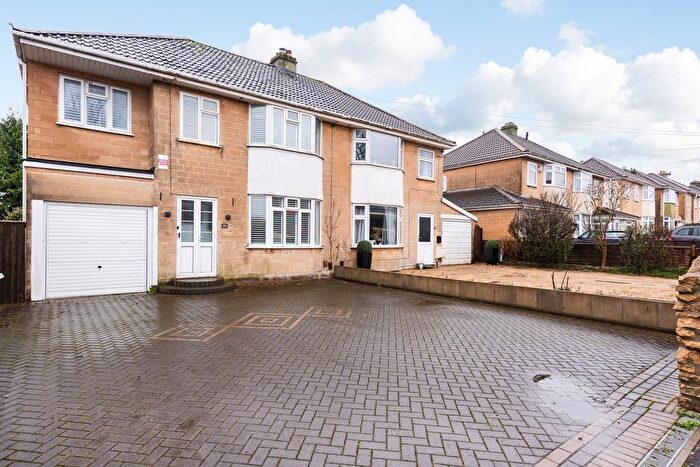
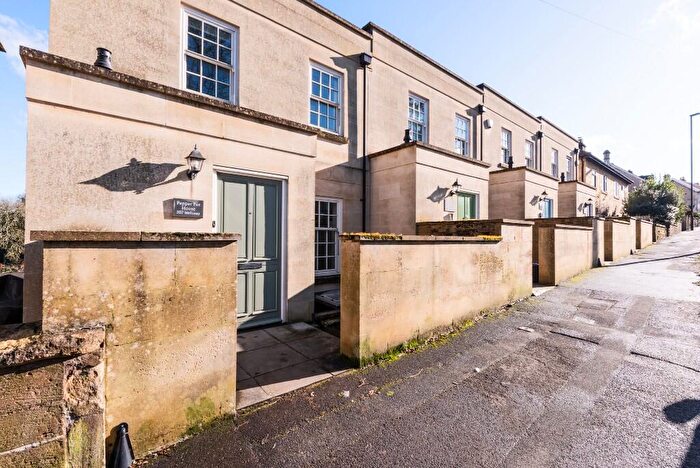
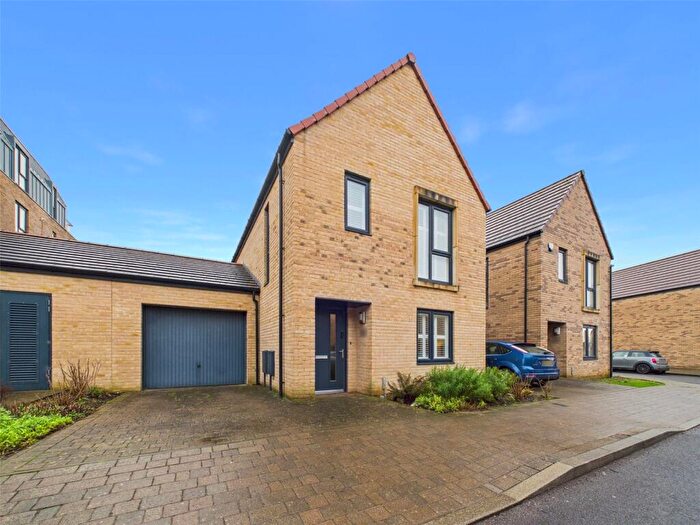
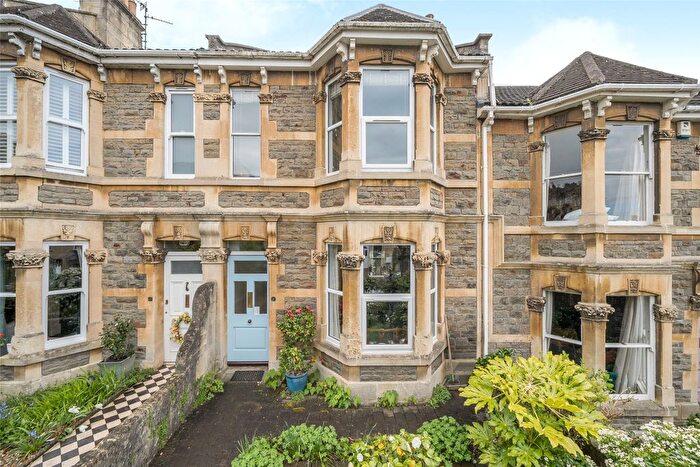
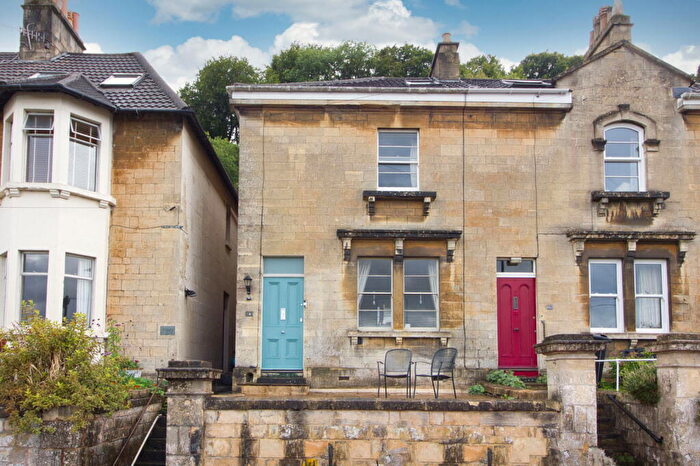
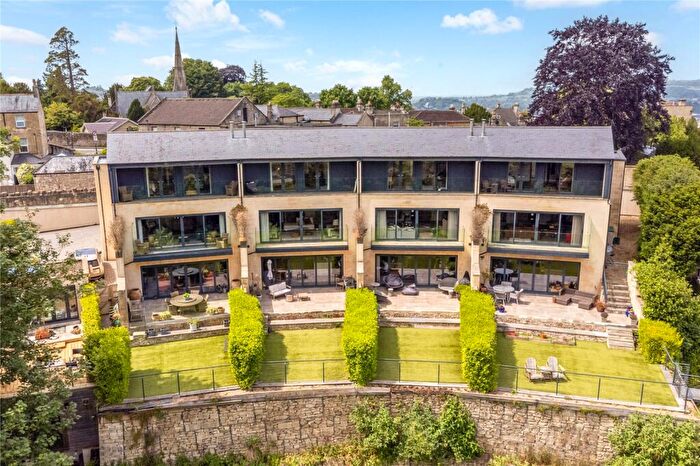
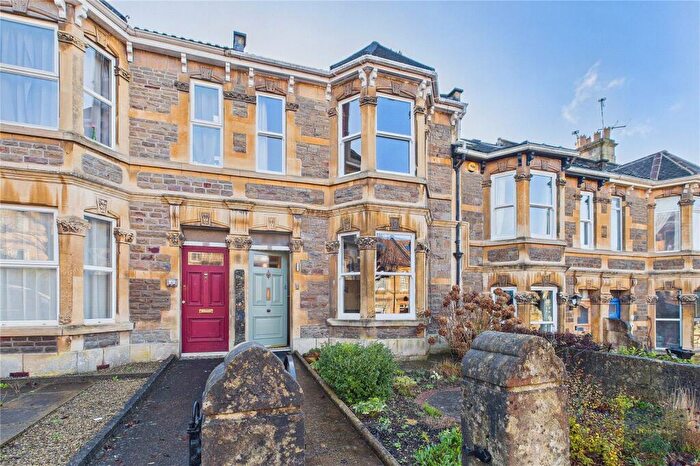
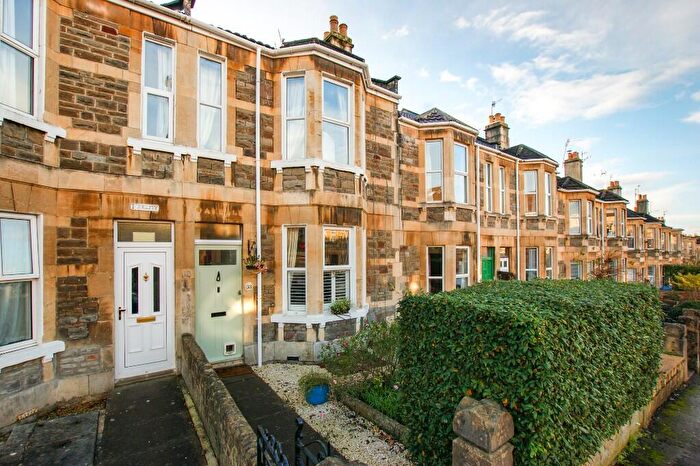
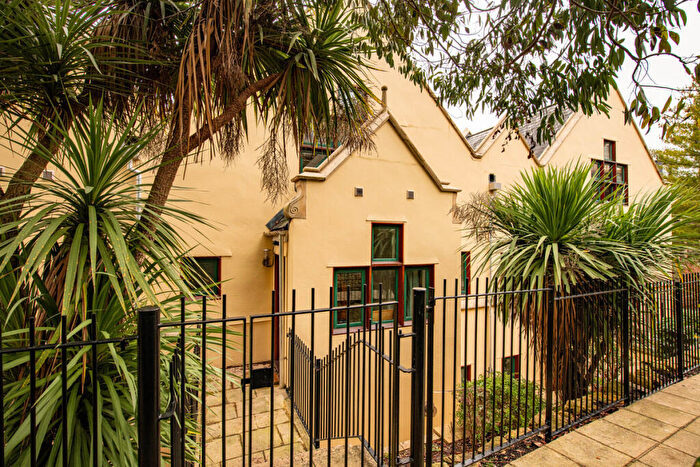
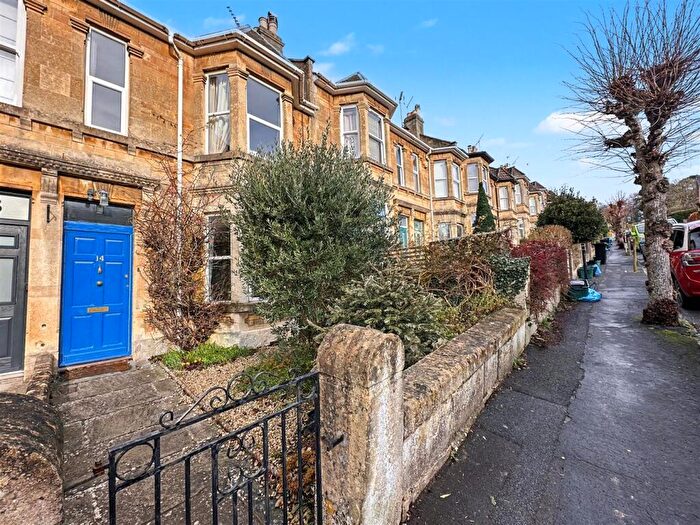
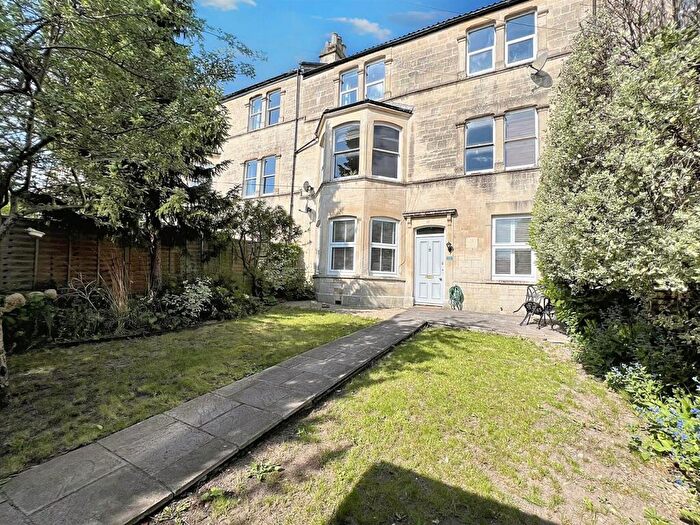
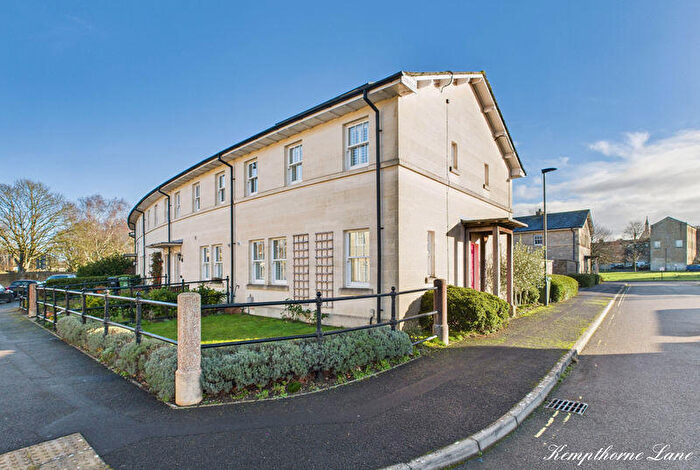
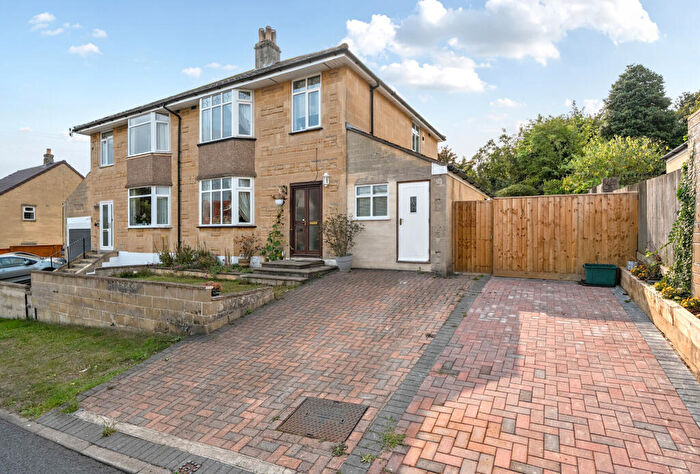
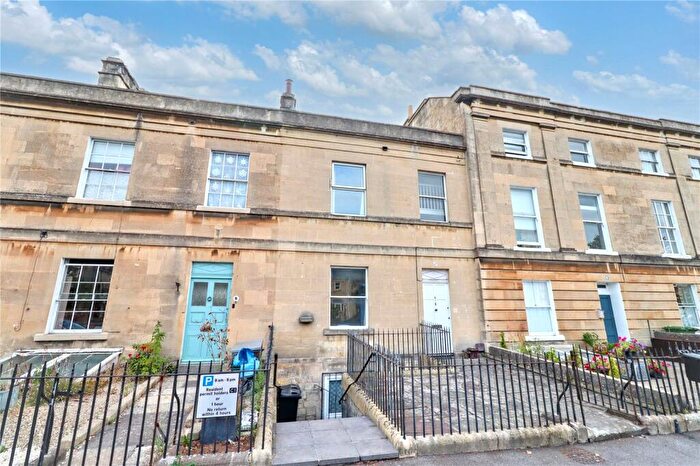
Houses for sale & to rent in Lyncombe, Bath
House Prices in Lyncombe
Properties in Lyncombe have an average house price of £689,324.00 and had 230 Property Transactions within the last 3 years¹.
Lyncombe is an area in Bath, Bath and North East Somerset with 2,113 households², where the most expensive property was sold for £2,175,000.00.
Properties for sale in Lyncombe
Roads and Postcodes in Lyncombe
Navigate through our locations to find the location of your next house in Lyncombe, Bath for sale or to rent.
| Streets | Postcodes |
|---|---|
| Beechen Cliff Road | BA2 4QR BA2 4QS BA2 4QT |
| Bloomfield Avenue | BA2 3AA BA2 3AB BA2 3AD BA2 3AE BA2 3AJ |
| Bloomfield Grove | BA2 2BZ |
| Bloomfield Park | BA2 2BX BA2 2BY |
| Bloomfield Road | BA2 2AD BA2 2AR BA2 2AS BA2 2AT BA2 2AU BA2 2AW BA2 2AX BA2 2AY BA2 2AZ BA2 2BA BA2 2NT BA2 2NU BA2 2NX BA2 2NY |
| Bradford Road | BA2 5BL |
| Bruton Avenue | BA2 4QJ |
| Byron Road | BA2 4RH |
| Castle Gardens | BA2 2AN |
| Chantry Mead Road | BA2 2DE |
| Chaucer Road | BA2 4QU BA2 4QX BA2 4QY BA2 4SL BA2 4SN BA2 4SY |
| Devonshire Buildings | BA2 4SP BA2 4SS BA2 4ST BA2 4SU |
| Devonshire Place | BA2 4SW |
| Devonshire Villas | BA2 4SX |
| Egerton Road | BA2 2DP |
| Elm Place | BA2 2AB |
| Englishcombe Lane | BA2 2ED |
| Entry Hill | BA2 5LT BA2 5LU BA2 5LX BA2 5LY BA2 5LZ BA2 5NA BA2 5NE BA2 5NQ |
| Entry Hill Drive | BA2 5NJ BA2 5NL |
| Entry Hill Gardens | BA2 5NR |
| Entry Hill Park | BA2 5ND |
| Entry Rise | BA2 5LR |
| Frome Road | BA2 2PW |
| Greenway Lane | BA2 4LJ BA2 4LW |
| Hansford Close | BA2 5LW |
| Hansford Square | BA2 5LH BA2 5LJ BA2 5LL BA2 5LN BA2 5LQ |
| Hatfield Road | BA2 2BD |
| Hensley Gardens | BA2 2DS |
| Hensley Road | BA2 2DR |
| Hill Avenue | BA2 5DB |
| Ivy Bank Park | BA2 5NF |
| Kempthorne Lane | BA2 5DX BA2 5RB BA2 5RS |
| Kipling Avenue | BA2 4RB BA2 4RD |
| Longfellow Avenue | BA2 4SH BA2 4SJ |
| Longthorne Place | BA2 5LG |
| Lynbrook Lane | BA2 5NB |
| Maple Gardens | BA2 3AG |
| Maple Grove | BA2 3AF |
| Midford Road | BA2 5RQ BA2 5RT BA2 5RU BA2 5RW BA2 5RX BA2 5RY BA2 5RZ |
| Milton Avenue | BA2 4QZ BA2 4RA |
| Old Frome Road | BA2 5RG BA2 5RH |
| Oldfield Road | BA2 3NA |
| Prospect Place | BA2 4QP |
| Quarry Close | BA2 5LP |
| Shakespeare Avenue | BA2 4RF BA2 4RG BA2 4RQ |
| Shelley Road | BA2 4RJ |
| St Lukes Road | BA2 2BB |
| Wells Road | BA2 3AH BA2 3AL |
| Wellsway | BA2 2AA BA2 4QL BA2 4QN BA2 4RR BA2 4RS BA2 4RT BA2 4RU BA2 4RX BA2 4RY BA2 4RZ BA2 4SD BA2 4SE BA2 5RJ BA2 5RL BA2 5RN |
| Westfield Close | BA2 2EA BA2 2EB |
Transport near Lyncombe
- FAQ
- Price Paid By Year
- Property Type Price
Frequently asked questions about Lyncombe
What is the average price for a property for sale in Lyncombe?
The average price for a property for sale in Lyncombe is £689,324. This amount is 26% higher than the average price in Bath. There are 1,402 property listings for sale in Lyncombe.
What streets have the most expensive properties for sale in Lyncombe?
The streets with the most expensive properties for sale in Lyncombe are Prospect Place at an average of £1,550,000, Entry Hill Drive at an average of £1,396,500 and Oldfield Road at an average of £1,350,000.
What streets have the most affordable properties for sale in Lyncombe?
The streets with the most affordable properties for sale in Lyncombe are Kempthorne Lane at an average of £309,089, Chantry Mead Road at an average of £343,500 and Devonshire Villas at an average of £377,500.
Which train stations are available in or near Lyncombe?
Some of the train stations available in or near Lyncombe are Bath Spa, Oldfield Park and Freshford.
Property Price Paid in Lyncombe by Year
The average sold property price by year was:
| Year | Average Sold Price | Price Change |
Sold Properties
|
|---|---|---|---|
| 2025 | £733,607 | 12% |
71 Properties |
| 2024 | £643,618 | -9% |
89 Properties |
| 2023 | £702,521 | 15% |
70 Properties |
| 2022 | £594,638 | -2% |
103 Properties |
| 2021 | £607,351 | 9% |
96 Properties |
| 2020 | £552,892 | -15% |
79 Properties |
| 2019 | £635,676 | 22% |
68 Properties |
| 2018 | £496,022 | -5% |
87 Properties |
| 2017 | £522,284 | -3% |
84 Properties |
| 2016 | £536,092 | 15% |
95 Properties |
| 2015 | £458,285 | 5% |
84 Properties |
| 2014 | £435,876 | 3% |
133 Properties |
| 2013 | £423,733 | 6% |
91 Properties |
| 2012 | £396,260 | 2% |
67 Properties |
| 2011 | £386,815 | -4% |
93 Properties |
| 2010 | £402,117 | 24% |
93 Properties |
| 2009 | £306,853 | -13% |
91 Properties |
| 2008 | £347,532 | -2% |
63 Properties |
| 2007 | £355,351 | 12% |
148 Properties |
| 2006 | £313,710 | -0,3% |
166 Properties |
| 2005 | £314,782 | -5% |
90 Properties |
| 2004 | £330,174 | 19% |
112 Properties |
| 2003 | £268,317 | 2% |
107 Properties |
| 2002 | £261,655 | 23% |
112 Properties |
| 2001 | £200,668 | -1% |
96 Properties |
| 2000 | £203,634 | 21% |
88 Properties |
| 1999 | £160,128 | 19% |
105 Properties |
| 1998 | £129,303 | 12% |
101 Properties |
| 1997 | £114,312 | -7% |
126 Properties |
| 1996 | £122,126 | 22% |
119 Properties |
| 1995 | £95,858 | - |
69 Properties |
Property Price per Property Type in Lyncombe
Here you can find historic sold price data in order to help with your property search.
The average Property Paid Price for specific property types in the last three years are:
| Property Type | Average Sold Price | Sold Properties |
|---|---|---|
| Semi Detached House | £819,839.00 | 70 Semi Detached Houses |
| Detached House | £877,223.00 | 50 Detached Houses |
| Terraced House | £715,504.00 | 60 Terraced Houses |
| Flat | £287,290.00 | 50 Flats |

