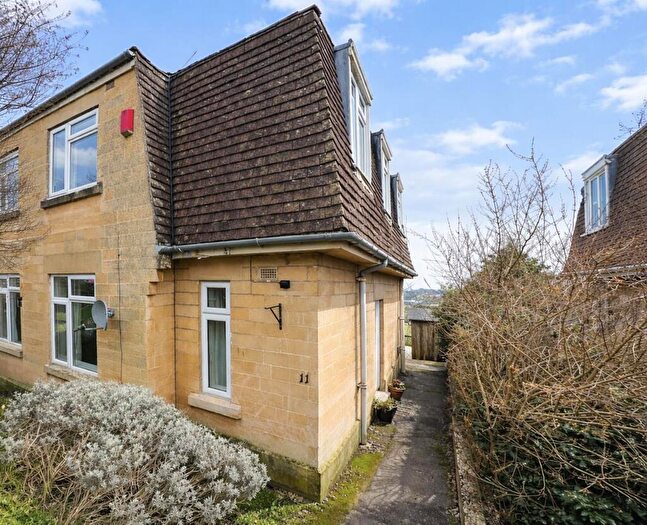
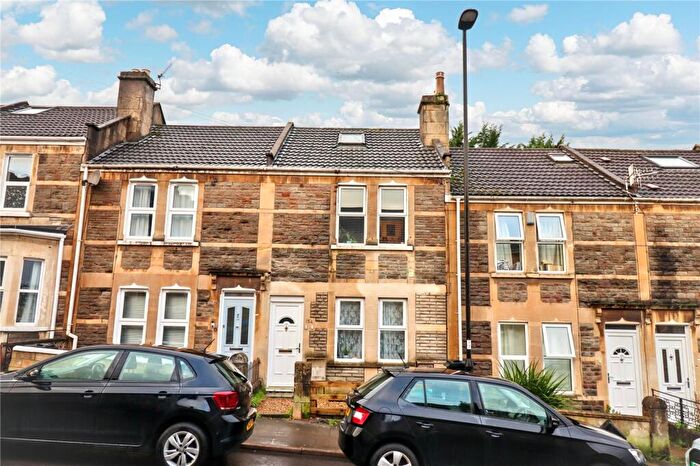
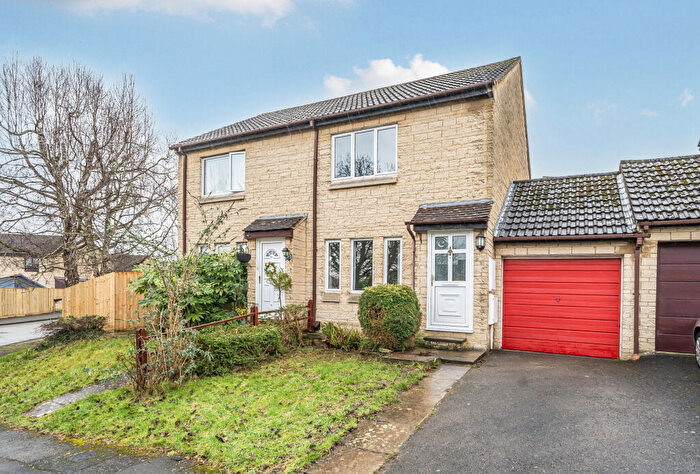
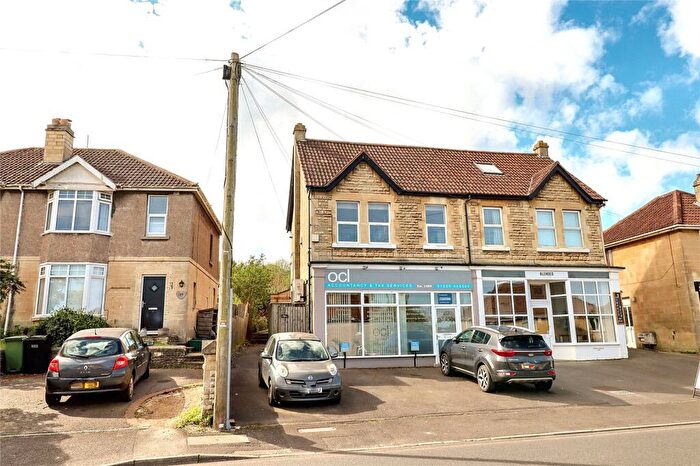
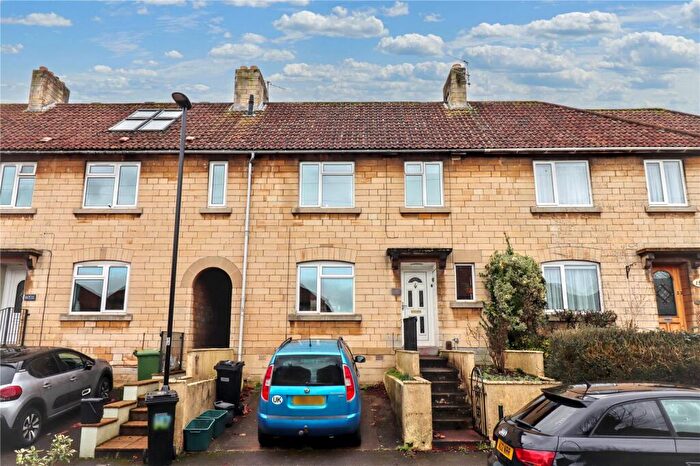
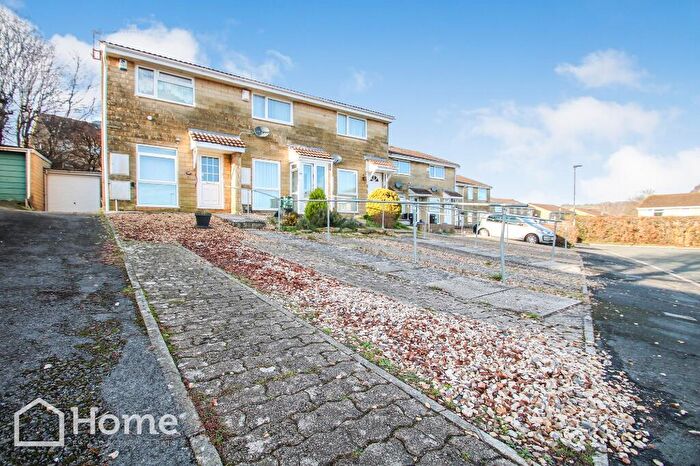
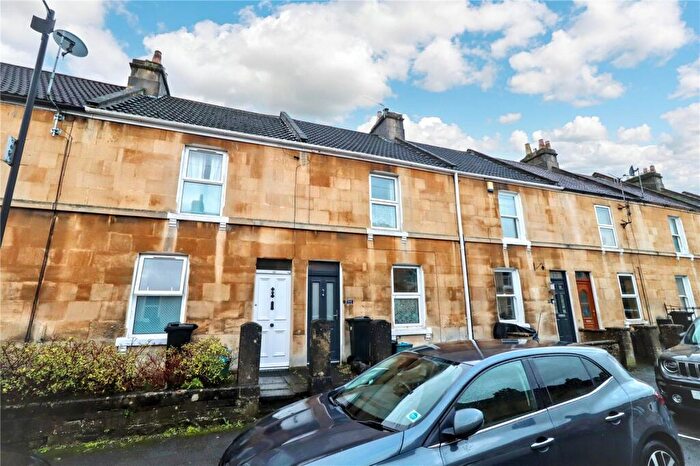
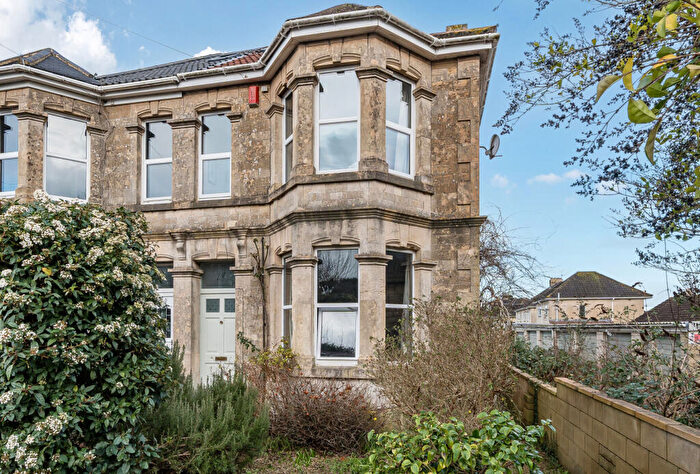
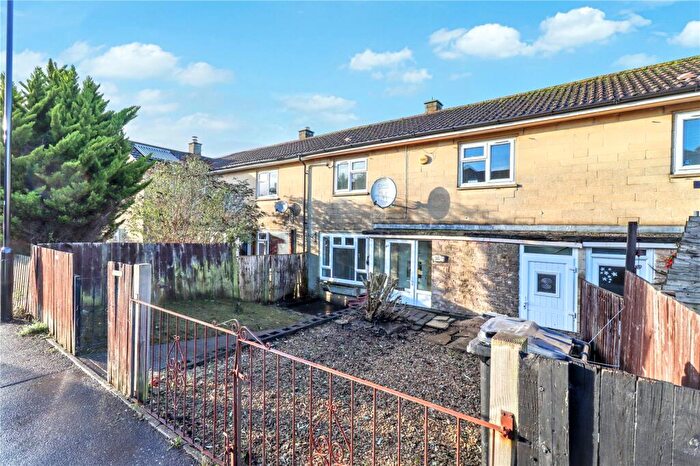
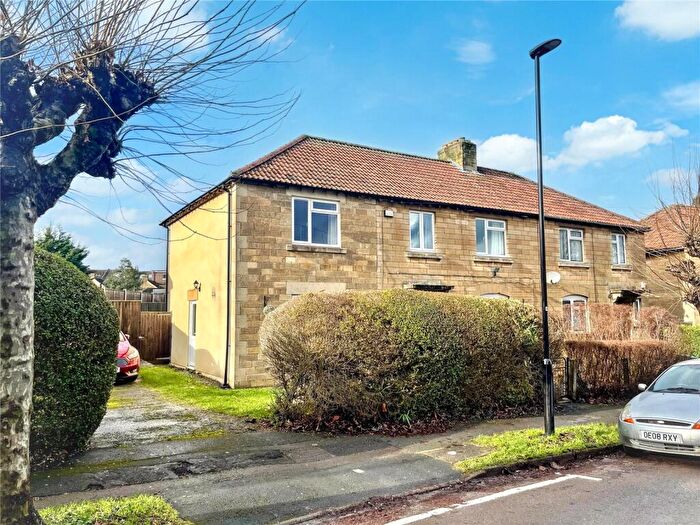
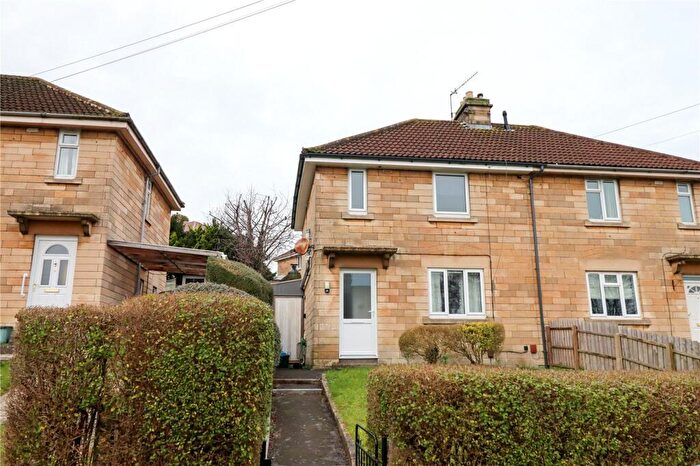
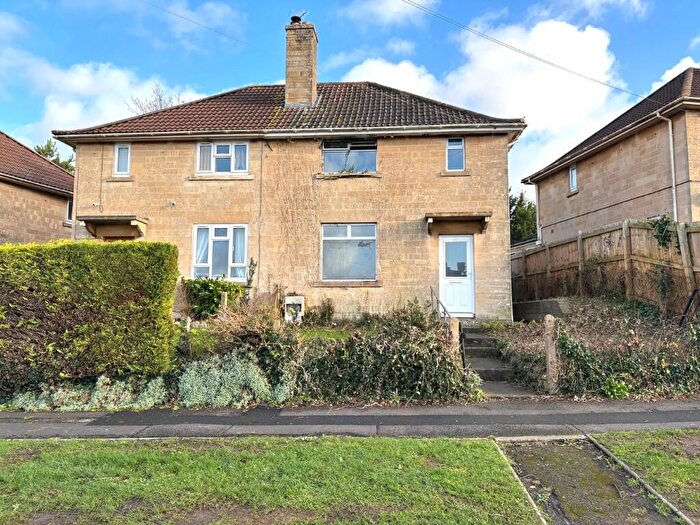
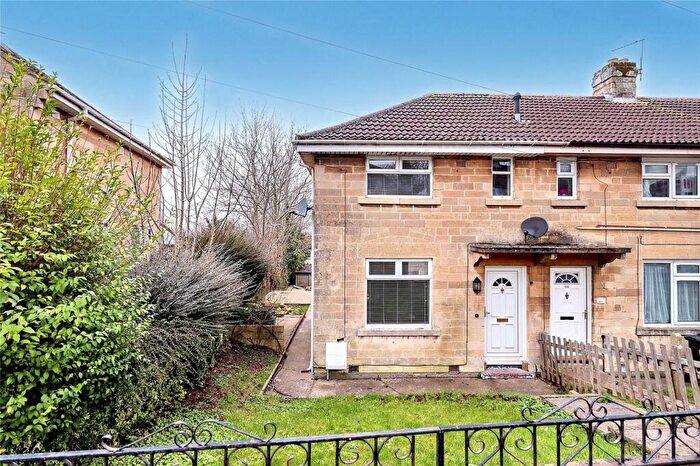
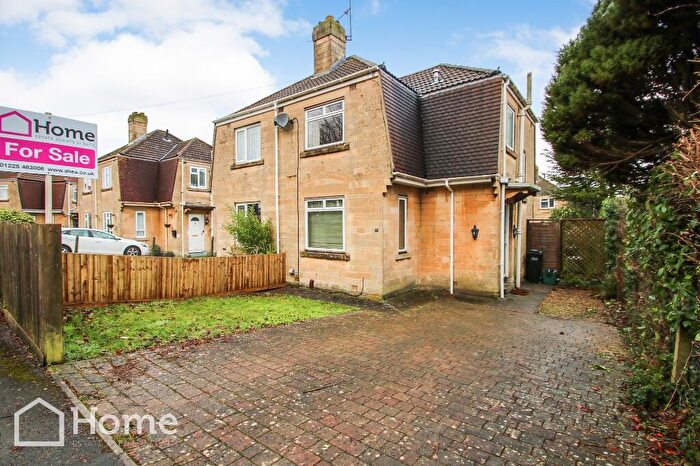
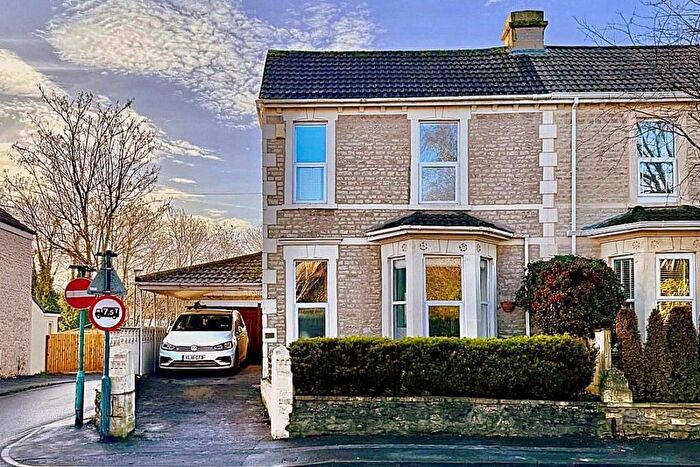
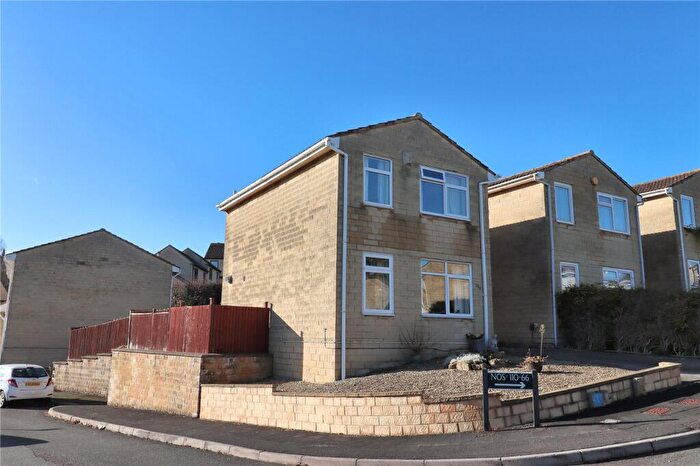
Houses for sale & to rent in Southdown, Bath
House Prices in Southdown
Properties in Southdown have an average house price of £361,953.00 and had 178 Property Transactions within the last 3 years¹.
Southdown is an area in Bath, Bath and North East Somerset with 2,330 households², where the most expensive property was sold for £650,000.00.
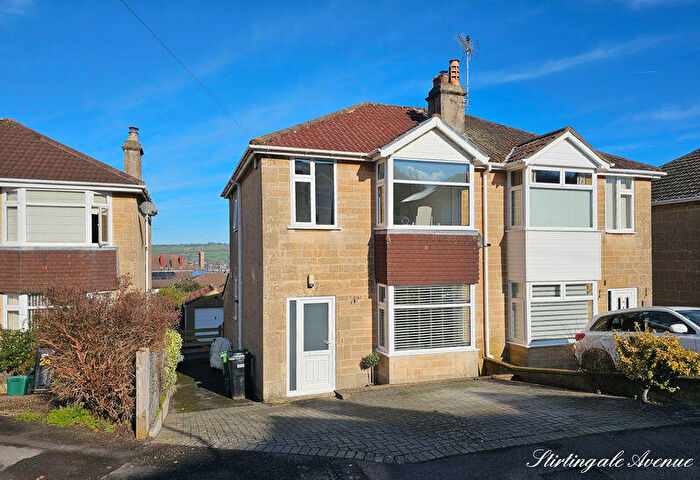
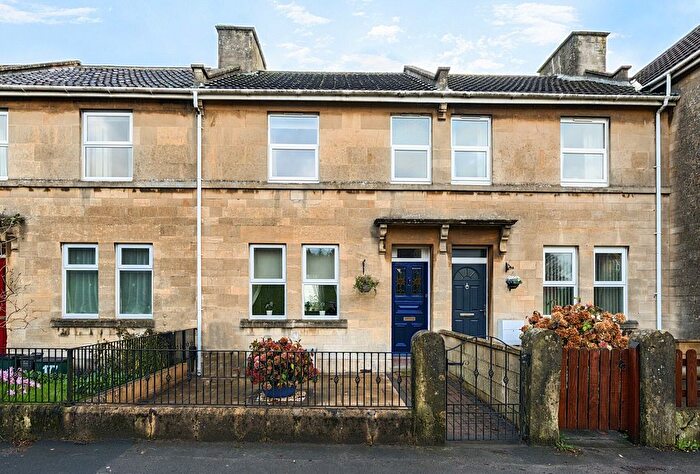
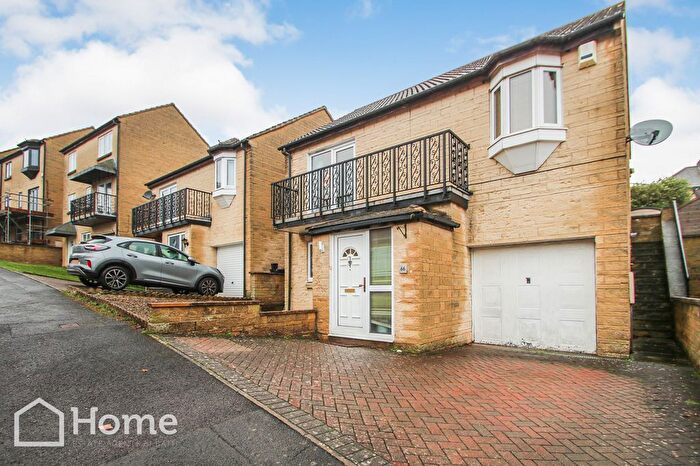
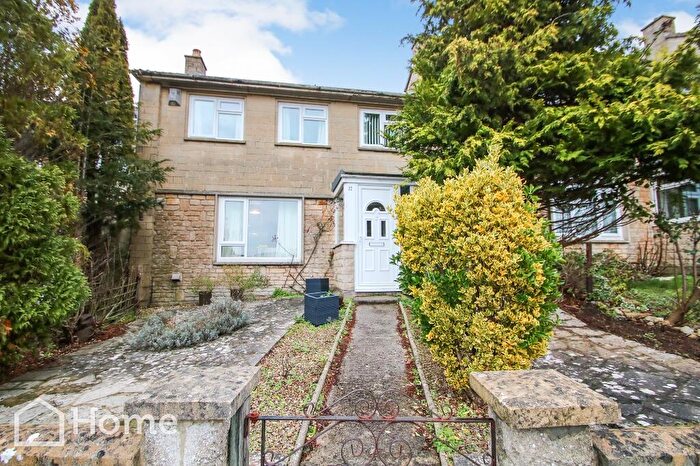
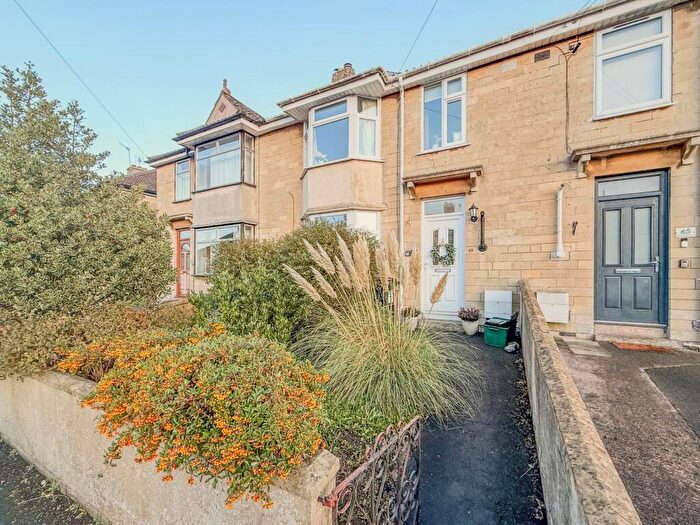
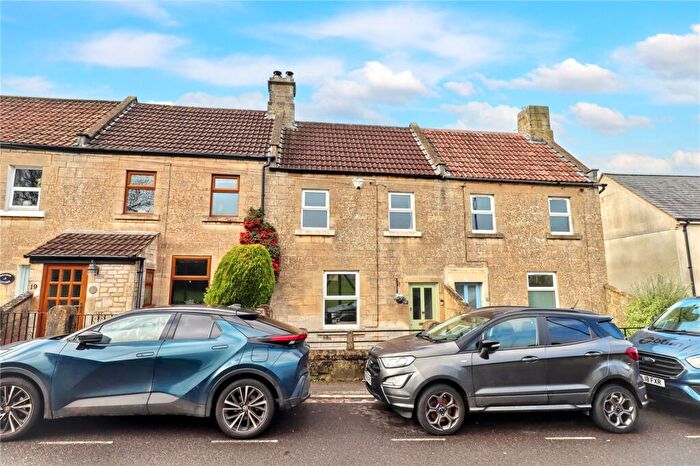
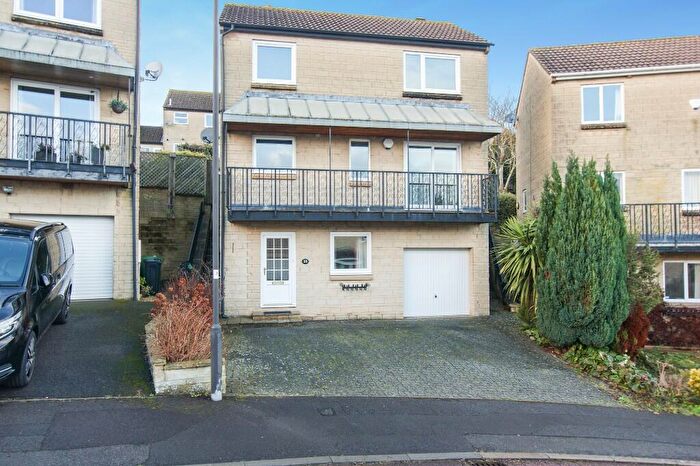
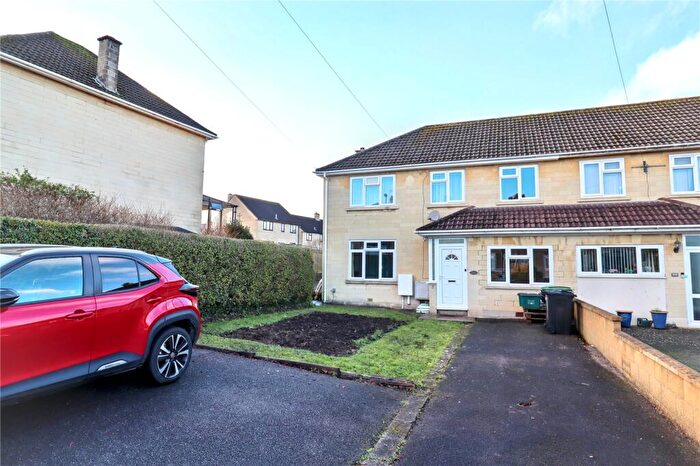
Properties for sale in Southdown
Roads and Postcodes in Southdown
Navigate through our locations to find the location of your next house in Southdown, Bath for sale or to rent.
| Streets | Postcodes |
|---|---|
| Alderley Road | BA2 1LB |
| Belmore Gardens | BA2 1HU |
| Blackmore Drive | BA2 1JN BA2 1JW |
| Blagdon Park | BA2 1PH BA2 1PQ |
| Briars Court | BA2 1NB |
| Burford Close | BA2 1JF |
| Claude Avenue | BA2 1AF |
| Elliston Drive | BA2 1LU |
| Englishcombe Lane | BA2 2EP BA2 2ER BA2 2ES BA2 2ET BA2 2EW |
| Englishcombe Rise | BA2 2RL |
| Glebe Road | BA2 1JB |
| Haycombe Drive | BA2 1PF BA2 1PG BA2 1PN BA2 1PP BA2 1PR BA2 1PW |
| Haycombe Lane | BA2 2FL |
| Hillcrest Drive | BA2 1HD BA2 1HE BA2 1HF |
| Kingsway | BA2 2NH |
| Langdon Road | BA2 1LS BA2 1LT BA2 1ND |
| Loxley Gardens | BA2 1HS |
| Lymore Avenue | BA2 1AU BA2 1BD |
| Lymore Gardens | BA2 1FE |
| Lytton Gardens | BA2 1LW |
| Marsden Road | BA2 2LL BA2 2LQ BA2 2LW |
| Melrose Grove | BA2 1HZ |
| Minerva Gardens | BA2 1JP |
| Mount Grove | BA2 1JS |
| Mount Road | BA2 1LD BA2 1LE BA2 1LF BA2 1LG BA2 1LH BA2 1LJ BA2 1LL BA2 1LN BA2 1LQ BA2 1NH BA2 1NZ |
| Mount View | BA2 1JX |
| Oriel Grove | BA2 1JD BA2 1JE |
| Padfield Close | BA2 1NA |
| Padleigh Hill | BA2 9DW |
| Parry Close | BA2 1JR |
| Rosewarn Close | BA2 1PB BA2 1PJ |
| Roundhill Grove | BA2 1JT BA2 1JU |
| Roundhill Park | BA2 1NL BA2 1NN |
| Rowacres | BA2 2LH |
| Sabin Close | BA2 2EY |
| Sladebrook Road | BA2 1LP BA2 1LR |
| Southdown Avenue | BA2 1HX BA2 1HY |
| Southdown Road | BA2 1HJ BA2 1HL BA2 1HP BA2 1HR BA2 1HW BA2 1JG BA2 1JH BA2 1JJ BA2 1JL BA2 1JQ |
| Teddington Close | BA2 1HT |
| The Circle | BA2 1JA |
| The Hollow | BA2 1NE BA2 1NG BA2 1NJ BA2 1NQ BA2 1PA |
| Wedmore Close | BA2 1HG |
| Wedmore Park | BA2 1JY BA2 1JZ BA2 1LA |
| Whiteway Road | BA2 2RA BA2 2RF BA2 2RG BA2 2RH BA2 2RJ |
Transport near Southdown
- FAQ
- Price Paid By Year
- Property Type Price
Frequently asked questions about Southdown
What is the average price for a property for sale in Southdown?
The average price for a property for sale in Southdown is £361,953. This amount is 34% lower than the average price in Bath. There are 990 property listings for sale in Southdown.
What streets have the most expensive properties for sale in Southdown?
The streets with the most expensive properties for sale in Southdown are Sladebrook Road at an average of £505,214, Elliston Drive at an average of £486,250 and Mount Grove at an average of £478,333.
What streets have the most affordable properties for sale in Southdown?
The streets with the most affordable properties for sale in Southdown are Wedmore Park at an average of £267,714, Rosewarn Close at an average of £274,000 and Haycombe Drive at an average of £294,428.
Which train stations are available in or near Southdown?
Some of the train stations available in or near Southdown are Oldfield Park, Bath Spa and Freshford.
Property Price Paid in Southdown by Year
The average sold property price by year was:
| Year | Average Sold Price | Price Change |
Sold Properties
|
|---|---|---|---|
| 2025 | £383,832 | 7% |
55 Properties |
| 2024 | £355,886 | 2% |
71 Properties |
| 2023 | £347,096 | -7% |
52 Properties |
| 2022 | £370,751 | 12% |
82 Properties |
| 2021 | £327,555 | 5% |
96 Properties |
| 2020 | £310,586 | -2% |
61 Properties |
| 2019 | £316,987 | -2% |
66 Properties |
| 2018 | £322,291 | 6% |
69 Properties |
| 2017 | £303,237 | 8% |
73 Properties |
| 2016 | £278,709 | 12% |
78 Properties |
| 2015 | £245,247 | -3% |
100 Properties |
| 2014 | £252,036 | 19% |
92 Properties |
| 2013 | £203,014 | -4% |
91 Properties |
| 2012 | £211,853 | 10% |
52 Properties |
| 2011 | £190,873 | -0,1% |
69 Properties |
| 2010 | £191,146 | 4% |
47 Properties |
| 2009 | £183,137 | -6% |
52 Properties |
| 2008 | £194,170 | -8% |
40 Properties |
| 2007 | £210,602 | 12% |
102 Properties |
| 2006 | £185,182 | 3% |
133 Properties |
| 2005 | £179,271 | 8% |
67 Properties |
| 2004 | £164,331 | 7% |
84 Properties |
| 2003 | £152,767 | 18% |
78 Properties |
| 2002 | £125,293 | 10% |
101 Properties |
| 2001 | £112,830 | 14% |
90 Properties |
| 2000 | £96,831 | 17% |
74 Properties |
| 1999 | £80,433 | 11% |
100 Properties |
| 1998 | £71,805 | 12% |
77 Properties |
| 1997 | £63,364 | 1% |
91 Properties |
| 1996 | £62,961 | 10% |
85 Properties |
| 1995 | £56,734 | - |
60 Properties |
Property Price per Property Type in Southdown
Here you can find historic sold price data in order to help with your property search.
The average Property Paid Price for specific property types in the last three years are:
| Property Type | Average Sold Price | Sold Properties |
|---|---|---|
| Semi Detached House | £358,836.00 | 90 Semi Detached Houses |
| Detached House | £483,261.00 | 22 Detached Houses |
| Terraced House | £328,933.00 | 65 Terraced Houses |
| Flat | £120,000.00 | 1 Flat |

