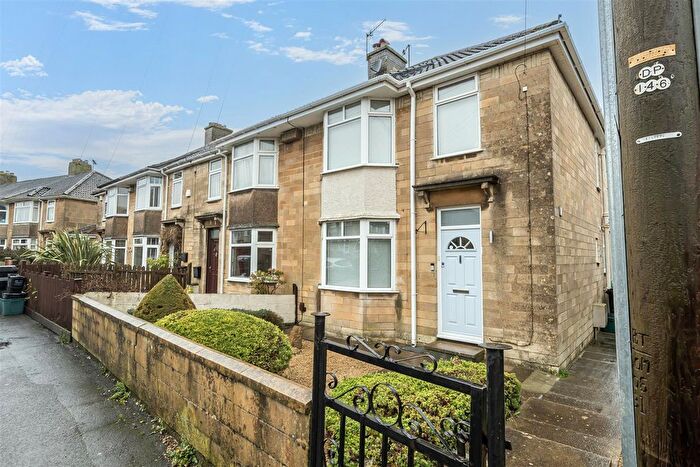
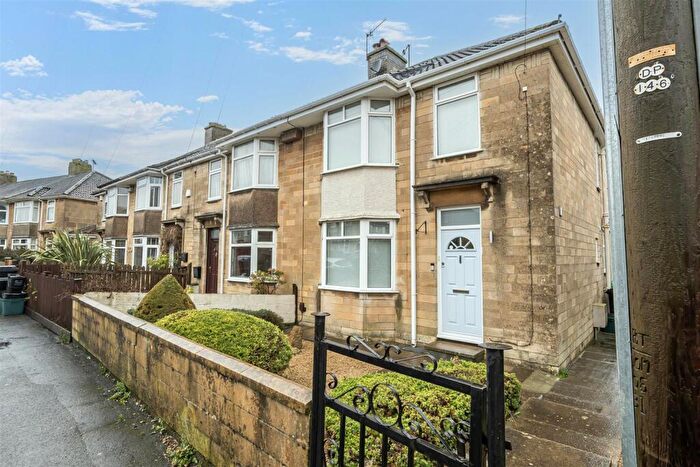
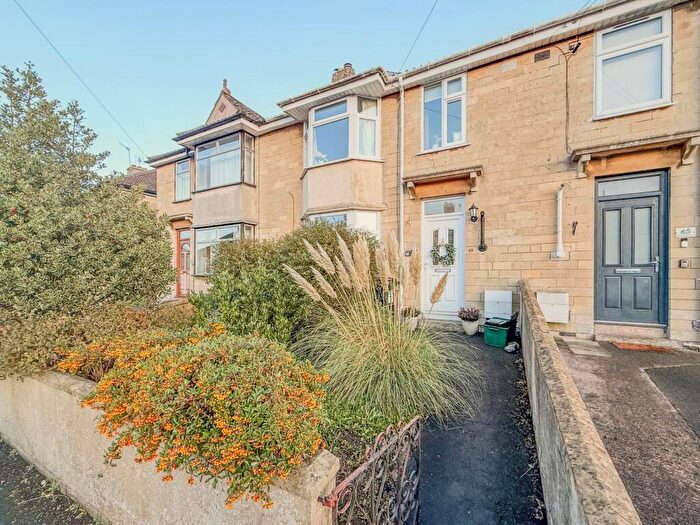
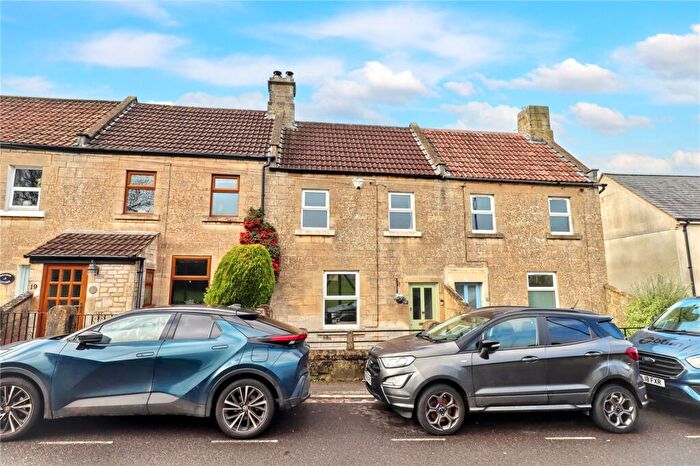
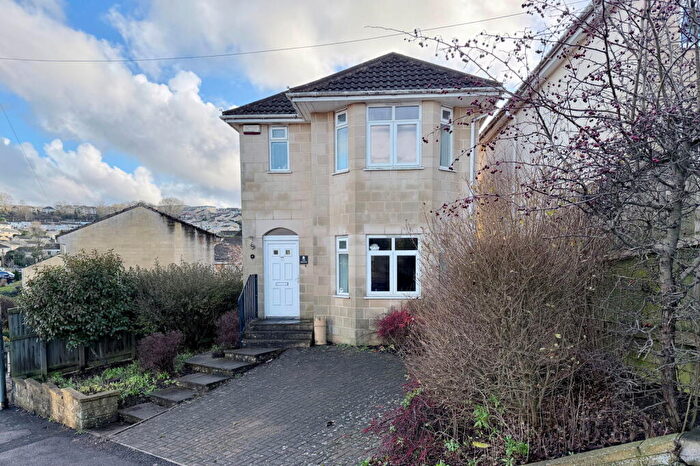
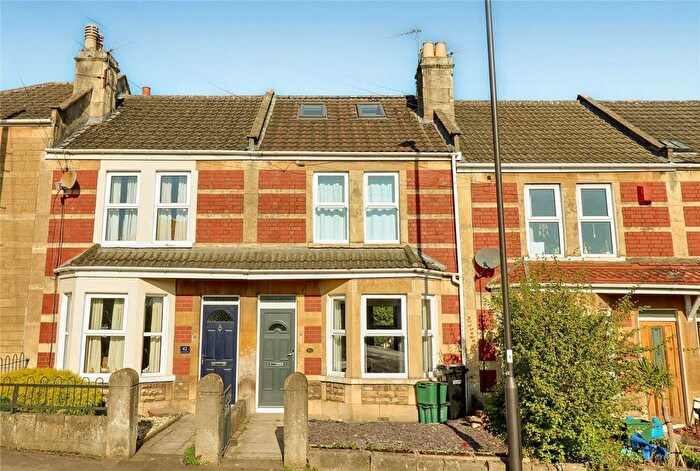
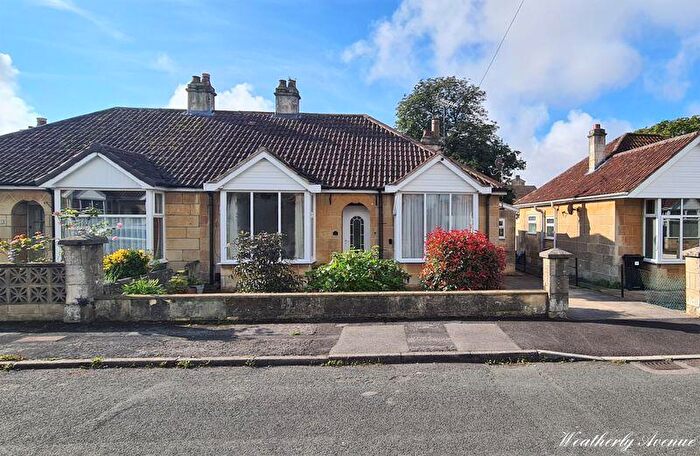
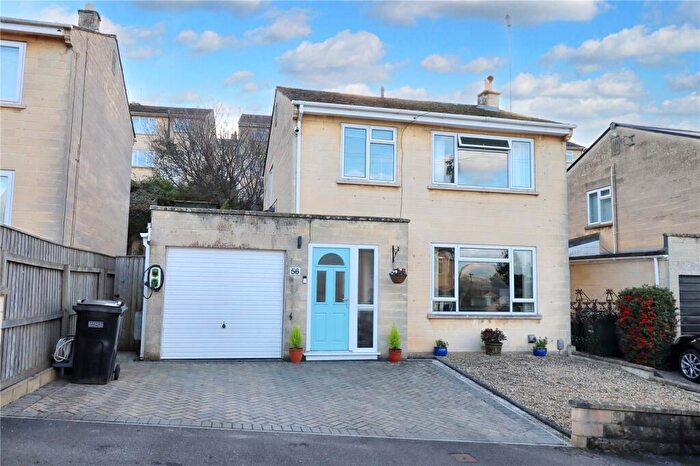
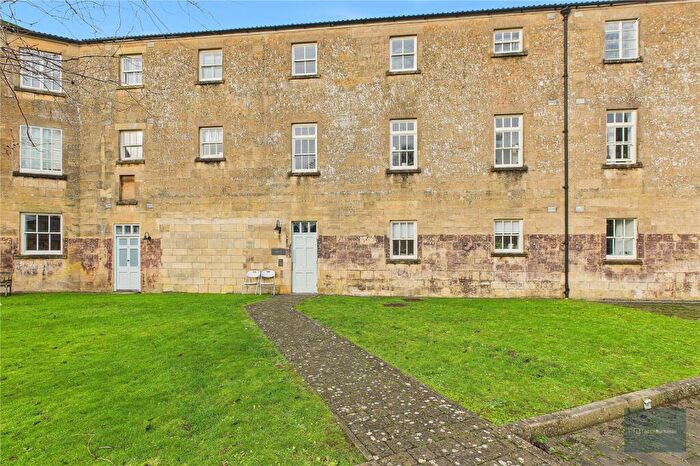
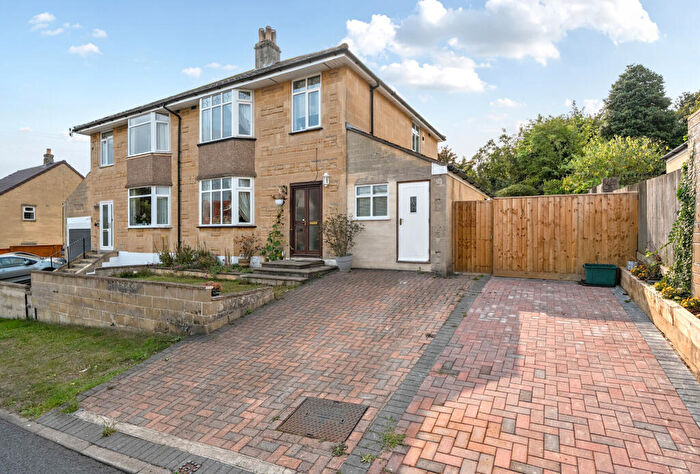
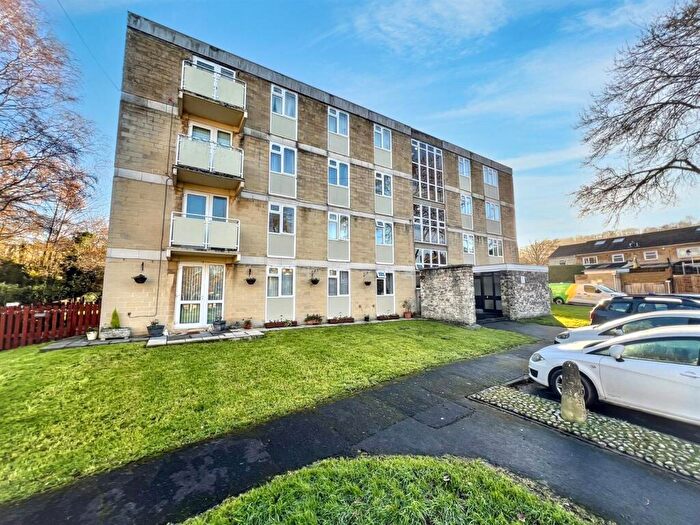
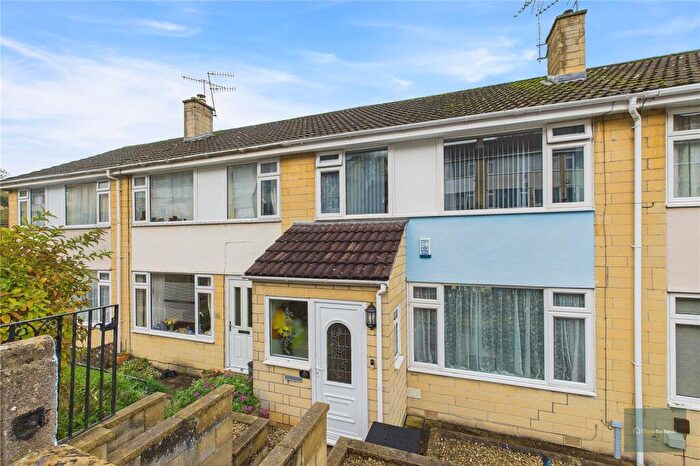
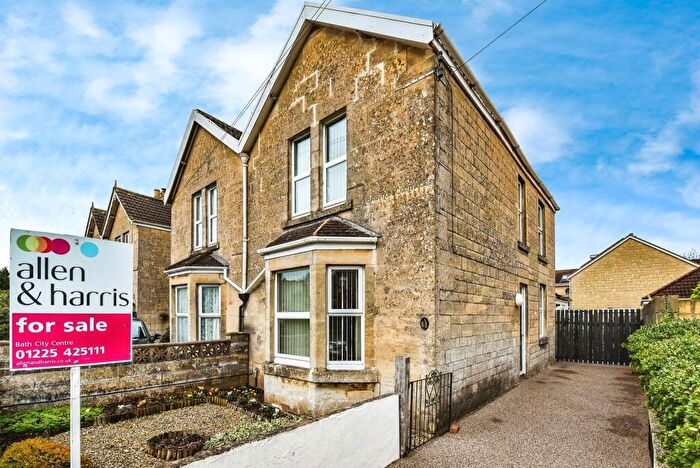
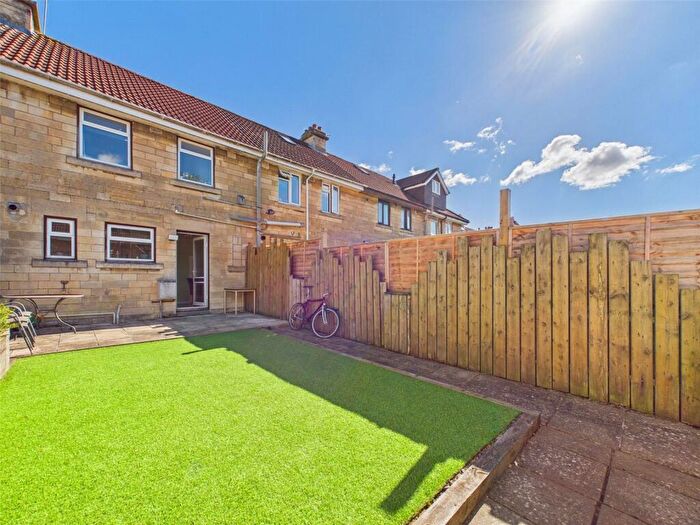
Houses for sale & to rent in Odd Down, Bath
House Prices in Odd Down
Properties in Odd Down have an average house price of £358,611.00 and had 217 Property Transactions within the last 3 years¹.
Odd Down is an area in Bath, Bath and North East Somerset with 2,469 households², where the most expensive property was sold for £1,200,000.00.
Properties for sale in Odd Down
Roads and Postcodes in Odd Down
Navigate through our locations to find the location of your next house in Odd Down, Bath for sale or to rent.
| Streets | Postcodes |
|---|---|
| Abingdon Gardens | BA2 2UY |
| Abingdon Place | BA2 2RW |
| Alder Way | BA2 2DU |
| Ambleside Road | BA2 2LP BA2 2LR |
| Banwell Road | BA2 2UH BA2 2UJ |
| Barrow Road | BA2 2TD BA2 2TE |
| Bloomfield Crescent | BA2 2BE |
| Bloomfield Drive | BA2 2BG BA2 2BH BA2 2BQ |
| Bloomfield Rise | BA2 2BL BA2 2BN |
| Bloomfield Rise North | BA2 2BJ |
| Bloomfield Road | BA2 2NZ BA2 2PA BA2 2PB BA2 2PD BA2 2PY |
| Breachwood View | BA2 2TX |
| Burnt House Road | BA2 2AQ |
| Canons Close | BA2 2LN |
| Cardinal Close | BA2 2AE |
| Chelwood Drive | BA2 2PR BA2 2PS |
| Clara Cross Lane | BA2 5RP BA2 5SR |
| Clare Gardens | BA2 2SD |
| Clarks Way | BA2 2TR BA2 2AF |
| Colbourne Road | BA2 2SE |
| Combe Hay Lane | BA2 8PA |
| Corston View | BA2 2PH BA2 2PL BA2 2PQ BA2 2PJ |
| Cranmore Place | BA2 2UP BA2 2UW |
| Eastover Grove | BA2 2SY BA2 2SZ |
| Edgeworth Road | BA2 2LS BA2 2LT BA2 2LU BA2 2LY |
| Fosse Gardens | BA2 2UQ |
| Frome Road | BA2 2PP BA2 2QA BA2 2QB BA2 2QD BA2 2QE BA2 2QF BA2 2QG BA2 5RE BA2 5RF |
| Fullers Way | BA2 2UG |
| Georgian View | BA2 2LZ |
| Gregorys Grove | BA2 2AG |
| Hazel Way | BA2 2DX |
| Heather Drive | BA2 2BW |
| Holly Drive | BA2 2BT |
| Kingsfield | BA2 2NA BA2 2NB |
| Lodge Gardens | BA2 2RT |
| Lympsham Green | BA2 2UL BA2 2UN |
| Marsden Road | BA2 2LJ |
| Meadow Drive | BA2 2BU |
| Mendip Gardens | BA2 2UT |
| Middlewood Close | BA2 2TU |
| Midford Road | BA2 5RR |
| Odins Road | BA2 2TL BA2 2TN BA2 2TW |
| Old Fosse Road | BA2 2BR BA2 2SP BA2 2SR BA2 2SS BA2 2ST BA2 2SU BA2 2SW BA2 2SN |
| Old Quarry | BA2 2BP |
| Oolite Grove | BA2 2UF |
| Oolite Road | BA2 2UU |
| Orchid Drive | BA2 2TS |
| Padleigh Hill | BA2 9DP |
| Poplar Road | BA2 2AJ |
| Red Lion Lane | BA2 2FN |
| Ridge Green Close | BA2 2EG |
| Rush Hill | BA2 2QH BA2 2QN BA2 2QS BA2 2QT BA2 2QU BA2 2QW BA2 2QX BA2 2QZ |
| Shickle Grove | BA2 2TP |
| Somerdale Avenue | BA2 2PG |
| Somerdale View | BA2 2QQ |
| Spruce Way | BA2 2DY |
| Stanway Close | BA2 2UR |
| Sulis Manor Road | BA2 2AL |
| The Beeches | BA2 2UX |
| The Green | BA2 2TH BA2 2TJ BA2 2TQ |
| Upper Bloomfield Road | BA2 2RU BA2 2RY BA2 2RZ BA2 2SA BA2 2SB BA2 2RX |
| Vernham Grove | BA2 2TA BA2 2TB |
| Vernhamwood Close | BA2 2TT |
| Wansdyke Road | BA2 2TF BA2 2TG |
| Weatherly Avenue | BA2 2PF |
| Wellsway | BA2 2TY BA2 2TZ BA2 2UB BA2 2UD BA2 2UE BA2 2UA |
| Wellsway Close | BA2 2US |
| Wellsway Park | BA2 2DD |
| Westwood View | BA2 2SF |
| Willow Close | BA2 2DZ |
| BA2 2SG |
Transport near Odd Down
- FAQ
- Price Paid By Year
- Property Type Price
Frequently asked questions about Odd Down
What is the average price for a property for sale in Odd Down?
The average price for a property for sale in Odd Down is £358,611. This amount is 35% lower than the average price in Bath. There are 915 property listings for sale in Odd Down.
What streets have the most expensive properties for sale in Odd Down?
The streets with the most expensive properties for sale in Odd Down are Bloomfield Crescent at an average of £1,200,000, Breachwood View at an average of £625,000 and Bloomfield Road at an average of £606,000.
What streets have the most affordable properties for sale in Odd Down?
The streets with the most affordable properties for sale in Odd Down are Vernhamwood Close at an average of £241,250, Corston View at an average of £261,125 and Willow Close at an average of £267,625.
Which train stations are available in or near Odd Down?
Some of the train stations available in or near Odd Down are Oldfield Park, Bath Spa and Freshford.
Property Price Paid in Odd Down by Year
The average sold property price by year was:
| Year | Average Sold Price | Price Change |
Sold Properties
|
|---|---|---|---|
| 2025 | £376,172 | 5% |
70 Properties |
| 2024 | £359,070 | 5% |
71 Properties |
| 2023 | £342,008 | -6% |
76 Properties |
| 2022 | £361,853 | 10% |
86 Properties |
| 2021 | £326,843 | 3% |
100 Properties |
| 2020 | £315,757 | 4% |
60 Properties |
| 2019 | £302,649 | 5% |
79 Properties |
| 2018 | £287,688 | -7% |
73 Properties |
| 2017 | £307,634 | 11% |
85 Properties |
| 2016 | £273,570 | 3% |
99 Properties |
| 2015 | £265,153 | 12% |
102 Properties |
| 2014 | £234,251 | 8% |
101 Properties |
| 2013 | £215,725 | -0,2% |
98 Properties |
| 2012 | £216,126 | 13% |
77 Properties |
| 2011 | £187,953 | -7% |
72 Properties |
| 2010 | £202,038 | 7% |
73 Properties |
| 2009 | £188,818 | -6% |
101 Properties |
| 2008 | £200,911 | -12% |
88 Properties |
| 2007 | £224,438 | 14% |
160 Properties |
| 2006 | £192,194 | 2% |
120 Properties |
| 2005 | £187,571 | 5% |
106 Properties |
| 2004 | £177,402 | 13% |
88 Properties |
| 2003 | £154,635 | 17% |
107 Properties |
| 2002 | £129,070 | 13% |
123 Properties |
| 2001 | £111,912 | 12% |
108 Properties |
| 2000 | £98,627 | 8% |
61 Properties |
| 1999 | £90,698 | 24% |
102 Properties |
| 1998 | £68,920 | -0,2% |
195 Properties |
| 1997 | £69,081 | 10% |
185 Properties |
| 1996 | £62,501 | 13% |
106 Properties |
| 1995 | £54,234 | - |
43 Properties |
Property Price per Property Type in Odd Down
Here you can find historic sold price data in order to help with your property search.
The average Property Paid Price for specific property types in the last three years are:
| Property Type | Average Sold Price | Sold Properties |
|---|---|---|
| Semi Detached House | £367,843.00 | 76 Semi Detached Houses |
| Detached House | £473,576.00 | 26 Detached Houses |
| Terraced House | £333,389.00 | 107 Terraced Houses |
| Flat | £234,625.00 | 8 Flats |

