
Houses for sale & to rent in MK45 1ST, Conway Drive, Flitwick, Bedford
House Prices in MK45 1ST, Conway Drive, Flitwick
Properties in MK45 1ST have no sales history available within the last 3 years. MK45 1ST is a postcode in Conway Drive located in Flitwick, an area in Bedford, Bedfordshire, with 2 households².
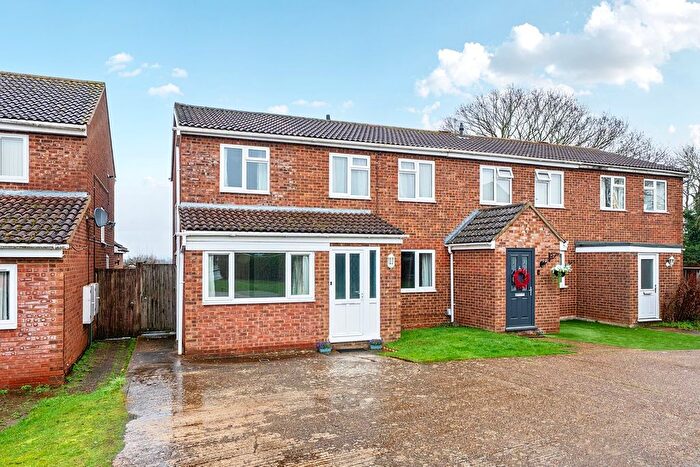
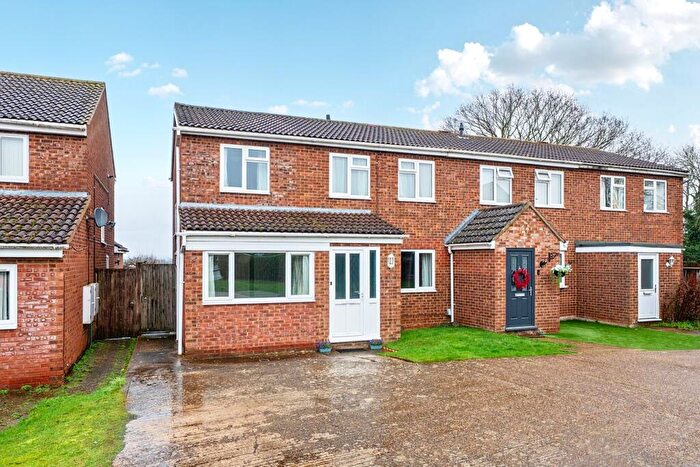
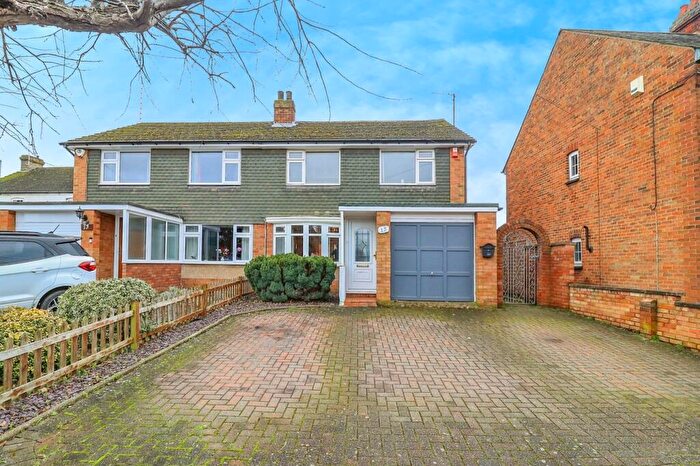
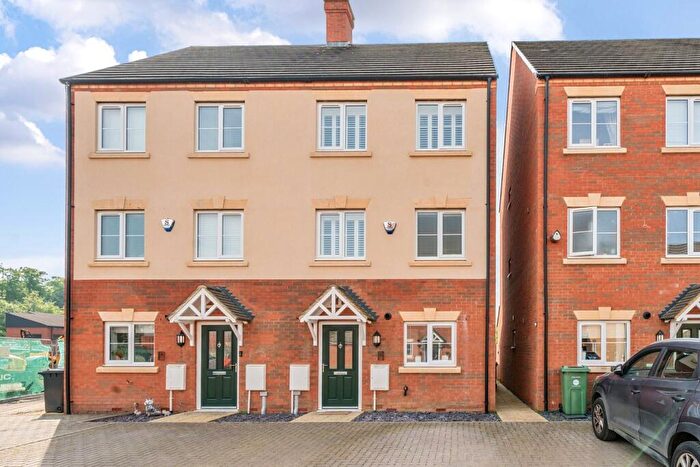
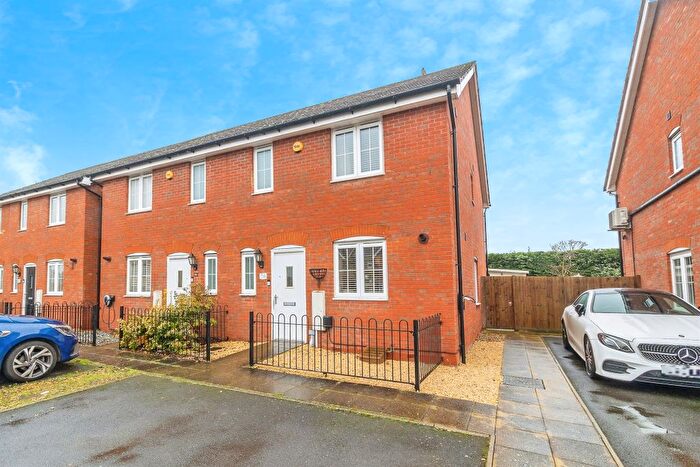
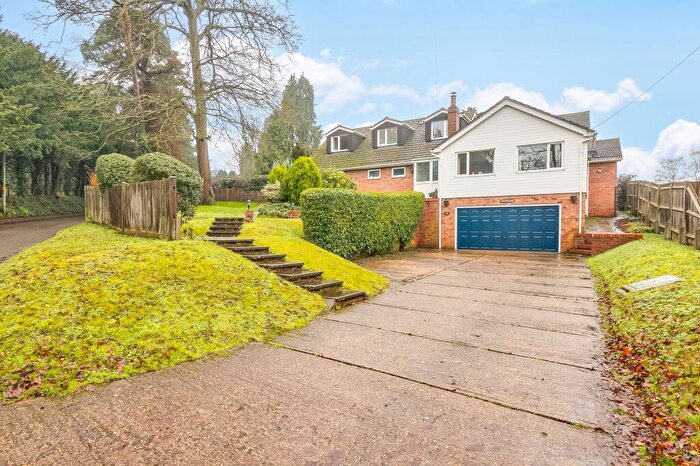
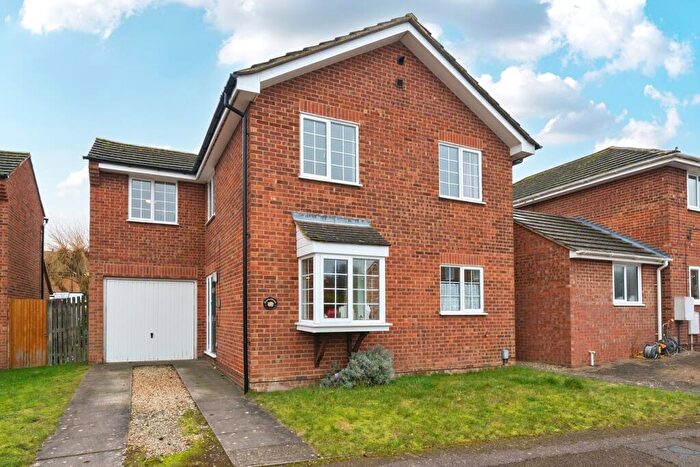
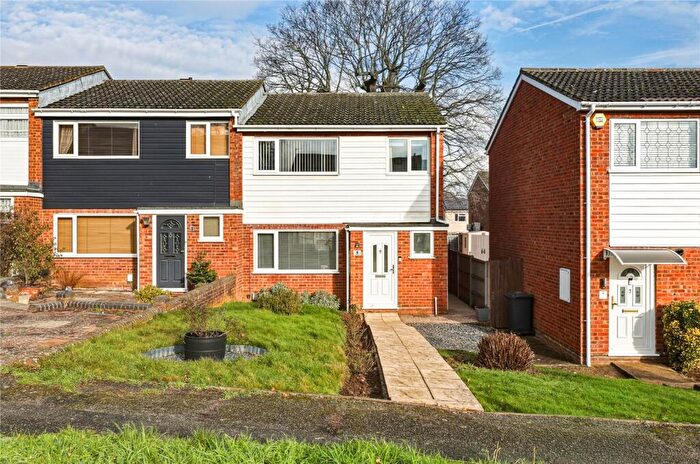
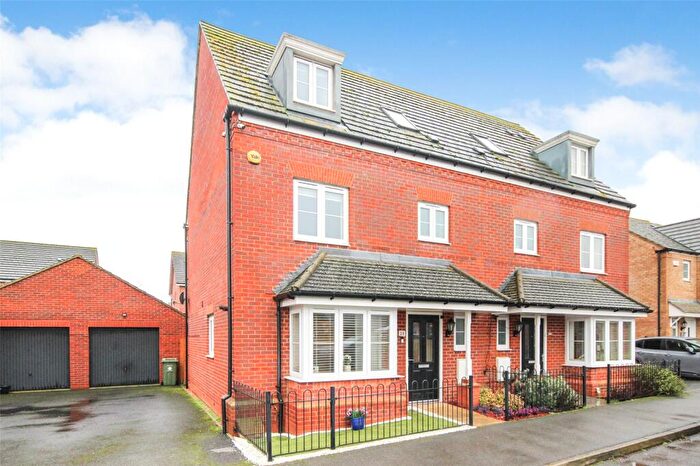
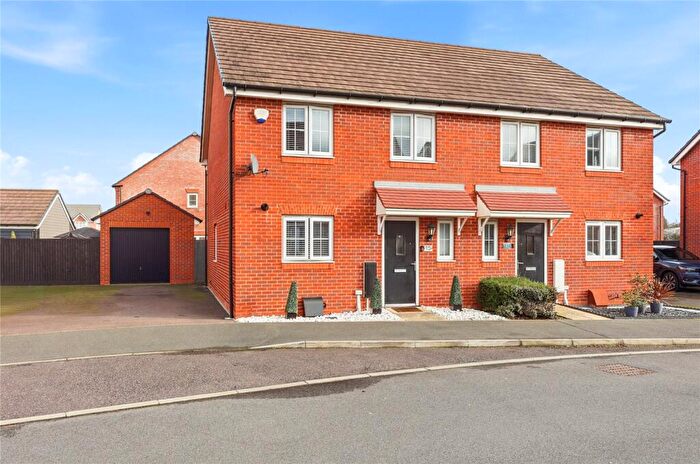
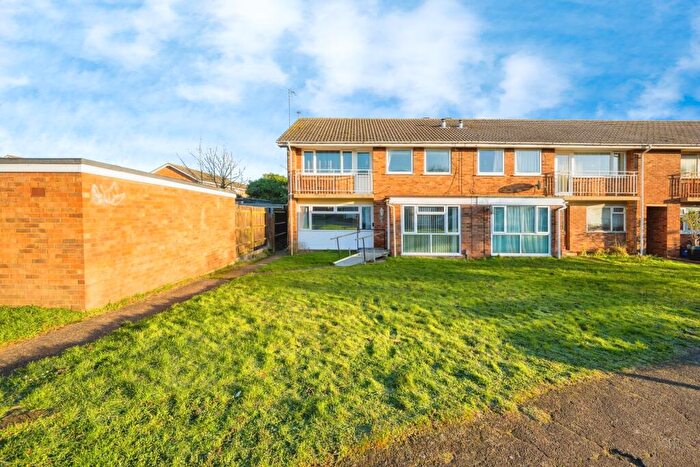
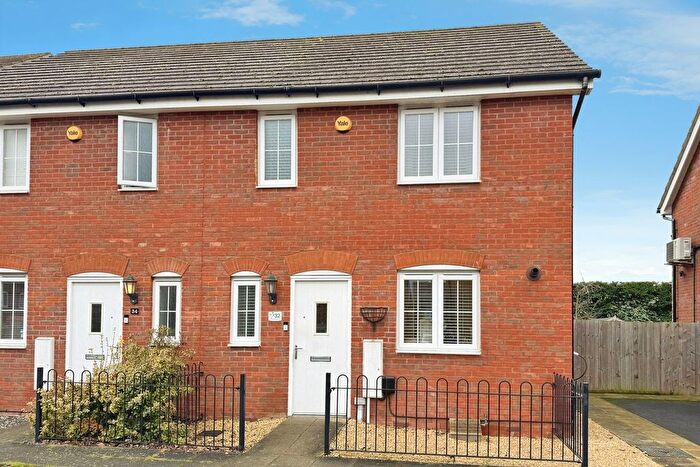
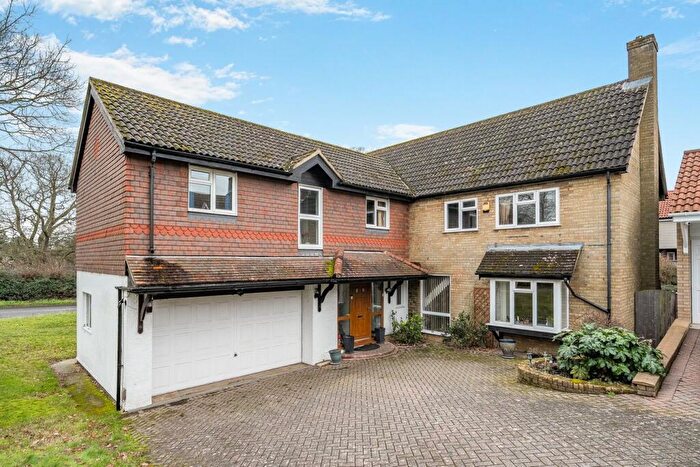
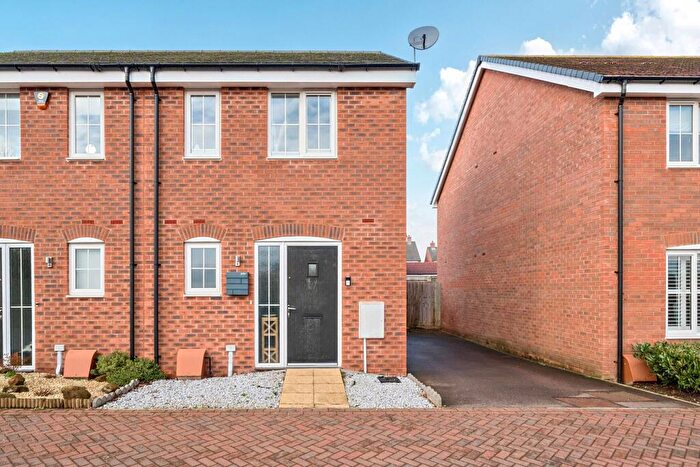
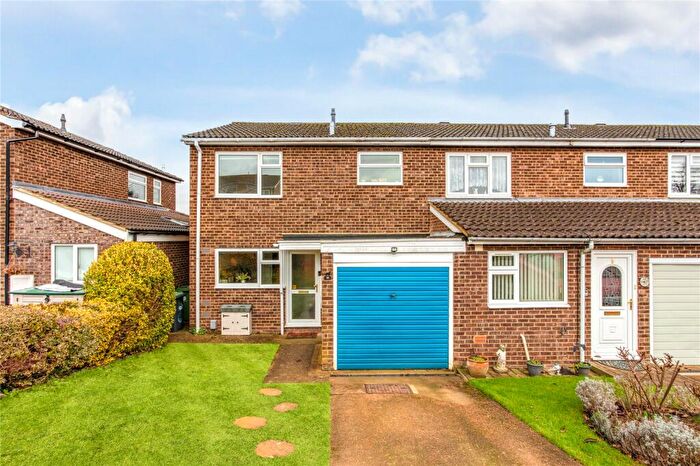
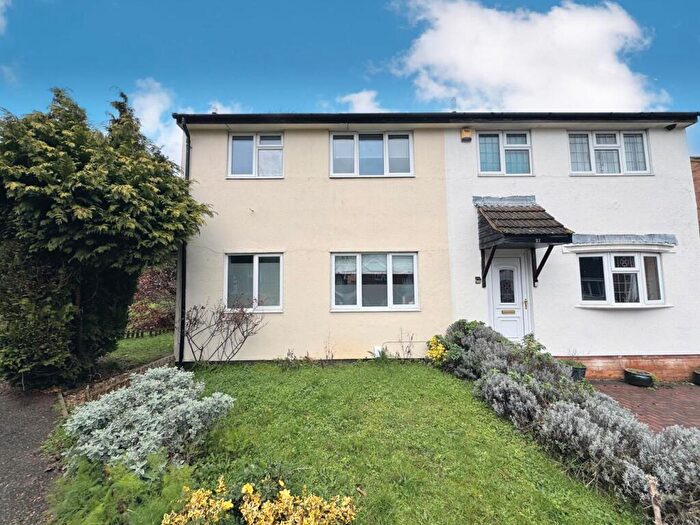
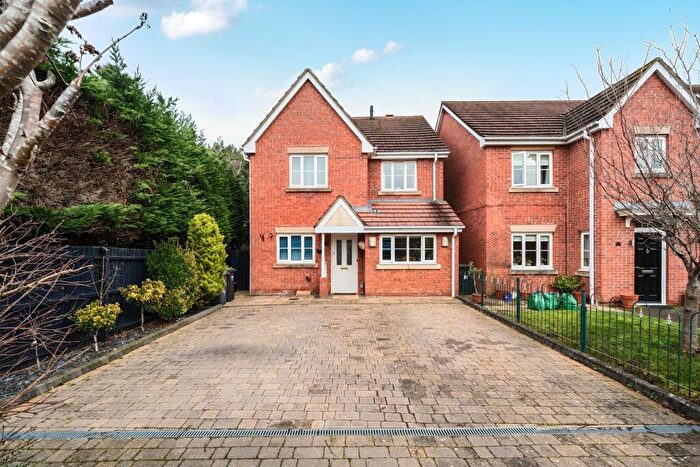
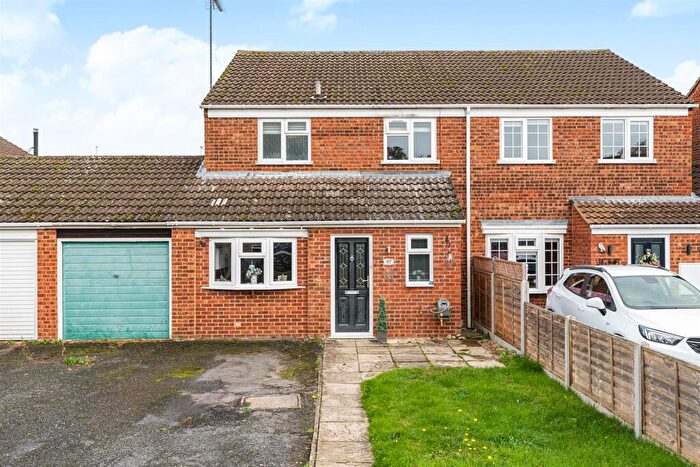
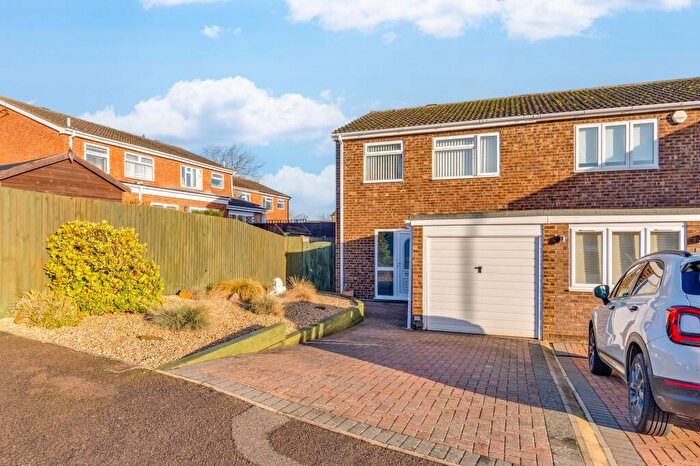
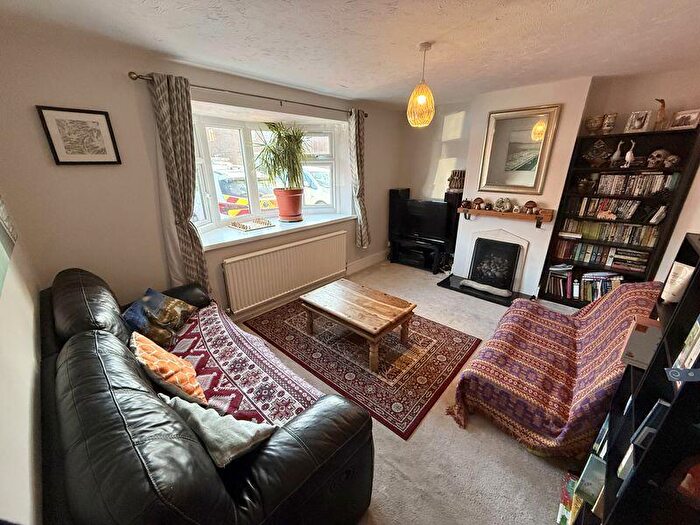
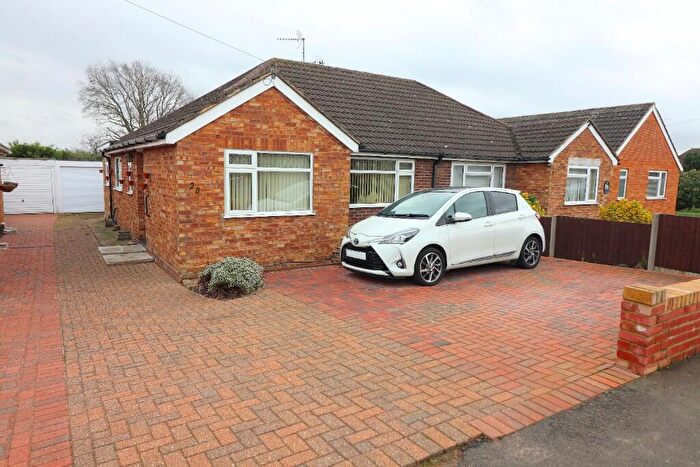
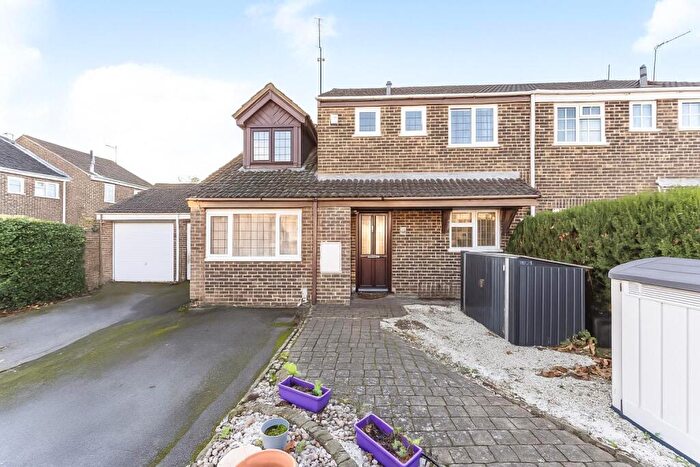
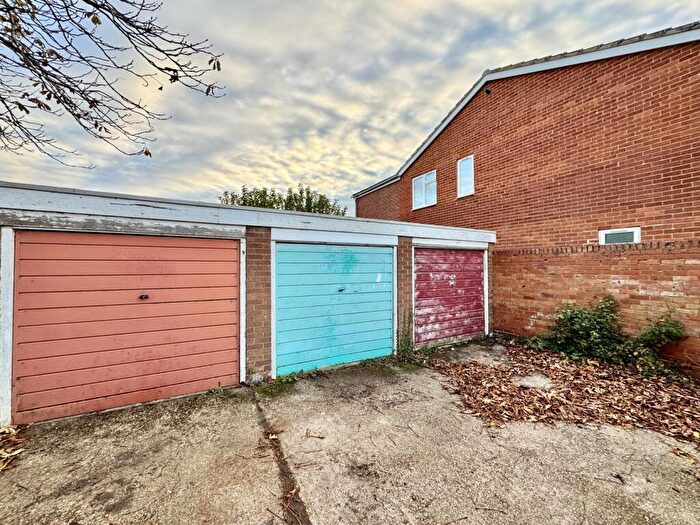
Properties for sale near MK45 1ST, Conway Drive
![]()
If you are looking to sell your house, let it out, or receive a property valuation, an expert can help you.
Click the button below to get started.

Price Paid in Conway Drive, MK45 1ST, Flitwick
50 Conway Drive, MK45 1ST, Flitwick Bedford
Property 50 has been sold 3 times. The last time it was sold was in 07/09/2009 and the sold price was £239,000.00.
This detached house, sold as a freehold on 07/09/2009, is a 105 sqm detached house with an EPC rating of D.
| Date | Price | Property Type | Tenure | Classification |
|---|---|---|---|---|
| 07/09/2009 | £239,000.00 | Detached House | freehold | Established Building |
| 13/12/2001 | £167,500.00 | Detached House | freehold | Established Building |
| 20/12/1996 | £96,000.00 | Detached House | freehold | Established Building |
52 Conway Drive, MK45 1ST, Flitwick Bedford
Property 52 has been sold 1 time. The last time it was sold was in 02/09/1996 and the sold price was £99,995.00.
This is a Detached House which was sold as a freehold in 02/09/1996
| Date | Price | Property Type | Tenure | Classification |
|---|---|---|---|---|
| 02/09/1996 | £99,995.00 | Detached House | freehold | Established Building |
Postcodes in Conway Drive, Flitwick
Navigate through other locations in Conway Drive, Flitwick, Bedford to see more property listings for sale or to rent.
Transport near MK45 1ST, Conway Drive
-
 Flitwick Station
 -
Harlington Station
-
Lidlington Station
-
Millbrook (Bedfordshire) Station
-
Ridgmont Station
-
Stewartby Station
House price paid reports for MK45 1ST, Conway Drive
Click on the buttons below to see price paid reports by year or property price:
- Price Paid By Year
Property Price Paid in MK45 1ST, Conway Drive by Year
The average sold property price by year was:
| Year | Average Sold Price | Price Change |
Sold Properties
|
|---|---|---|---|
| 2009 | £239,000 | 30% |
1 Property |
| 2001 | £167,500 | 41% |
1 Property |
| 1996 | £97,997 | - |
2 Properties |