
Houses for sale in Bedford, Bedfordshire
House Prices in Bedford
Properties in Bedford have an average house price of £374k and had 9,242 Property Transactions within the last 3 years.¹
Bedford is an area in Bedfordshire with 100,400 households², where the most expensive property was sold for £2.65M.
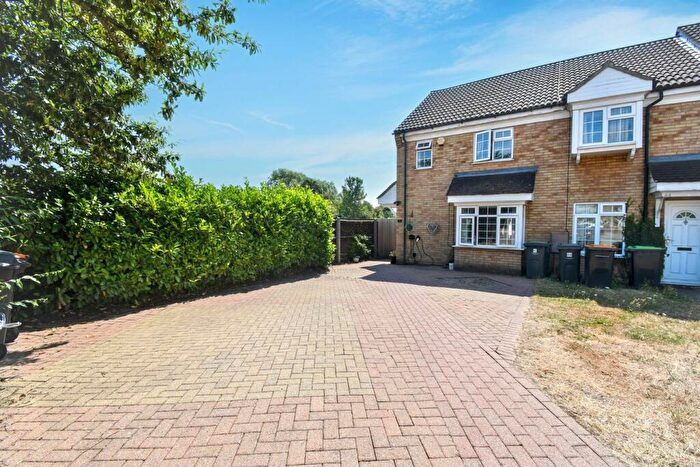
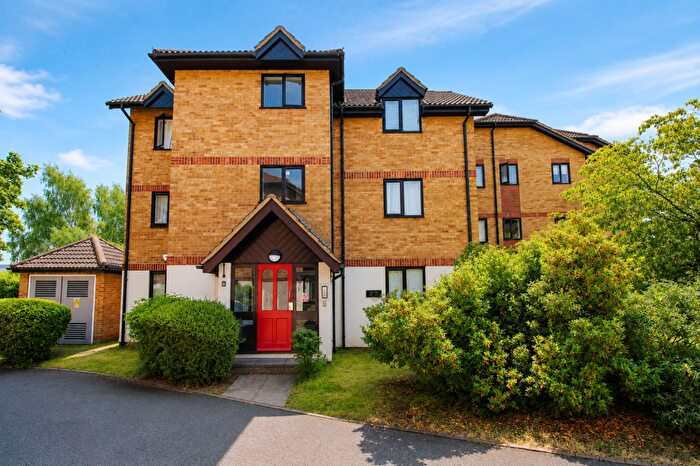
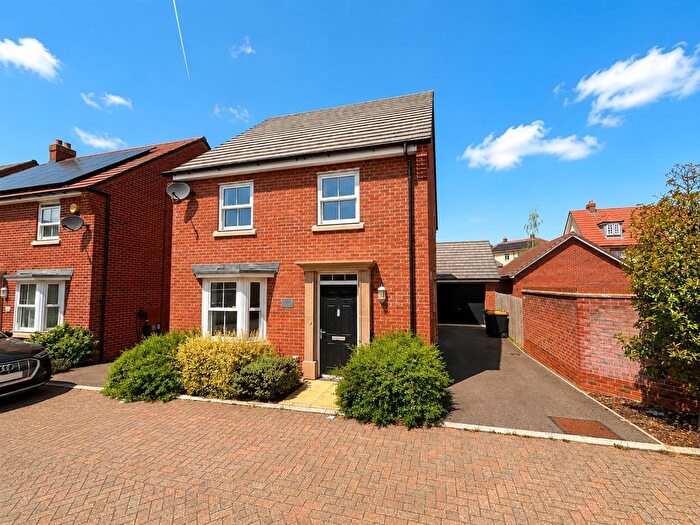
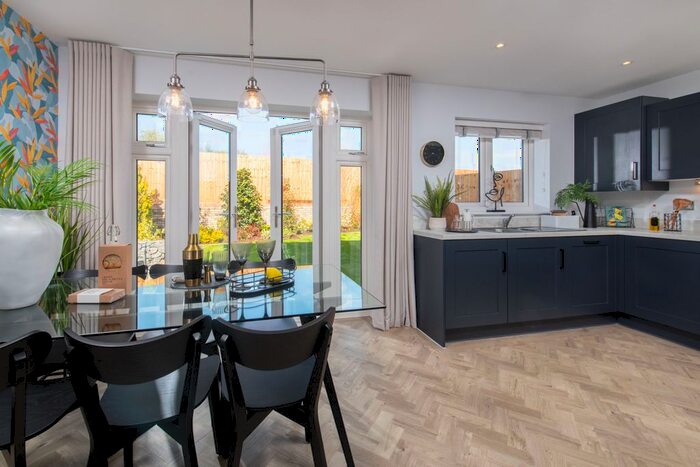
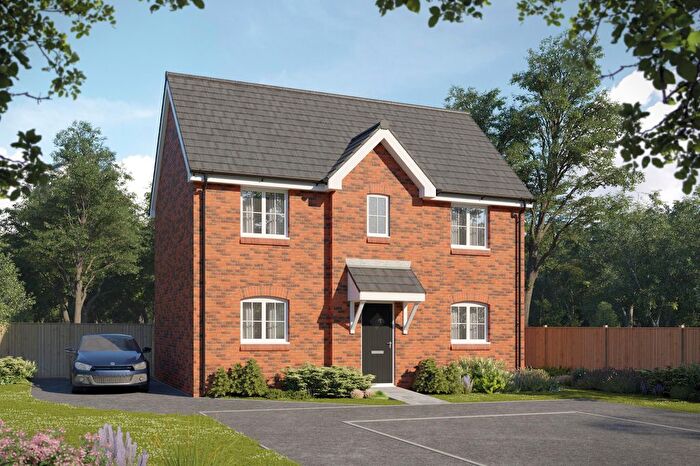
Properties for sale in Bedford
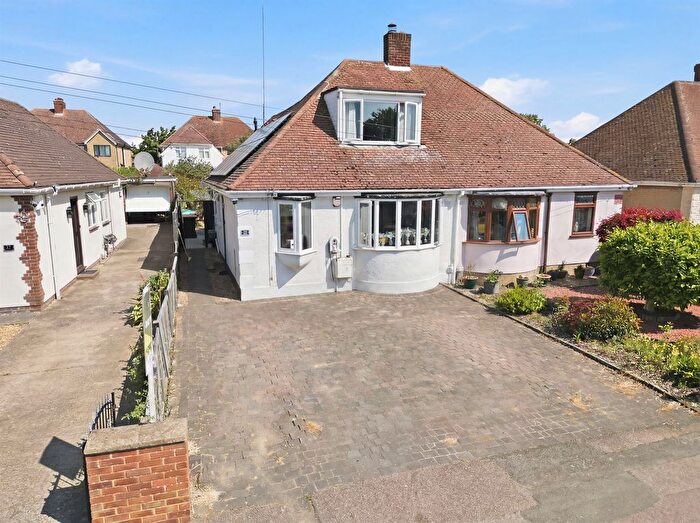
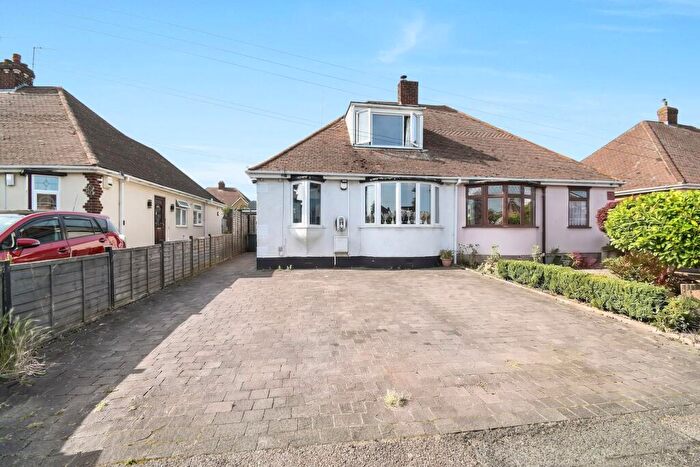
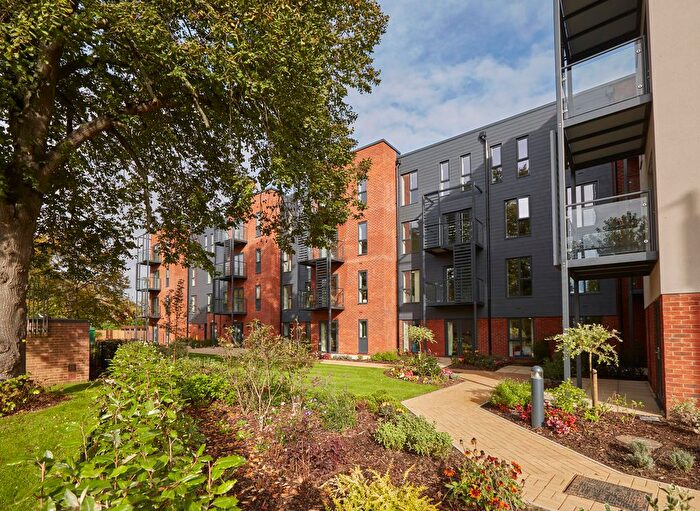
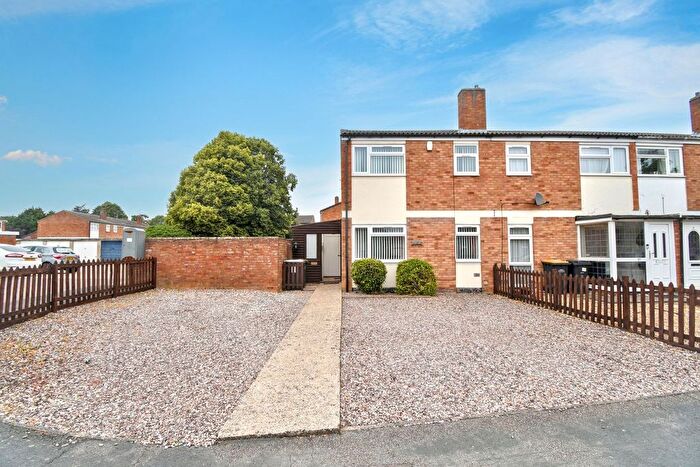
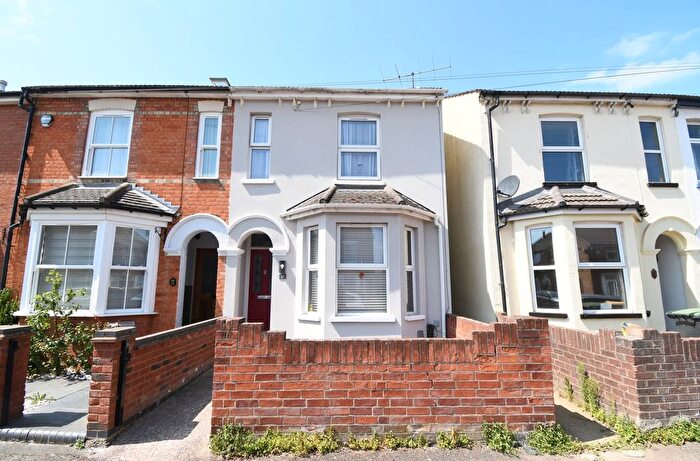
![]()
If you are looking to sell your house, let it out, or receive a property valuation, an expert can help you.
Click the button below to get started.

Neighbourhoods in Bedford
Navigate through our locations to find the location of your next house in Bedford, Bedfordshire for sale or to rent.
- Ampthill
- Aspley And Woburn
- Barton-le-clay
- Brickhill
- Bromham And Biddenham
- Castle
- Cauldwell
- Clapham
- Cranfield And Marston Moretaine
- De Parys
- Eastcotts
- Elstow And Stewartby
- Flitwick
- Goldington
- Great Barford
- Harpur
- Harrold
- Houghton Conquest And Haynes
- Kempston Central And East
- Kempston North
- Kempston Rural
- Kempston South
- Kempston West
- Kingsbrook
- Newnham
- Northill
- Oakley
- Putnoe
- Queens Park
- Riseley
- Sandy
- Sharnbrook
- Silsoe And Shillington
- Toddington
- Westoning, Flitton And Greenfield
- Wilshamstead
- Wootton
- Wyboston
- Biddenham
- Greyfriars
- Renhold & Ravensden
- Bromham
- Wootton & Kempston Rural
- Barton-le-clay & Silsoe
- Meppershall & Shillington
- Clapham & Oakley
- Shortstown
- Wixams & Wilstead
- Houghton Conquest & Haynes
- Kempston Central & East
- Cranfield & Marston Moretaine
Property price trends in Bedford
According to the latest Land Registry data, the average home in Bedford sold for £388,944 in 2026. That figure comes from a substantial record of 127,538 sales logged over the past 31 years.
Prices have continued to climb over the last three years. Compared with 2023, when the typical sale came in around £365,840, that's a rise of roughly 6.3%.
Looking back five years, average prices are up about 9.6% since 2021, a gain of around £34,227 in cash terms.
Zoom out to the past decade for the fuller picture. Back in 2016, homes here averaged £287,369, so the typical sold price has climbed about 35.3% since then, roughly 3.1% a year. Stretch the view to fifteen years and that annual pace edges up closer to 3.9%.
Frequently asked questions about Bedford
What is the average price for a property for sale in Bedford?
The average price for a property for sale in Bedford is £374,112. This amount is 0.6% higher than the average price in Bedfordshire. There are more than 10,000 property listings for sale in Bedford.
What locations have the most expensive properties for sale in Bedford?
The locations with the most expensive properties for sale in Bedford are Toddington at an average of £654,353, Wyboston at an average of £554,230 and Aspley And Woburn at an average of £551,250.
What locations have the most affordable properties for sale in Bedford?
The locations with the most affordable properties for sale in Bedford are Cauldwell at an average of £245,610, Kingsbrook at an average of £259,888 and Harpur at an average of £263,365.
Which train stations are available in or near Bedford?
Some of the train stations available in or near Bedford are Bedford St.Johns, Bedford Midland and Kempston Hardwick.
Property Price Paid in Bedford by Year
The average sold property price by year was:
| Year | Average Sold Price | Price Change |
Sold Properties
|
|---|---|---|---|
| 2026 | £388,944 | 1% |
210 Properties |
| 2025 | £383,731 | 3% |
3,029 Properties |
| 2024 | £371,235 | 1% |
3,227 Properties |
| 2023 | £365,840 | -2% |
2,776 Properties |
| 2022 | £374,784 | 5% |
3,629 Properties |
| 2021 | £354,717 | 6% |
4,937 Properties |
| 2020 | £334,011 | 4% |
3,931 Properties |
| 2019 | £321,788 | -1% |
4,497 Properties |
| 2018 | £323,673 | 4% |
4,510 Properties |
| 2017 | £311,575 | 8% |
4,509 Properties |
Property Price per Property Type in Bedford
Here you can find historic sold price data in order to help with your property search.
The average Property Paid Price for specific property types in the last three years are:
| Property Type | Average Sold Price | Sold Properties |
|---|---|---|
| Semi Detached House | £352,772.00 | 3,046 Semi Detached Houses |
| Terraced House | £291,900.00 | 2,397 Terraced Houses |
| Detached House | £547,346.00 | 2,709 Detached Houses |
| Flat | £183,998.00 | 1,090 Flats |
Transport in Bedford
Please see below transportation links in this area:
