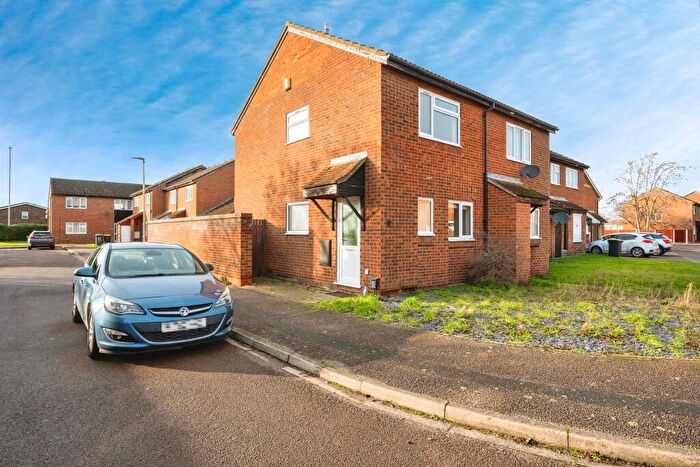
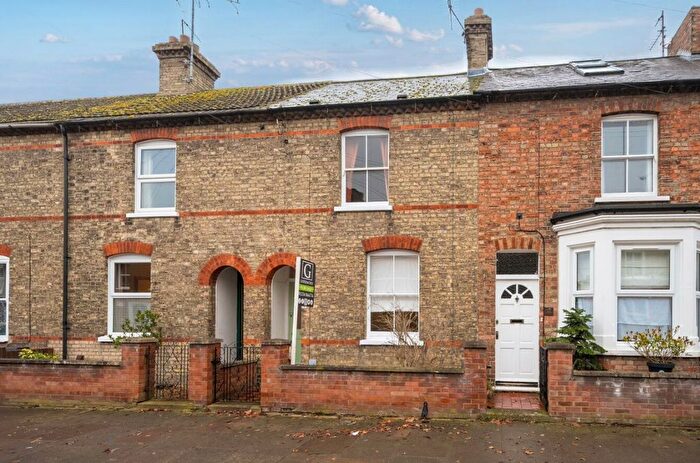
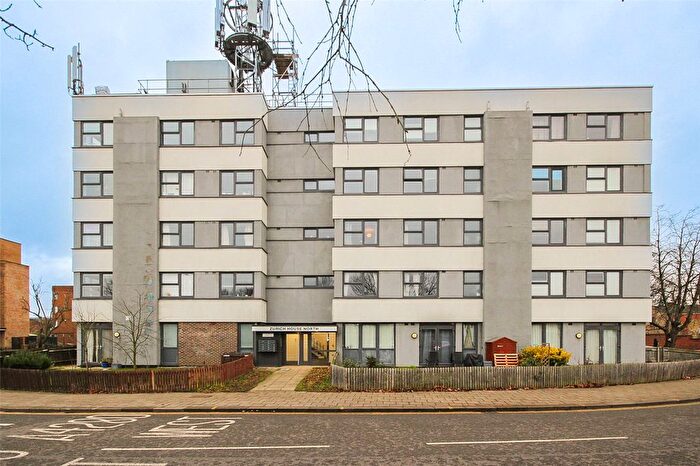
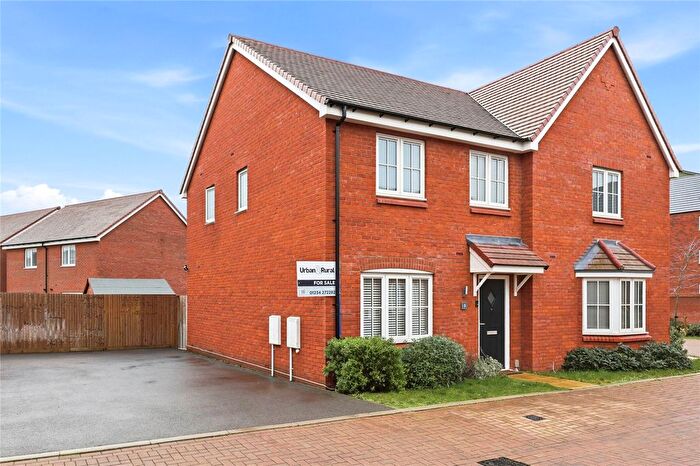
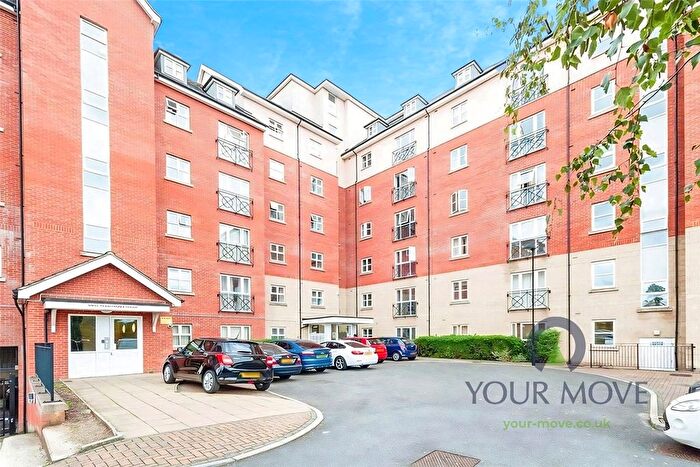
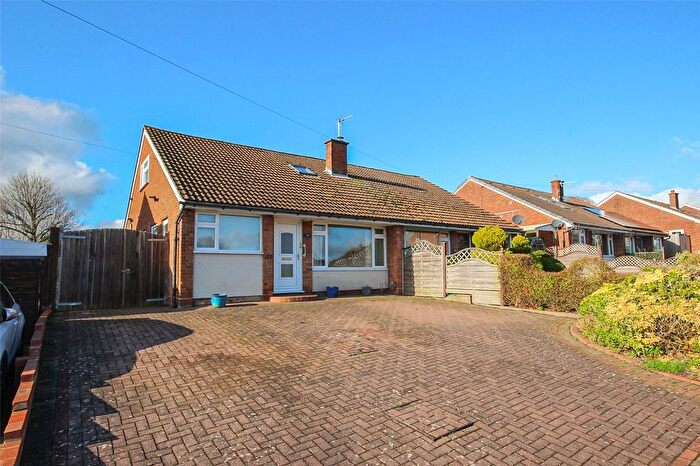
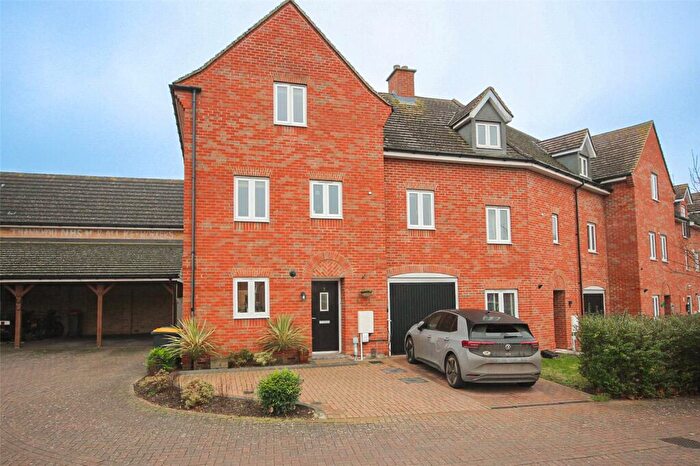
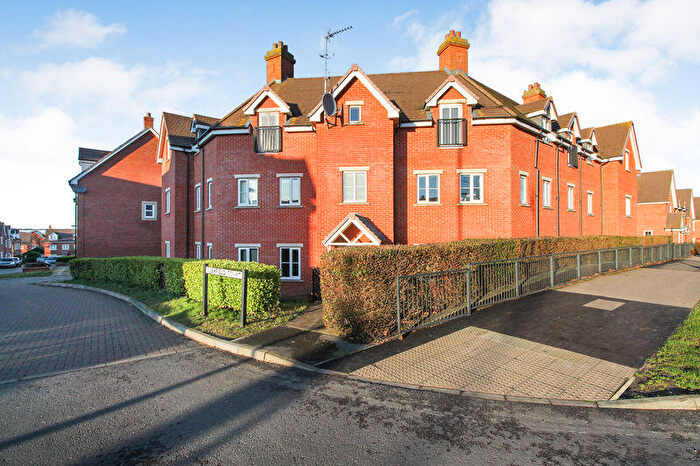
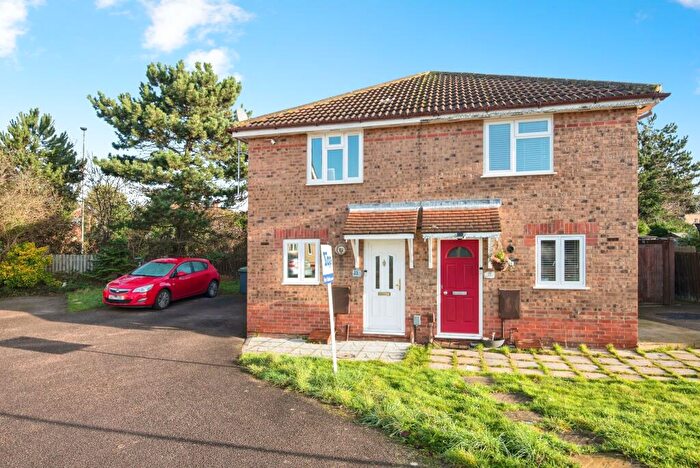
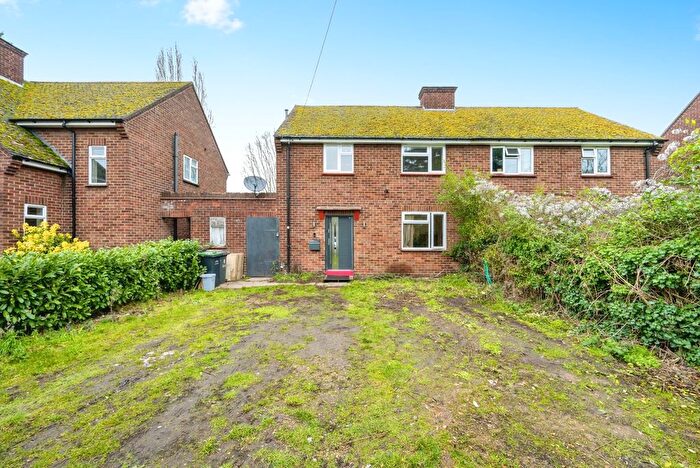
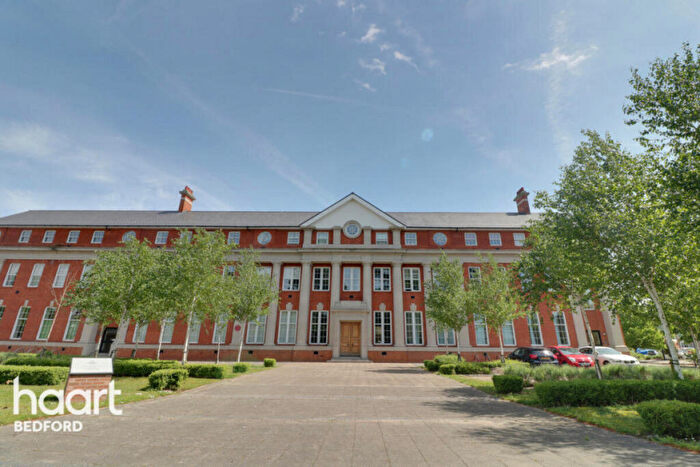
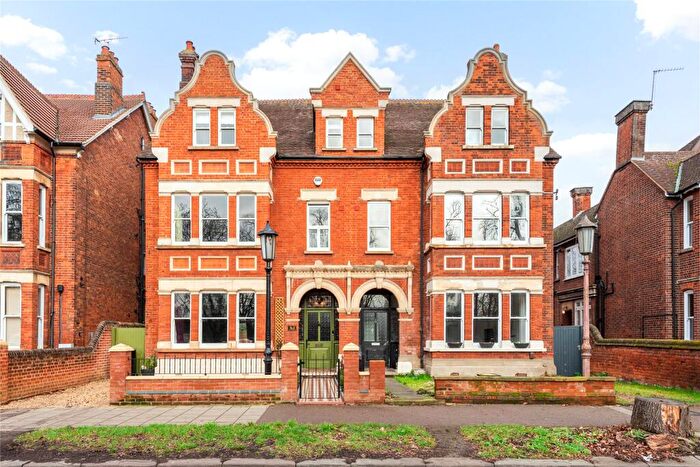
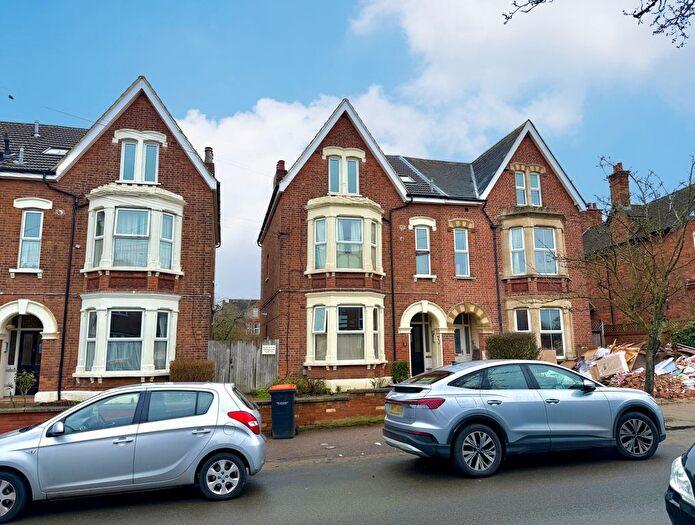
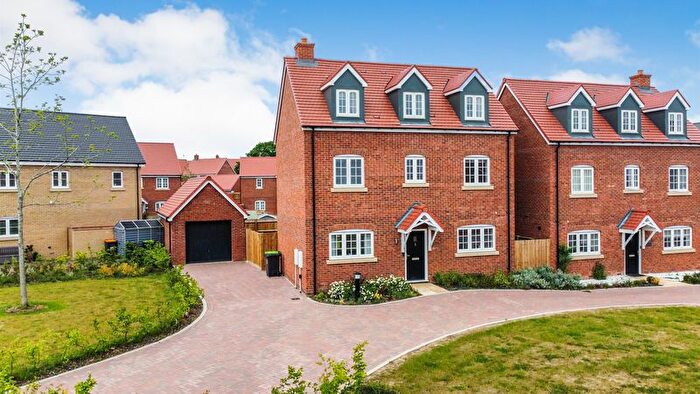
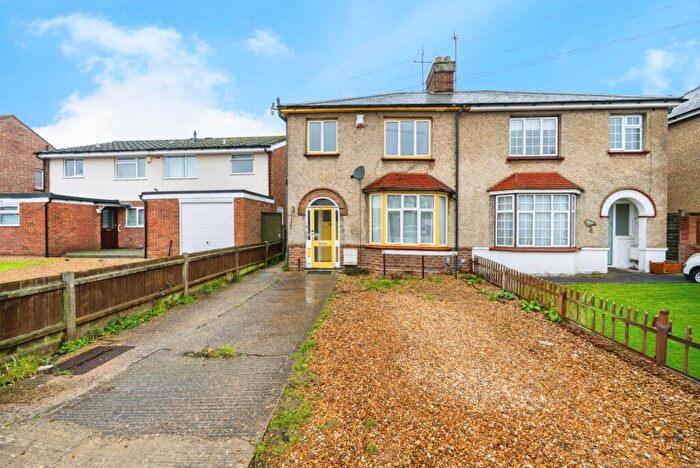
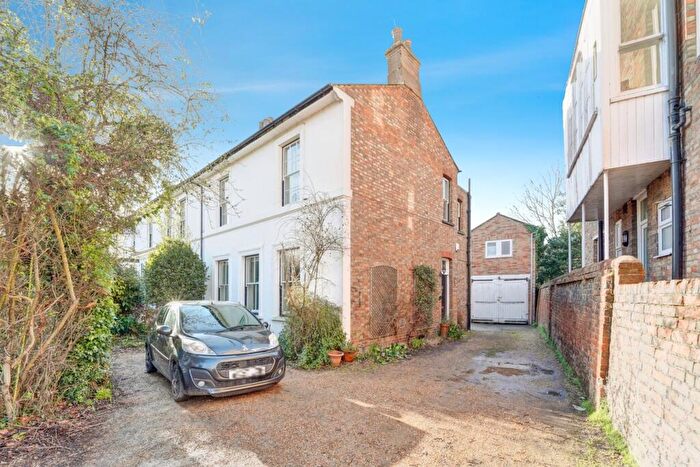
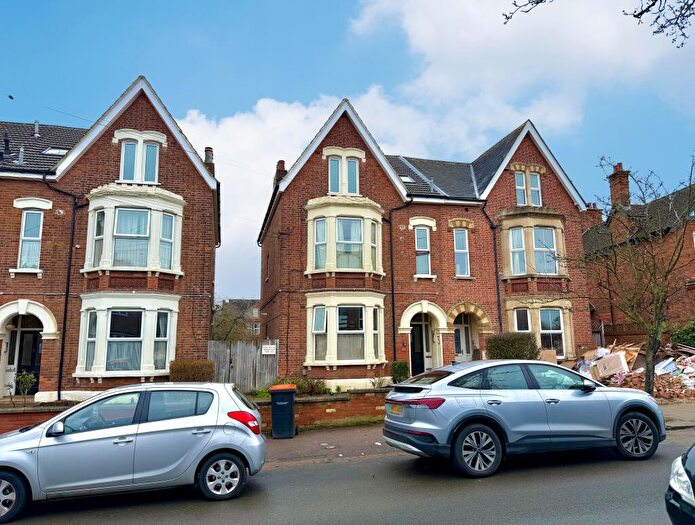
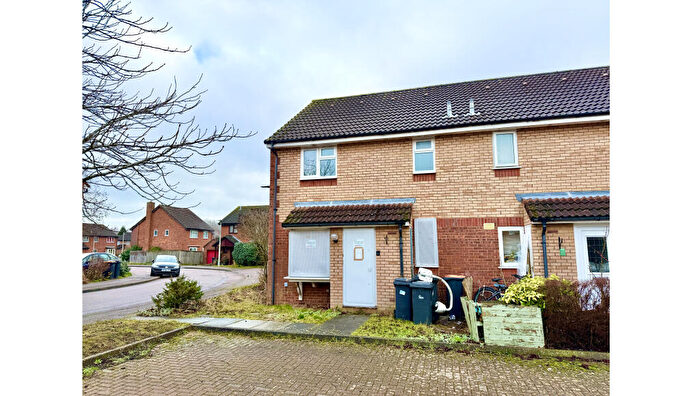
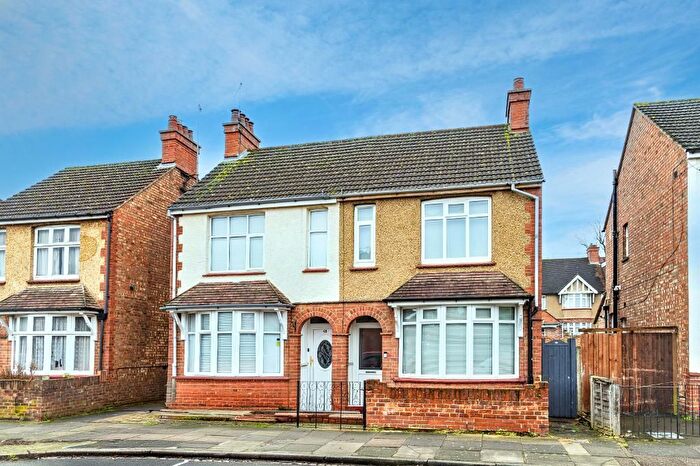
Houses for sale & to rent in Kingsbrook, Bedford
House Prices in Kingsbrook
Properties in Kingsbrook have an average house price of £259,178.00 and had 242 Property Transactions within the last 3 years¹.
Kingsbrook is an area in Bedford, Bedfordshire with 3,637 households², where the most expensive property was sold for £520,000.00.
Properties for sale in Kingsbrook
Roads and Postcodes in Kingsbrook
Navigate through our locations to find the location of your next house in Kingsbrook, Bedford for sale or to rent.
| Streets | Postcodes |
|---|---|
| Acacia Road | MK42 0HS MK42 0HT MK42 0HX |
| Acorn Way | MK42 0QN |
| Alamein Avenue | MK42 0DE MK42 0DF |
| Alburgh Close | MK42 0HE MK42 0HF MK42 0HG MK42 0HQ |
| Alder Close | MK42 0YG |
| Alpine View | MK42 0YJ MK42 0YQ |
| Arkwright Road | MK42 0LE |
| Arkwright Road Industrial Estate | MK42 0LQ |
| Bamford Road | MK42 0NE MK42 0NF MK42 0NH MK42 0GQ |
| Barford Avenue | MK42 0DS MK42 0DT MK42 0DU |
| Barton Road | MK42 0NA |
| Bluebell Close | MK42 0RN |
| Boteler Gardens | MK42 0NG |
| Brampton Close | MK42 0HD |
| Brancaster Close | MK42 0SU |
| Brook Street | MK42 0QR |
| Buttercup Close | MK42 0RE |
| Cambridge Road | MK42 0LH MK42 0NN |
| Cambridge Road Industrial Estate | MK42 0LW MK42 0LJ |
| Canvin Way | MK42 0HL |
| Cardington Road | MK42 0BY MK42 0BZ MK42 0DA MK42 0DG MK42 0BG MK44 3SA MK42 0EX |
| Carter Close | MK42 0JP |
| Cedar Road | MK42 0HP MK42 0HR |
| Christie Road | MK42 0EL MK42 0EP |
| Collie Road | MK42 0JJ MK42 0JL |
| Collins Place | MK42 0ND |
| Coombs Close | MK42 0EA |
| Cottril Way | MK42 0WA MK42 0WB |
| Dents Road | MK42 0QP MK42 0QQ |
| Duchess Road | MK42 0SE MK42 0SF MK42 0SH |
| Dunham Close | MK42 0LU |
| Eastcotts Road | MK42 0JU MK42 0LD |
| Elstow Road | MK42 9LA MK42 9LE |
| Faldo Road | MK42 0ED MK42 0EH |
| Fenlake Road | MK42 0ER MK42 0ES MK42 0ET MK42 0EU MK42 0HA |
| Fenlake Road Industrial Estate | MK42 0HB |
| Foxglove Way | MK42 0FG |
| Fraser Road | MK44 3BF MK44 3WH MK44 3WJ |
| Gifford Road | MK42 0EJ |
| Goodmayes Close | MK42 0LX |
| Grosvenor Street | MK42 0PL |
| Harding Close | MK42 0JR |
| Harrowden Lane | MK42 0RR |
| Harrowden Road | MK42 0RS MK42 0RT MK42 0RU MK42 0RX MK42 0SJ MK42 0SL MK42 0SP |
| Hazelwood Road | MK42 0HN MK42 0HW |
| Herbrand Road | MK42 0SD |
| Hereford Road | MK42 0RP |
| Hockliffe Road | MK42 0DY MK42 0DZ |
| Ivy Road | MK42 0QD |
| Kathie Road | MK42 0QH MK42 0QJ |
| Kilpin Close | MK42 0EB |
| Kingfisher Business Park | MK42 0NY |
| Kirkman Close | MK42 0HY |
| Leiston Close | MK42 0AZ |
| Leith Road | MK42 0NB |
| Lily Close | MK42 0RF |
| London Road | MK42 0NT MK42 0NX MK42 0PB MK42 0PR MK42 0PS MK42 0PT MK42 0PX MK42 0PY MK42 0PZ MK42 0QA MK42 0ST MK42 0NR MK42 0NS MK42 0NW MK42 0PG MK42 0PJ MK42 0QE MK42 0QF MK42 0QG |
| Lovell Road | MK42 0LR MK42 0LS MK42 0LT MK42 0LP |
| Mareth Road | MK42 0DB MK42 0DD |
| Marigold Way | MK42 0RQ MK42 0SS |
| Mark Rutherford Road | MK42 0HZ |
| Meadow Lane | MK44 3LW MK44 3SB |
| Meadowsweet Drive | MK42 0RG |
| Moulton Avenue | MK42 0JB MK42 0JD MK42 0JF |
| Myrtle Road | MK42 0QT |
| Nash Road | MK42 0JH |
| Nicholls Road | MK42 0DX |
| Oak Road | MK42 0HH MK42 0HJ |
| Paradine Road | MK42 0JA |
| Priory Business Park | MK44 3US |
| Reddall Close | MK42 0LY |
| Redwood Grove | MK42 9JL MK42 9NJ MK42 9NN MK42 9NQ MK42 9NW |
| Rope Walk | MK42 0XE |
| Royle Gardens | MK42 0NJ |
| St Helena Road | MK42 0RA |
| St Johns Street | MK42 0DJ |
| St Martins Court | MK42 0LN |
| St Martins Way | MK42 0LF |
| Stanley Road | MK42 0XY |
| Stannard Way | MK44 3DT MK44 3JW MK44 3JZ MK44 3RZ MK44 3SG MK44 3UP MK44 3WG |
| Summerhouse Hill | MK44 3SD |
| Sundew Close | MK42 0SR |
| Tansy Close | MK42 0RD |
| Telford Way | MK42 0PQ |
| The Sidings | MK42 9NE MK42 9NF |
| Turnpike Gardens | MK42 0AG MK42 0AJ |
| Violet Close | MK42 0SQ |
| Voyce Way | MK42 0WD MK42 0WE |
| Vulcan Street | MK42 0PP |
| Welbourne Gardens | MK42 0NQ |
| Wildflower Way | MK42 0RW MK42 0SG MK42 0SN |
| Willow Road | MK42 0QS MK42 0QU MK42 0YL |
| Winchester Road | MK42 0RZ MK42 0SA MK42 0SB |
| Worcester Road | MK42 0RY |
| MK44 3DN |
Transport near Kingsbrook
- FAQ
- Price Paid By Year
- Property Type Price
Frequently asked questions about Kingsbrook
What is the average price for a property for sale in Kingsbrook?
The average price for a property for sale in Kingsbrook is £259,178. This amount is 30% lower than the average price in Bedford. There are 3,744 property listings for sale in Kingsbrook.
What streets have the most expensive properties for sale in Kingsbrook?
The streets with the most expensive properties for sale in Kingsbrook are Sundew Close at an average of £422,500, Cambridge Road at an average of £418,750 and Cambridge Road Industrial Estate at an average of £400,000.
What streets have the most affordable properties for sale in Kingsbrook?
The streets with the most affordable properties for sale in Kingsbrook are Redwood Grove at an average of £142,362, Reddall Close at an average of £153,750 and Brancaster Close at an average of £155,000.
Which train stations are available in or near Kingsbrook?
Some of the train stations available in or near Kingsbrook are Bedford St.Johns, Bedford Midland and Kempston Hardwick.
Property Price Paid in Kingsbrook by Year
The average sold property price by year was:
| Year | Average Sold Price | Price Change |
Sold Properties
|
|---|---|---|---|
| 2025 | £264,070 | 4% |
65 Properties |
| 2024 | £254,592 | -2% |
85 Properties |
| 2023 | £259,959 | 4% |
92 Properties |
| 2022 | £248,539 | 8% |
100 Properties |
| 2021 | £229,664 | 9% |
121 Properties |
| 2020 | £208,297 | 0,1% |
97 Properties |
| 2019 | £208,096 | -4% |
131 Properties |
| 2018 | £216,013 | 4% |
113 Properties |
| 2017 | £206,616 | 14% |
117 Properties |
| 2016 | £177,713 | -5% |
143 Properties |
| 2015 | £186,853 | 24% |
169 Properties |
| 2014 | £142,451 | 10% |
151 Properties |
| 2013 | £128,512 | 2% |
96 Properties |
| 2012 | £126,286 | -6% |
69 Properties |
| 2011 | £133,317 | 4% |
89 Properties |
| 2010 | £128,501 | -6% |
92 Properties |
| 2009 | £136,761 | 1% |
105 Properties |
| 2008 | £134,762 | -9% |
99 Properties |
| 2007 | £146,270 | 6% |
221 Properties |
| 2006 | £137,662 | 8% |
220 Properties |
| 2005 | £125,973 | 3% |
175 Properties |
| 2004 | £121,848 | 11% |
221 Properties |
| 2003 | £108,980 | 19% |
229 Properties |
| 2002 | £88,494 | 15% |
312 Properties |
| 2001 | £74,836 | 7% |
234 Properties |
| 2000 | £69,834 | 15% |
284 Properties |
| 1999 | £59,456 | 11% |
247 Properties |
| 1998 | £52,737 | 11% |
221 Properties |
| 1997 | £47,065 | 3% |
198 Properties |
| 1996 | £45,512 | 7% |
181 Properties |
| 1995 | £42,140 | - |
134 Properties |
Property Price per Property Type in Kingsbrook
Here you can find historic sold price data in order to help with your property search.
The average Property Paid Price for specific property types in the last three years are:
| Property Type | Average Sold Price | Sold Properties |
|---|---|---|
| Flat | £139,522.00 | 37 Flats |
| Semi Detached House | £271,561.00 | 87 Semi Detached Houses |
| Detached House | £382,948.00 | 29 Detached Houses |
| Terraced House | £256,488.00 | 89 Terraced Houses |

