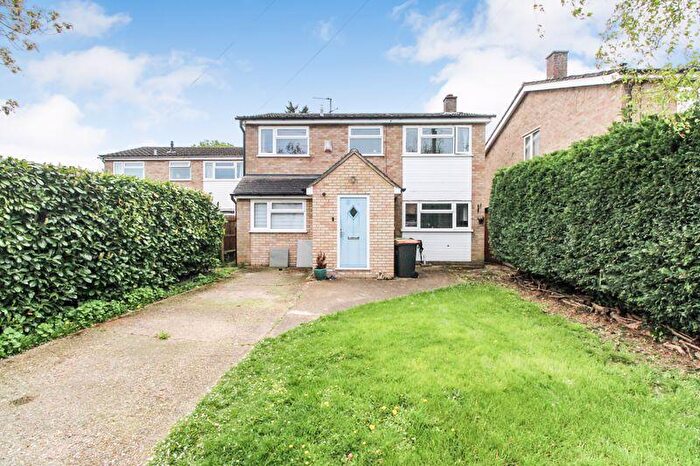
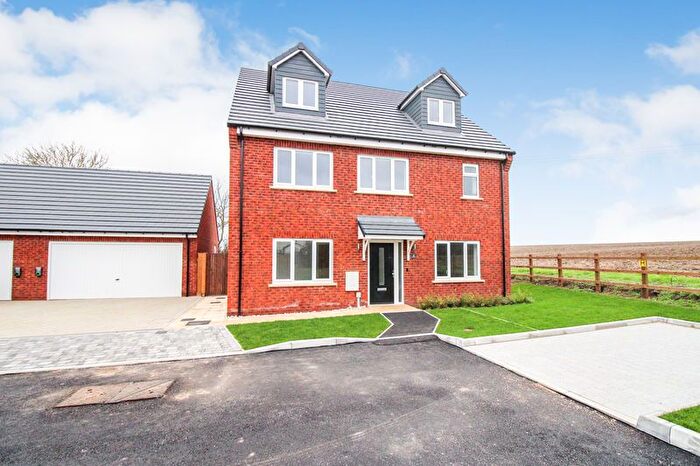
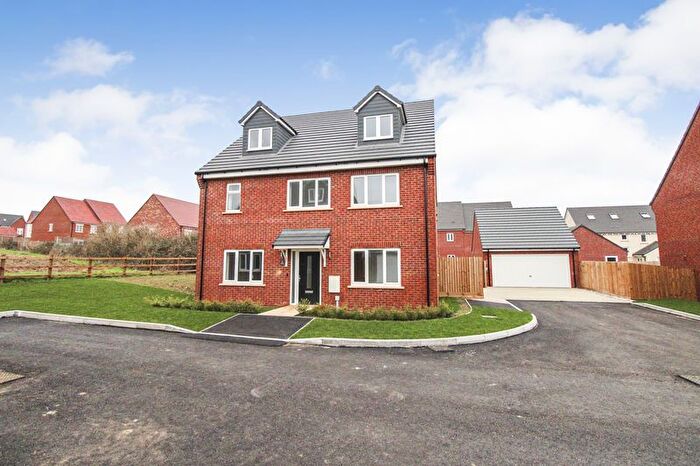
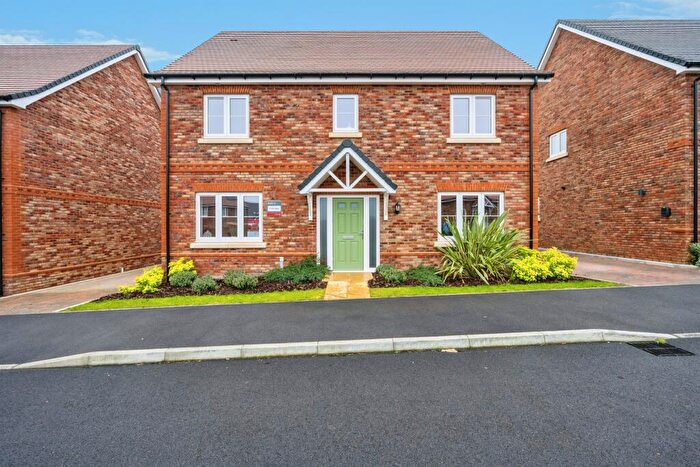
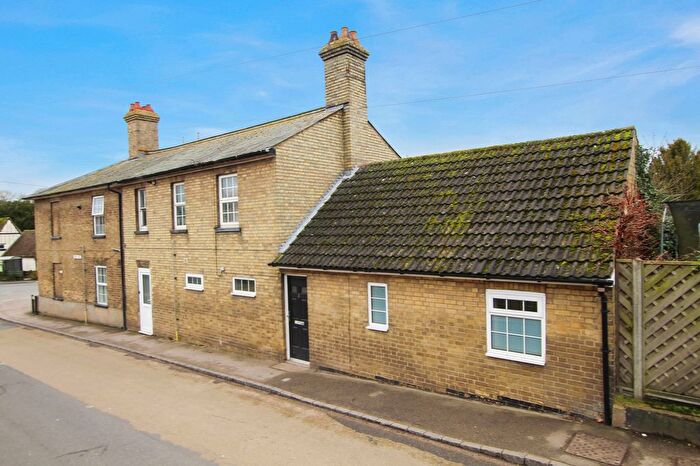
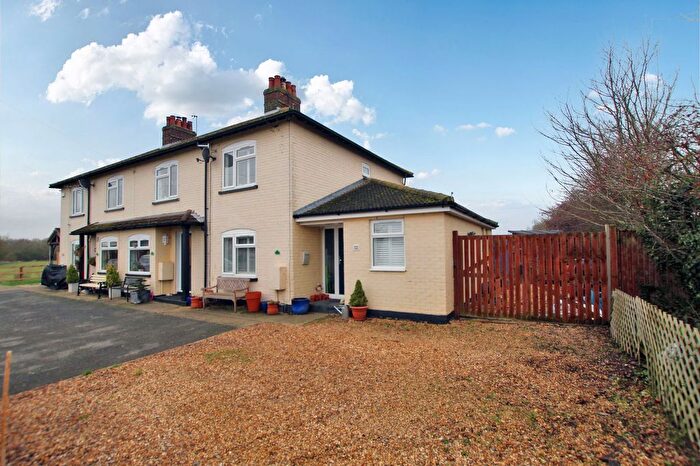
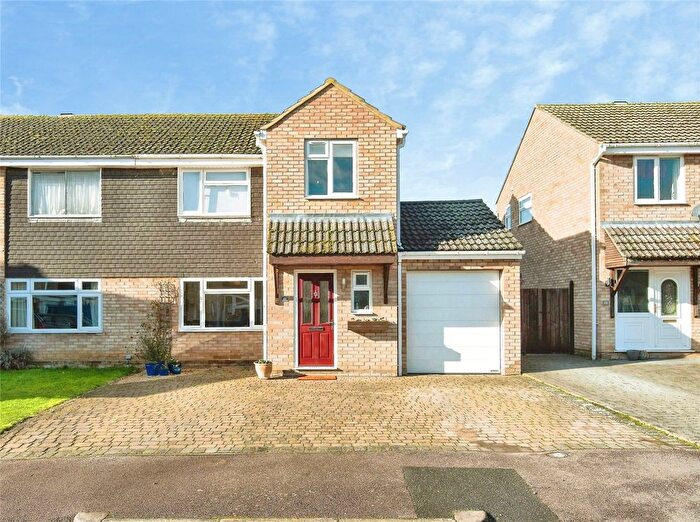
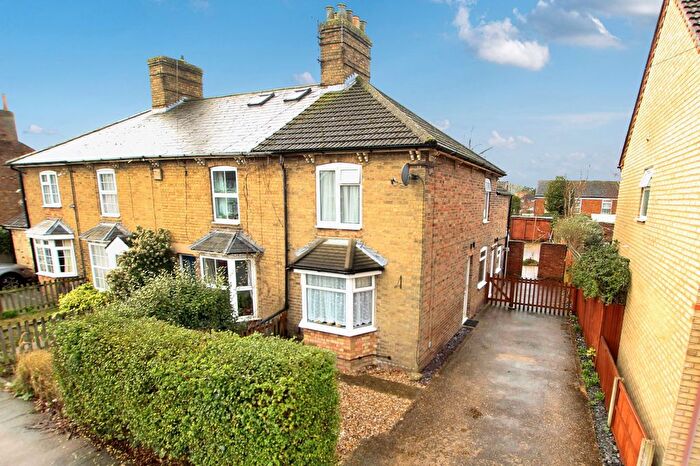
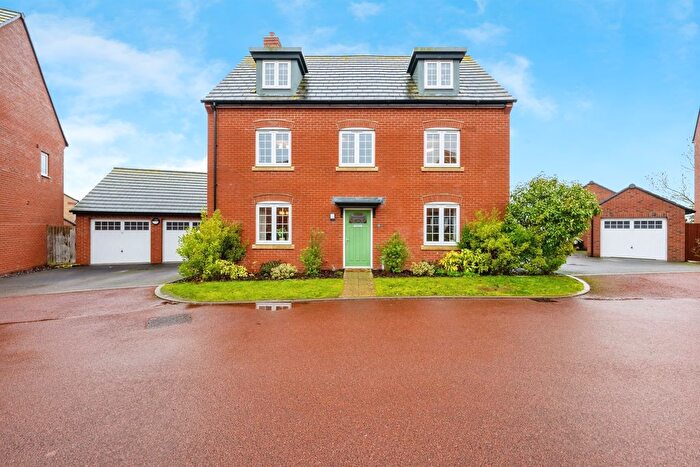
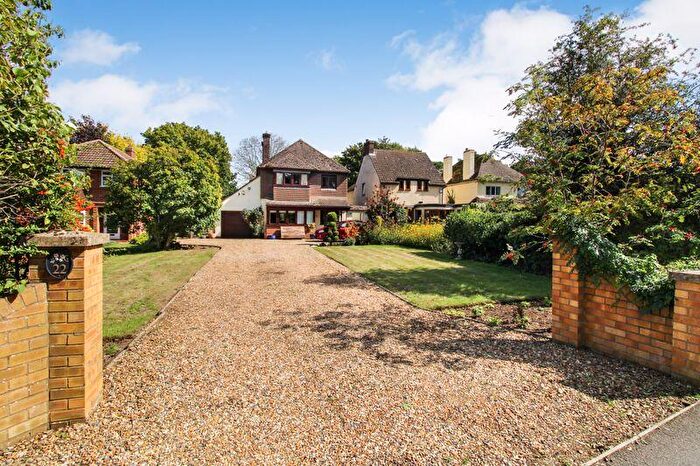
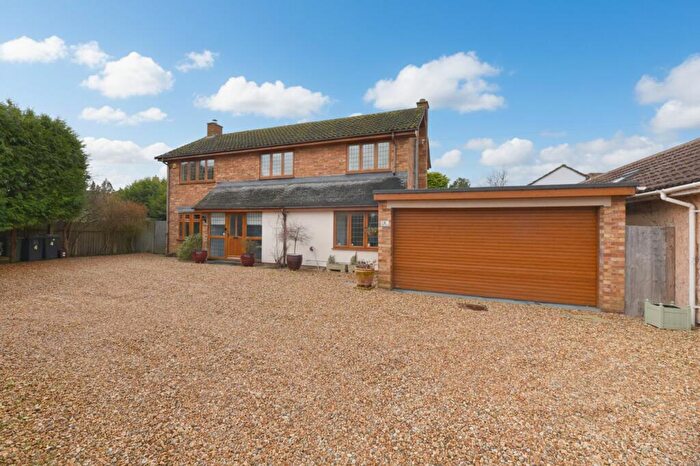
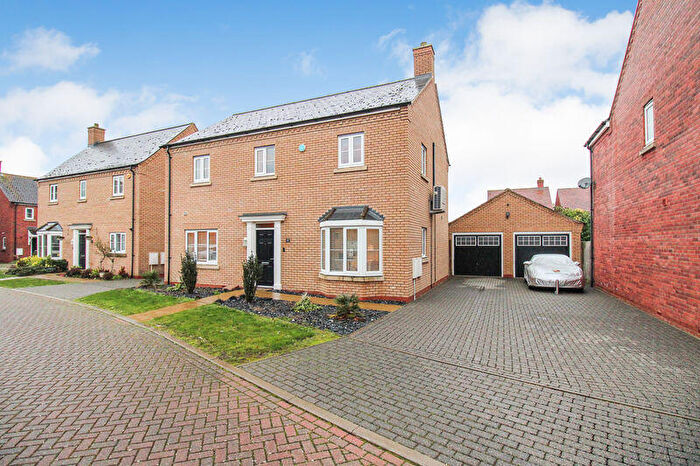
Houses for sale & to rent in Northill, Bedford
House Prices in Northill
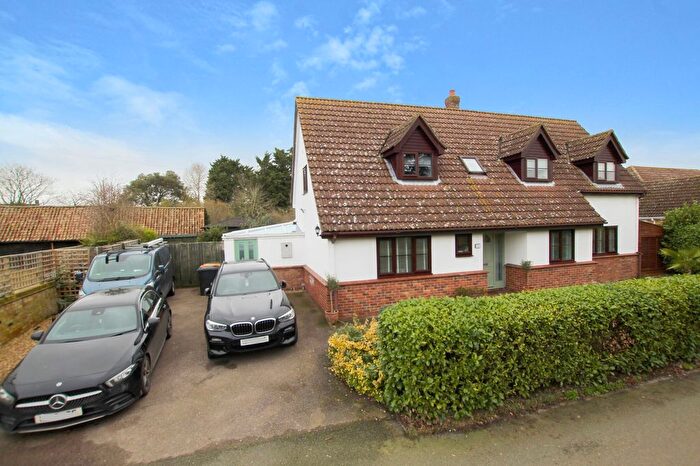
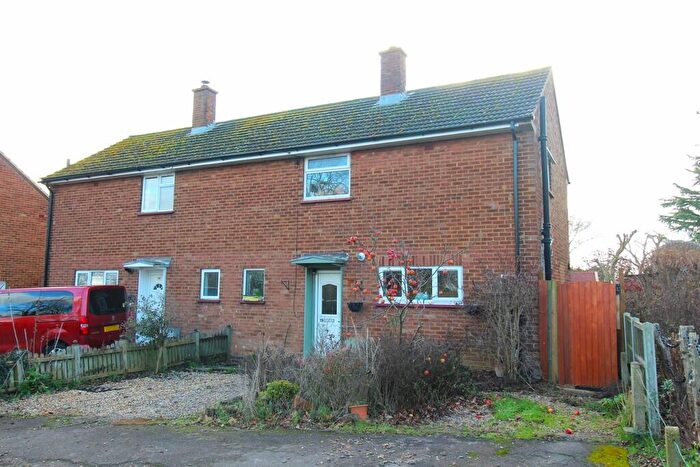
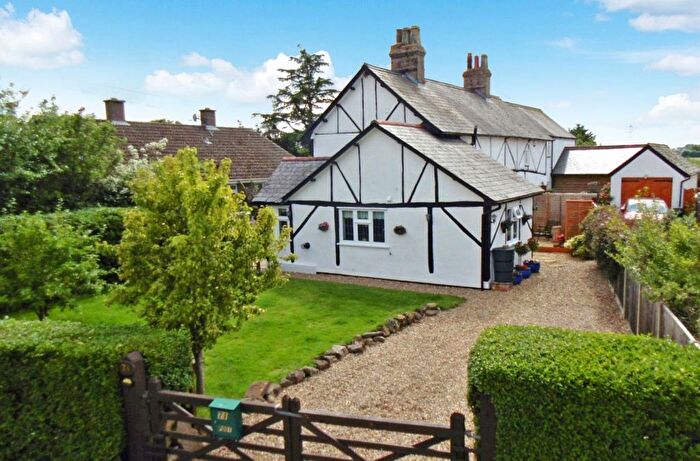
Properties in Northill have an average house price of £489,296.00 and had 25 Property Transactions within the last 3 years¹.
Northill is an area in Bedford, Bedfordshire with 264 households², where the most expensive property was sold for £1,175,000.00.
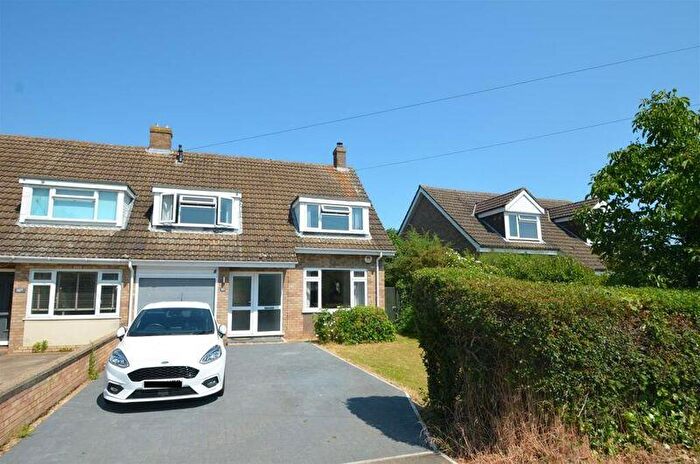
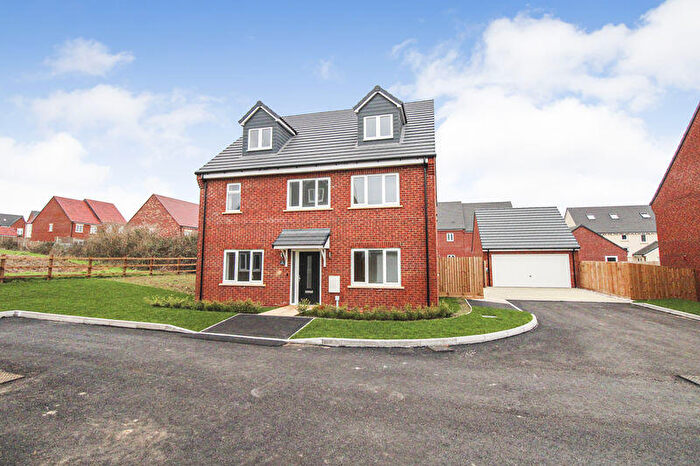
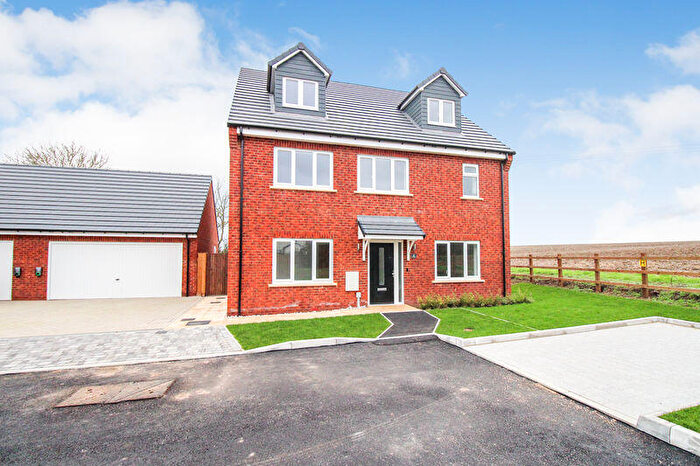
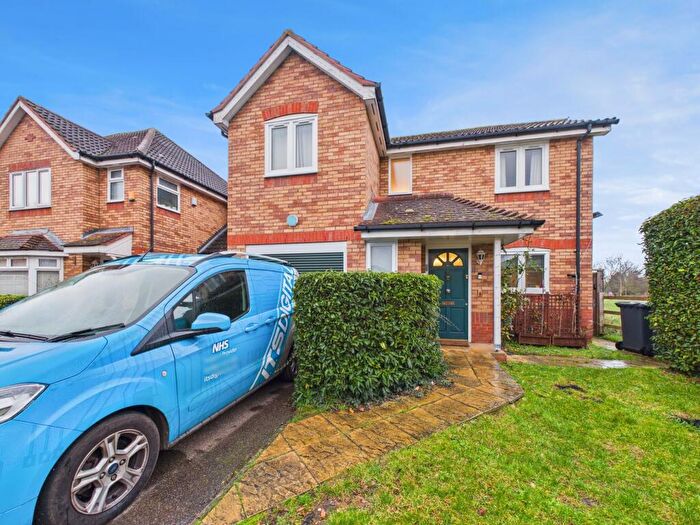
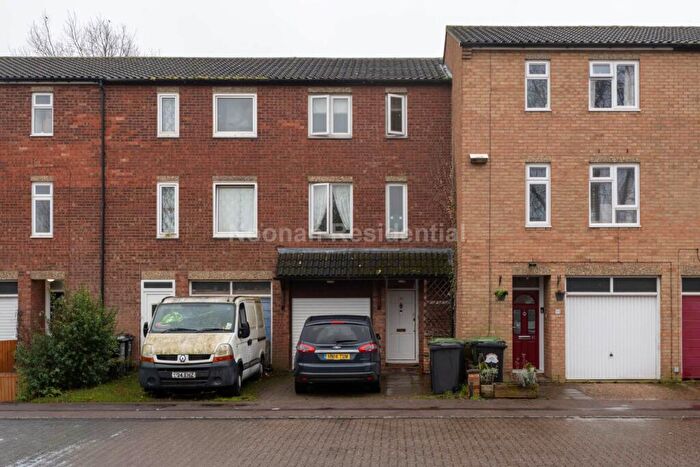
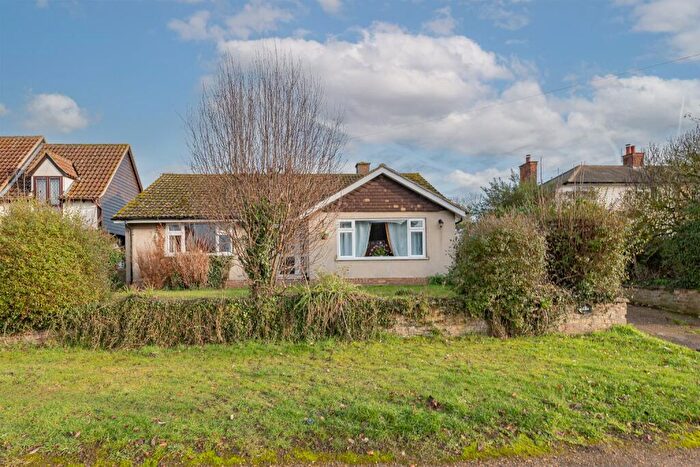
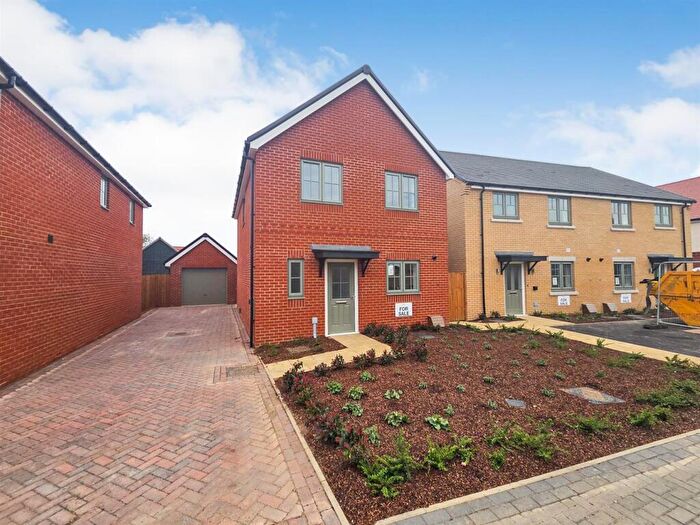
Properties for sale in Northill
Roads and Postcodes in Northill
Navigate through our locations to find the location of your next house in Northill, Bedford for sale or to rent.
| Streets | Postcodes |
|---|---|
| Barrance Way | MK44 3FF |
| Bedford Road | MK44 3RG MK44 3RQ MK44 3RR MK44 3RS MK44 3RU |
| Blunham Road | MK44 3PD MK44 3RA MK44 3RB MK44 3RD |
| Crescent View | MK44 3RP |
| Dynes Place | MK44 3RH |
| Park Close | MK44 3RY |
| Park Road | MK44 3RN MK44 3RW |
| St Johns Road | MK44 3RJ MK44 3RL |
| The Avenue | MK44 3RT |
| The Crescent | MK44 3RE |
| The Ridgeway | MK44 3PH |
| The Ridgeway Business Park | MK44 3DE |
| The Warrens | MK44 3DW |
| Warden Wood | MK45 3QA |
| West Way | MK44 3RF |
Transport near Northill
-
Sandy Station
-
Biggleswade Station
-
Bedford St.Johns Station
-
Bedford Midland Station
-
Kempston Hardwick Station
-
Arlesey Station
-
St.Neots Station
-
Stewartby Station
-
Millbrook (Bedfordshire) Station
- FAQ
- Price Paid By Year
- Property Type Price
Frequently asked questions about Northill
What is the average price for a property for sale in Northill?
The average price for a property for sale in Northill is £489,296. This amount is 31% higher than the average price in Bedford. There are 1,777 property listings for sale in Northill.
What streets have the most expensive properties for sale in Northill?
The streets with the most expensive properties for sale in Northill are Park Road at an average of £752,500, Blunham Road at an average of £585,000 and St Johns Road at an average of £505,702.
What streets have the most affordable properties for sale in Northill?
The streets with the most affordable properties for sale in Northill are Dynes Place at an average of £265,000, Park Close at an average of £380,000 and Bedford Road at an average of £419,500.
Which train stations are available in or near Northill?
Some of the train stations available in or near Northill are Sandy, Biggleswade and Bedford St.Johns.
Property Price Paid in Northill by Year
The average sold property price by year was:
| Year | Average Sold Price | Price Change |
Sold Properties
|
|---|---|---|---|
| 2025 | £556,625 | 15% |
8 Properties |
| 2024 | £474,157 | 7% |
9 Properties |
| 2023 | £439,000 | -17% |
8 Properties |
| 2022 | £514,684 | 11% |
13 Properties |
| 2021 | £458,718 | 10% |
19 Properties |
| 2020 | £411,709 | -6% |
11 Properties |
| 2019 | £437,366 | 5% |
15 Properties |
| 2018 | £415,621 | -22% |
19 Properties |
| 2017 | £507,954 | 30% |
11 Properties |
| 2016 | £355,220 | 22% |
12 Properties |
| 2015 | £277,409 | -8% |
11 Properties |
| 2014 | £300,269 | 24% |
13 Properties |
| 2013 | £227,000 | -22% |
7 Properties |
| 2012 | £276,624 | -13% |
9 Properties |
| 2011 | £312,500 | 29% |
7 Properties |
| 2010 | £222,500 | 6% |
5 Properties |
| 2009 | £208,549 | -16% |
10 Properties |
| 2008 | £240,990 | -11% |
5 Properties |
| 2007 | £266,733 | 16% |
9 Properties |
| 2006 | £224,567 | -8% |
14 Properties |
| 2005 | £242,857 | 2% |
7 Properties |
| 2004 | £238,500 | 10% |
4 Properties |
| 2003 | £215,116 | -5% |
9 Properties |
| 2002 | £224,850 | 28% |
7 Properties |
| 2001 | £162,360 | 35% |
9 Properties |
| 2000 | £105,000 | 12% |
9 Properties |
| 1999 | £92,918 | -5% |
12 Properties |
| 1998 | £97,695 | 26% |
10 Properties |
| 1997 | £71,875 | -27% |
12 Properties |
| 1996 | £91,187 | 3% |
8 Properties |
| 1995 | £88,722 | - |
9 Properties |
Property Price per Property Type in Northill
Here you can find historic sold price data in order to help with your property search.
The average Property Paid Price for specific property types in the last three years are:
| Property Type | Average Sold Price | Sold Properties |
|---|---|---|
| Semi Detached House | £403,000.00 | 9 Semi Detached Houses |
| Detached House | £555,361.00 | 15 Detached Houses |
| Terraced House | £275,000.00 | 1 Terraced House |

