
Houses for sale & to rent in Bournville & Cotteridge, Birmingham
House Prices in Bournville & Cotteridge
Properties in Bournville & Cotteridge have an average house price of £265k and had 85 Property Transactions within the last 3 years¹.
Bournville & Cotteridge is an area in Birmingham, Birmingham with 1,107 households², where the most expensive property was sold for £760k.
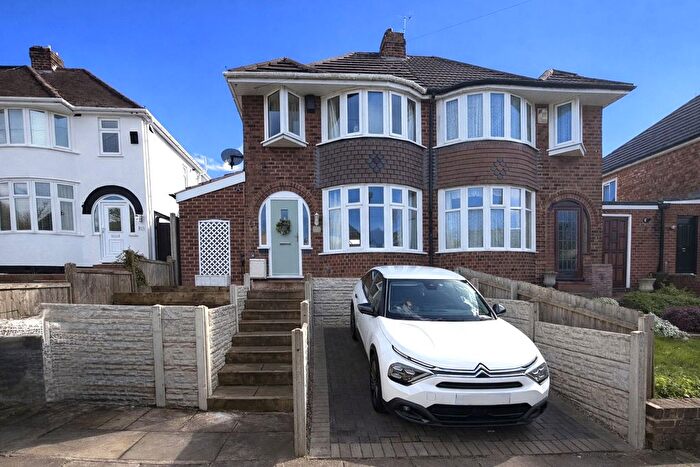
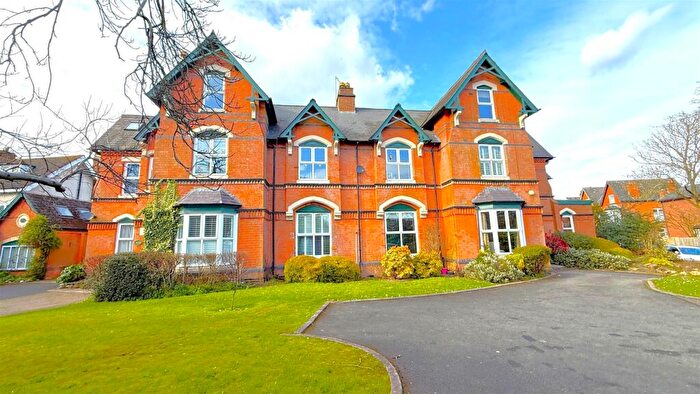
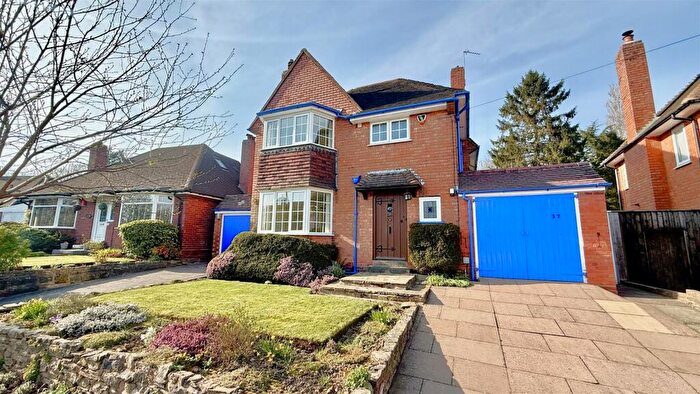
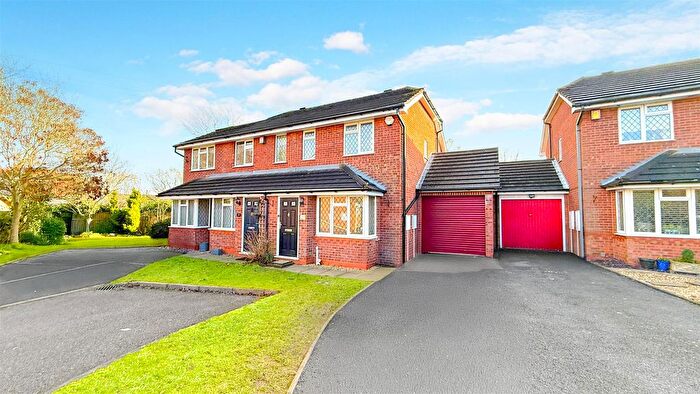
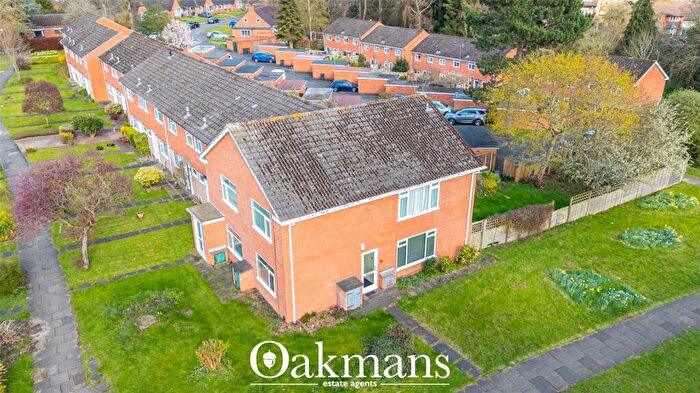
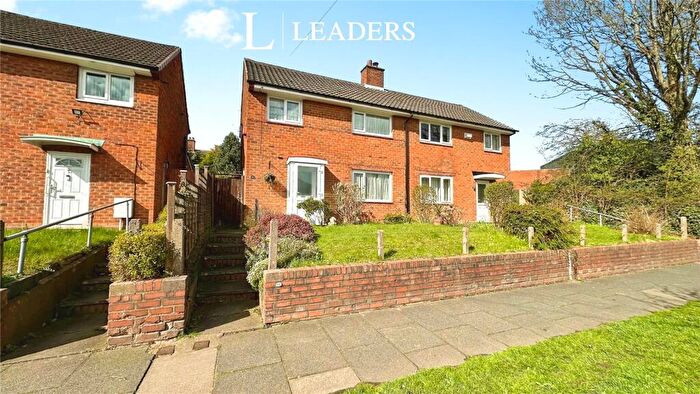
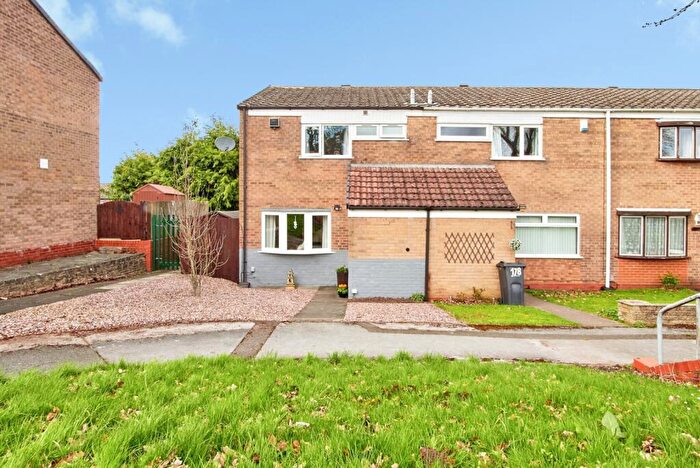
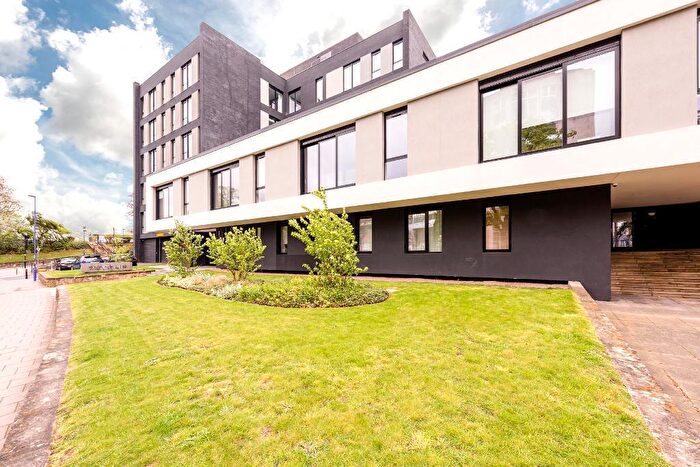
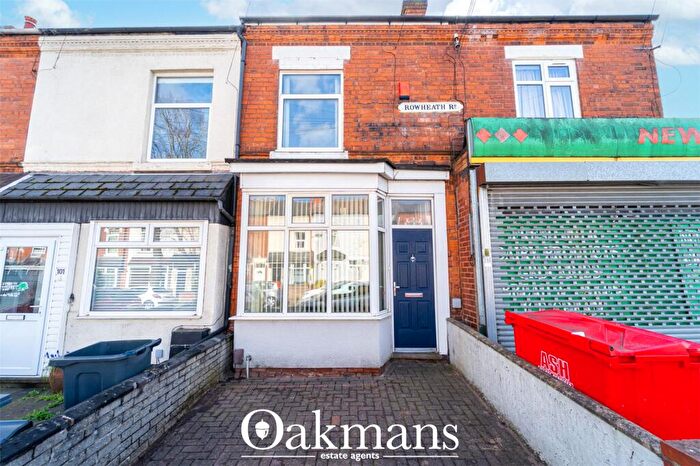
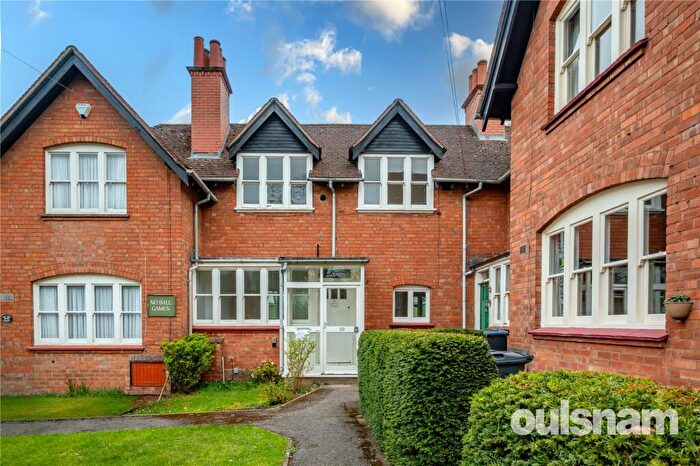
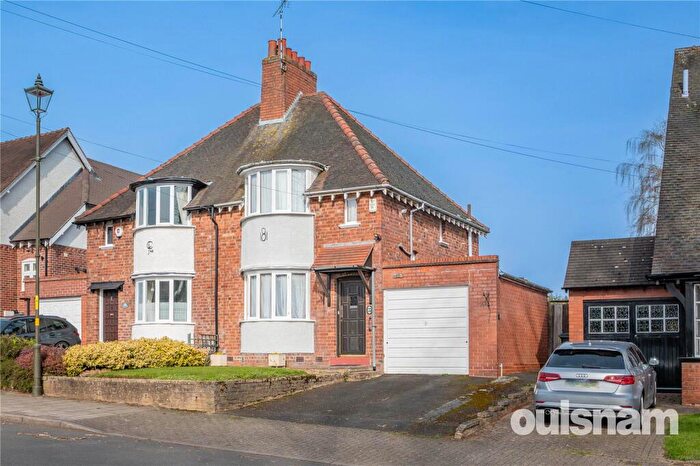
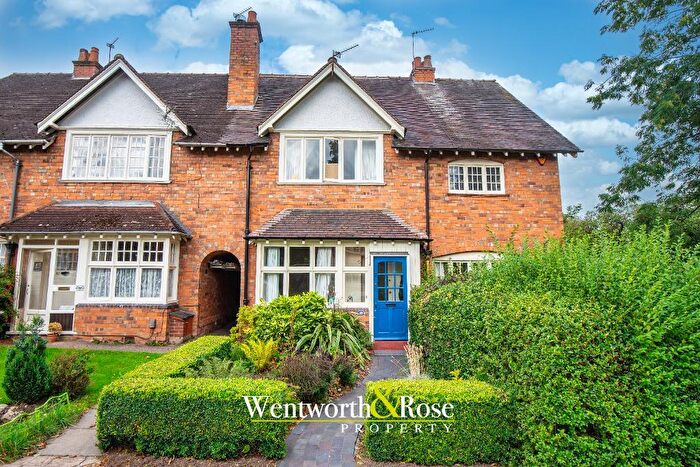
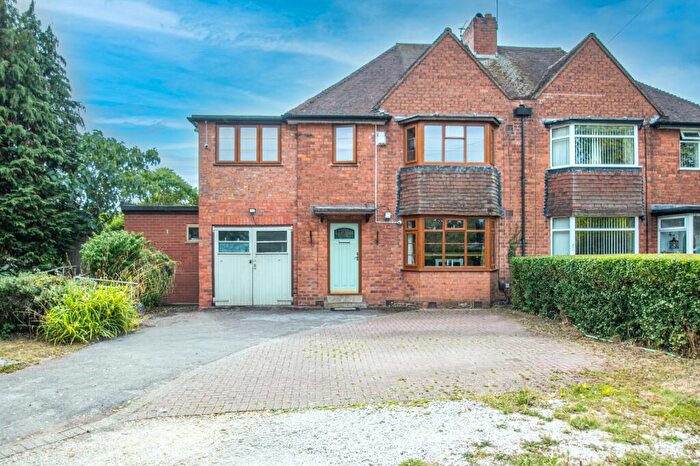
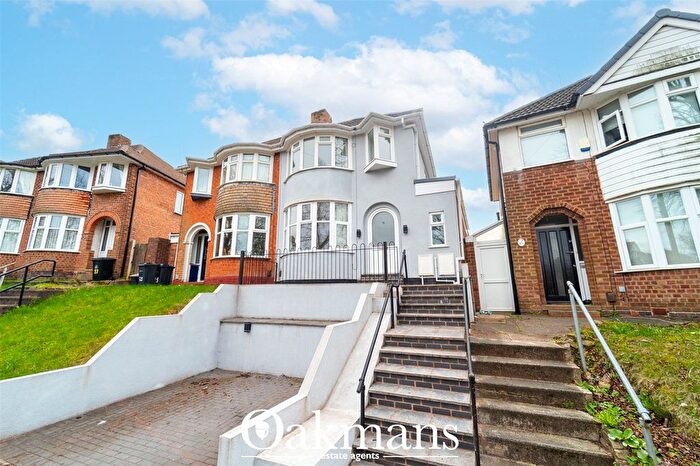
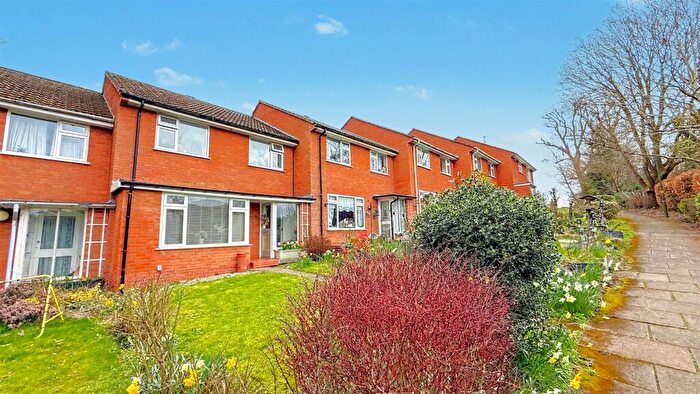
Properties for sale in Bournville & Cotteridge
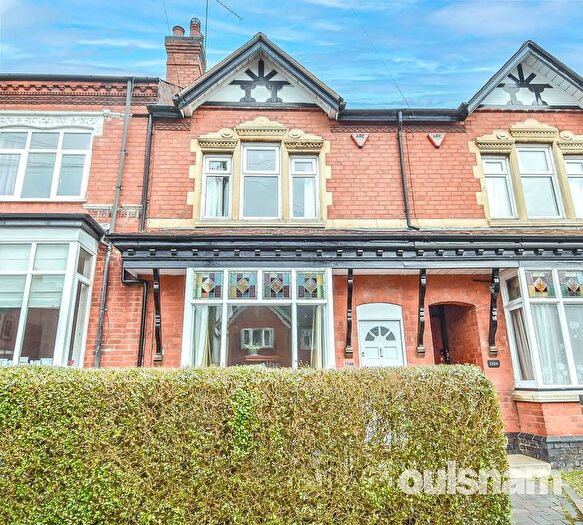
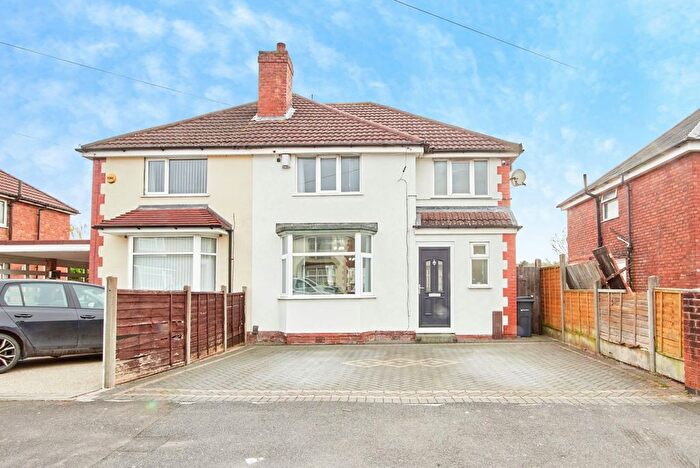
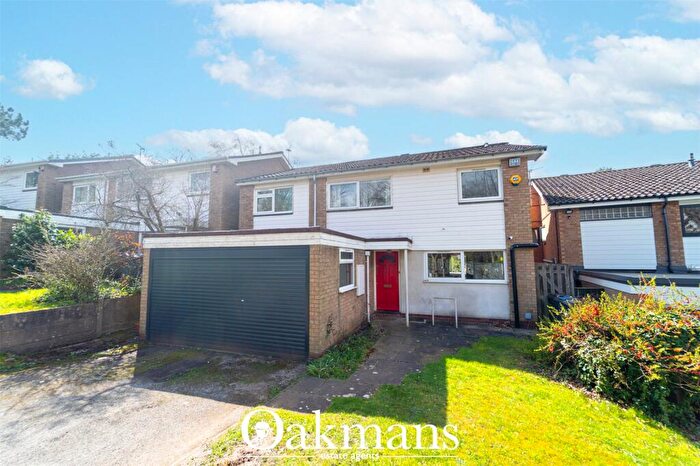
![]()
If you are looking to sell your house, let it out, or receive a property valuation, an expert can help you.
Click the button below to get started.
Roads and Postcodes in Bournville & Cotteridge
Navigate through our locations to find the location of your next house in Bournville & Cotteridge, Birmingham for sale or to rent.
Transport near Bournville & Cotteridge
-
 Bournville Station
 -
King's Norton Station
-
Selly Oak Station
-
University Station
-
Northfield Station
-
Longbridge Station
- FAQ
- Price Paid By Year
- Property Type Price
Frequently asked questions about Bournville & Cotteridge
What is the average price for a property for sale in Bournville & Cotteridge?
The average price for a property for sale in Bournville & Cotteridge is £265,355. This amount is 12% higher than the average price in Birmingham. There are 4,492 property listings for sale in Bournville & Cotteridge.
What streets have the most expensive properties for sale in Bournville & Cotteridge?
The streets with the most expensive properties for sale in Bournville & Cotteridge are Woodlands Drive at an average of £620,000, Boundary View at an average of £535,000 and Hay Green Lane at an average of £364,500.
What streets have the most affordable properties for sale in Bournville & Cotteridge?
The streets with the most affordable properties for sale in Bournville & Cotteridge are Elliott Road at an average of £110,250, ESCELIE WAY at an average of £169,875 and Raddlebarn Place at an average of £195,000.
Which train stations are available in or near Bournville & Cotteridge?
Some of the train stations available in or near Bournville & Cotteridge are Bournville, King's Norton and Selly Oak.
Property Price Paid in Bournville & Cotteridge by Year
The average sold property price by year was:
| Year | Average Sold Price | Price Change |
Sold Properties
|
|---|---|---|---|
| 2025 | £233,282 | -14% |
23 Properties |
| 2024 | £266,958 | -8% |
31 Properties |
| 2023 | £287,548 | 2% |
31 Properties |
| 2022 | £281,174 | 11% |
35 Properties |
| 2021 | £250,854 | -6% |
57 Properties |
| 2020 | £264,733 | 24% |
49 Properties |
| 2019 | £200,768 | -2% |
69 Properties |
| 2018 | £205,443 | -58% |
100 Properties |
| 2017 | £324,736 | 22% |
86 Properties |
| 2016 | £252,424 | 10% |
193 Properties |
| 2015 | £227,495 | -151% |
6 Properties |
| 2014 | £570,000 | 61% |
1 Property |
| 2006 | £225,000 | 60% |
1 Property |
| 2002 | £90,000 | - |
1 Property |
Property Price per Property Type in Bournville & Cotteridge
Here you can find historic sold price data in order to help with your property search.
The average Property Paid Price for specific property types in the last three years are:
| Property Type | Average Sold Price | Sold Properties |
|---|---|---|
| Flat | £187,733.00 | 34 Flats |
| Semi Detached House | £330,129.00 | 27 Semi Detached Houses |
| Terraced House | £276,306.00 | 22 Terraced Houses |
| Detached House | £590,000.00 | 2 Detached Houses |