
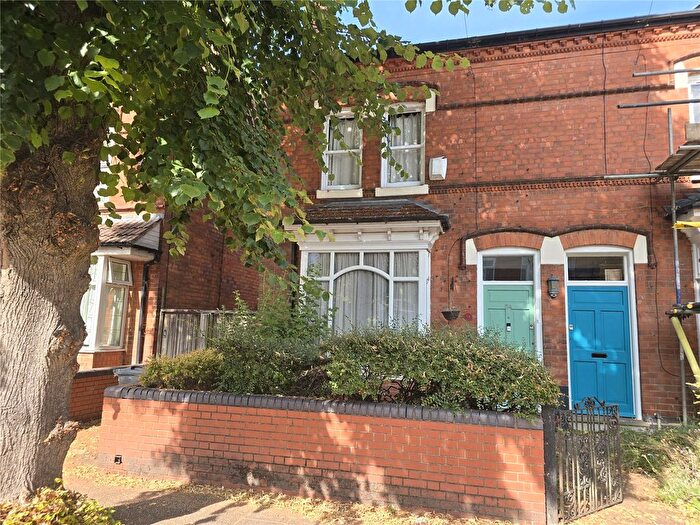
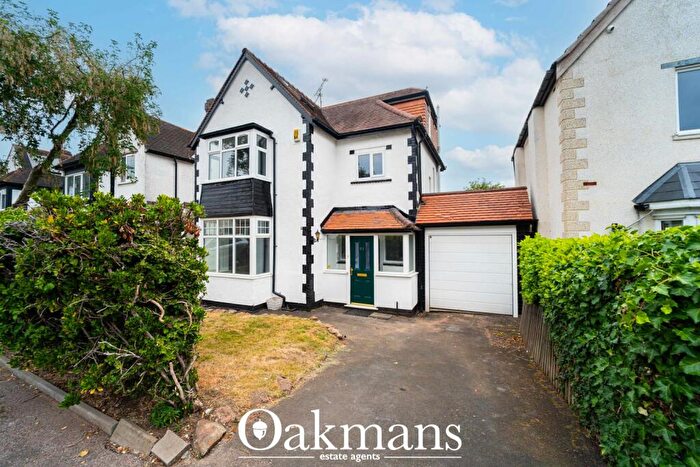
Houses for sale in Birmingham, Birmingham
House Prices in Birmingham
Properties in Birmingham have an average house price of £237k and had 27,538 Property Transactions within the last 3 years.¹
Birmingham is an area in Birmingham with 384,878 households², where the most expensive property was sold for £5.11M.
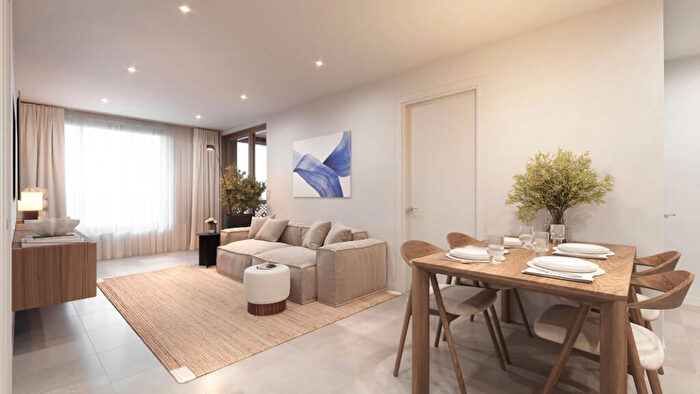
Properties for sale in Birmingham


![]()
If you are looking to sell your house, let it out, or receive a property valuation, an expert can help you.
Click the button below to get started.


Neighbourhoods in Birmingham
Navigate through our locations to find the location of your next house in Birmingham, Birmingham for sale or to rent.
- Cofton
- Acocks Green
- Aston
- Bartley Green
- Billesley
- Bordesley Green
- Bournville
- Brandwood
- Edgbaston
- Erdington
- Hall Green
- Handsworth Wood
- Harborne
- Hodge Hill
- Kings Norton
- Kingstanding
- Ladywood
- Longbridge
- Lozells And East Handsworth
- Moseley And Kings Heath
- Nechells
- Northfield
- Oscott
- Perry Barr
- Quinton
- Selly Oak
- Shard End
- Sheldon
- Soho
- South Yardley
- Sparkbrook
- Springfield
- Stechford And Yardley North
- Stockland Green
- Sutton Vesey
- Tyburn
- Washwood Heath
- Weoley
- Garretts Green
- Bordesley & Highgate
- Soho & Jewellery Quarter
- Sparkbrook & Balsall Heath East
- Small Heath
- Heartlands
- Tyseley & Hay Mills
- Sparkhill
- Hall Green North
- Balsall Heath West
- Moseley
- Highter's Heath
- Brandwood & King's Heath
- Druids Heath & Monyhull
- Bournbrook & Selly Park
- North Edgbaston
- Lozells
- Handsworth
- Holyhead
- Perry Common
- Gravelly Hill
- Pype Hayes
- Yardley West & Stechford
- Yardley East
- Hall Green South
- Weoley & Selly Oak
- Allens Cross
- Bournville & Cotteridge
- Stirchley
- King's Norton North
- King's Norton South
- Longbridge & West Heath
- Barnt Green & Hopwood
- Frankley Great Park
- Belbroughton & Romsley
- Glebe Farm & Tile Cross
- Bromford & Hodge Hill
- Castle Vale
- Rubery & Rednal
- Sutton Mere Green
- Ward End
- Alum Rock
- Newtown
- Birchfield
Property price trends in Birmingham
According to the latest Land Registry data, the average home in Birmingham sold for £248,696 in 2026. That figure comes from a substantial record of 380,835 sales logged over the past 31 years.
Prices have continued to climb over the last three years. Compared with 2023, when the typical sale came in around £232,134, that's a rise of roughly 7.1%.
Looking back five years, average prices are up about 11.6% since 2021, a gain of around £25,879 in cash terms.
Zoom out to the past decade for the fuller picture. Back in 2016, homes here averaged £167,123, so the typical sold price has climbed about 48.8% since then, roughly 4.1% a year. Stretch the view to fifteen years and that annual pace holds at about 3.9%.
Frequently asked questions about Birmingham
What is the average price for a property for sale in Birmingham?
The average price for a property for sale in Birmingham is £236,622. This amount is 8% lower than the average price in Birmingham. There are more than 10,000 property listings for sale in Birmingham.
What locations have the most expensive properties for sale in Birmingham?
The locations with the most expensive properties for sale in Birmingham are Ward End at an average of £500,000, Rubery & Rednal at an average of £431,000 and Edgbaston at an average of £405,073.
What locations have the most affordable properties for sale in Birmingham?
The locations with the most affordable properties for sale in Birmingham are Alum Rock at an average of £28,200, Nechells at an average of £164,205 and Washwood Heath at an average of £168,098.
Which train stations are available in or near Birmingham?
Some of the train stations available in or near Birmingham are Birmingham Bordesley, Birmingham Moor Street and Birmingham New Street.
Property Price Paid in Birmingham by Year
The average sold property price by year was:
| Year | Average Sold Price | Price Change |
Sold Properties
|
|---|---|---|---|
| 2026 | £248,696 | 3% |
614 Properties |
| 2025 | £241,977 | 3% |
8,552 Properties |
| 2024 | £235,250 | 1% |
9,384 Properties |
| 2023 | £232,134 | -1% |
8,988 Properties |
| 2022 | £234,315 | 5% |
11,087 Properties |
| 2021 | £222,817 | 8% |
12,483 Properties |
| 2020 | £203,932 | 4% |
9,899 Properties |
| 2019 | £195,987 | 3% |
12,789 Properties |
| 2018 | £190,377 | 4% |
13,343 Properties |
| 2017 | £182,090 | 8% |
12,587 Properties |
Property Price per Property Type in Birmingham
Here you can find historic sold price data in order to help with your property search.
The average Property Paid Price for specific property types in the last three years are:
| Property Type | Average Sold Price | Sold Properties |
|---|---|---|
| Semi Detached House | £261,533.00 | 9,473 Semi Detached Houses |
| Terraced House | £217,887.00 | 11,556 Terraced Houses |
| Detached House | £453,193.00 | 1,743 Detached Houses |
| Flat | £153,332.00 | 4,766 Flats |
Transport in Birmingham
Please see below transportation links in this area:
