
Houses for sale in Birmingham, England
House Prices in Birmingham
Properties in Birmingham have
an average house price of
£257k
and had 33,881 Property Transactions
within the last 3 years.¹
Birmingham is a location in
England with
425,282 households², where the most expensive property was sold for £5.11M.
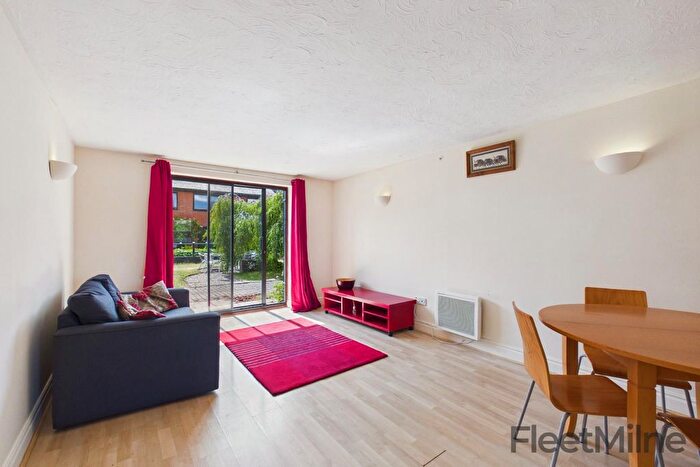
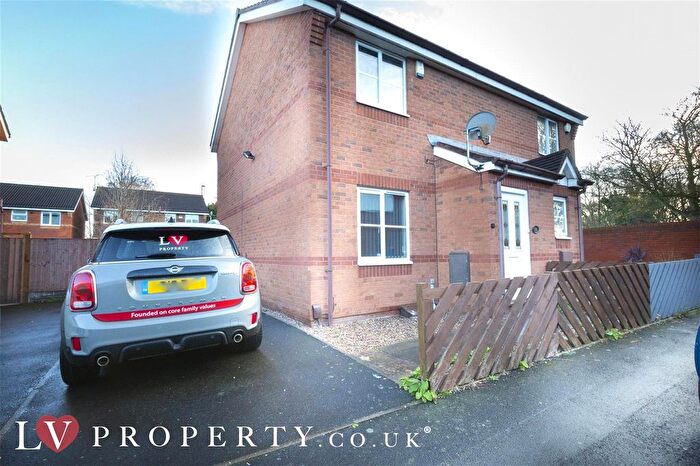
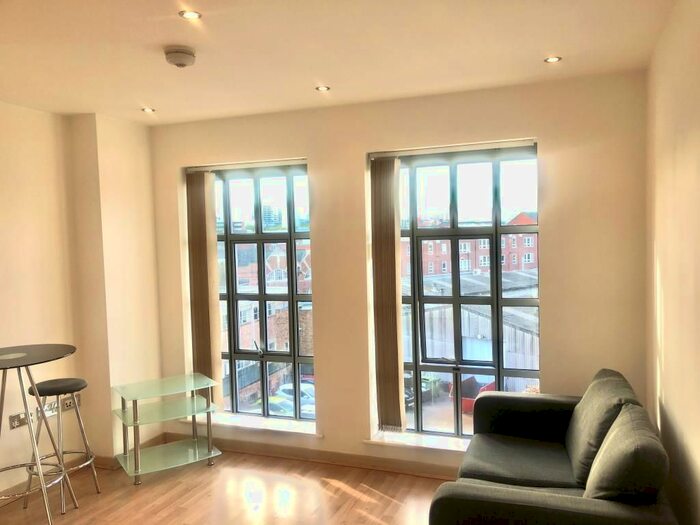
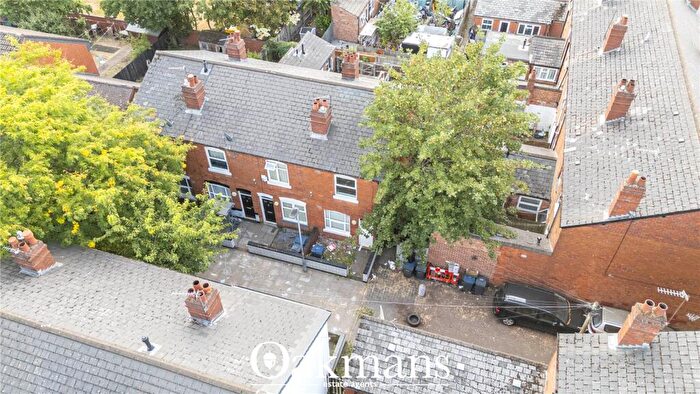
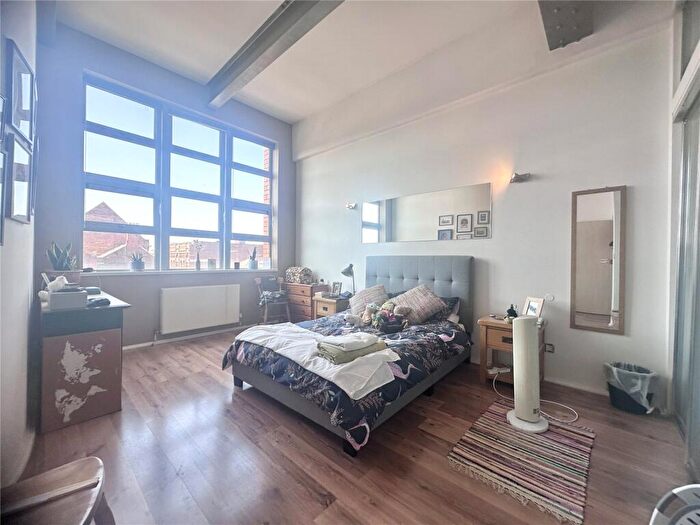
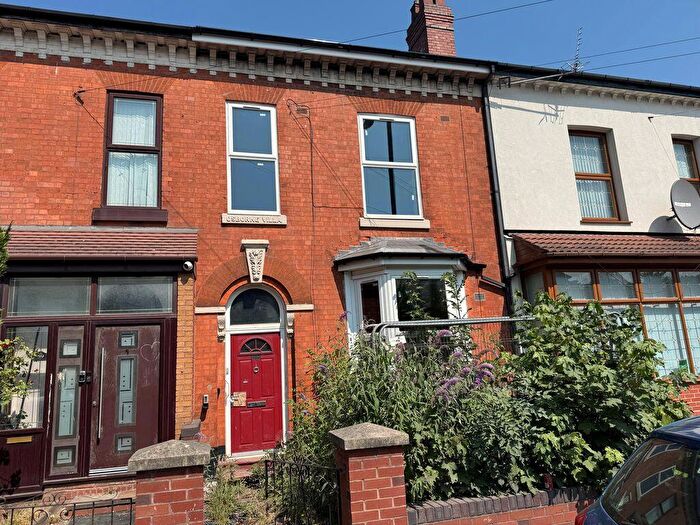
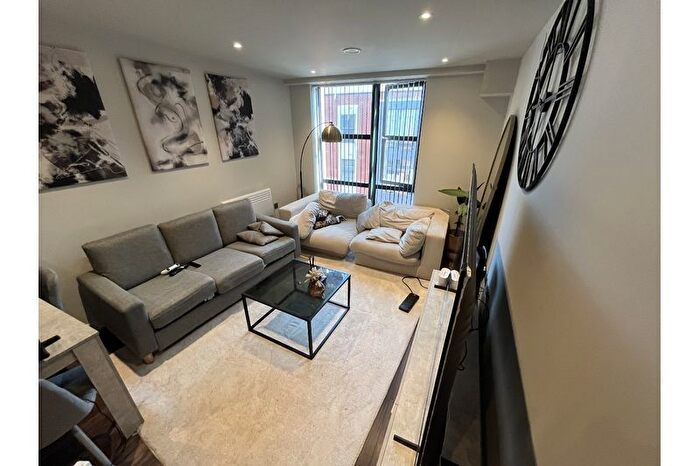
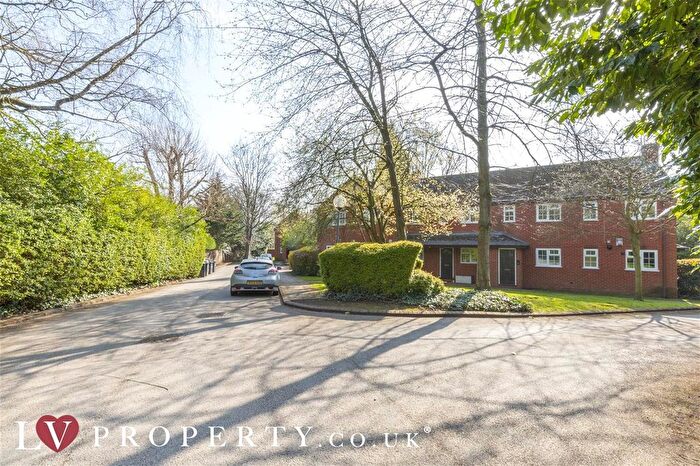
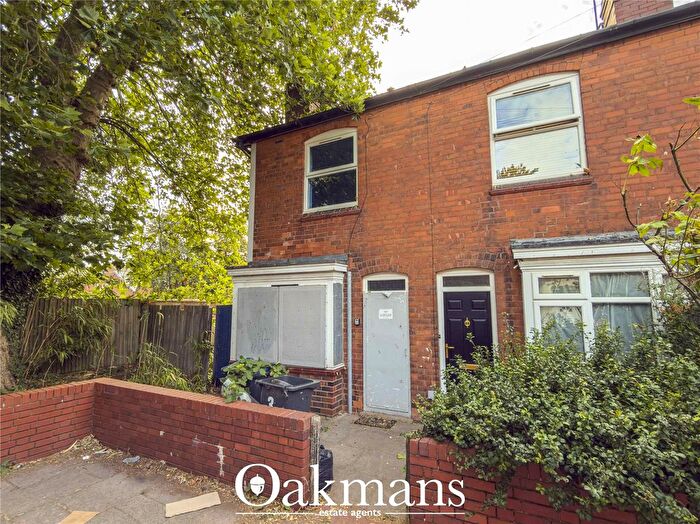
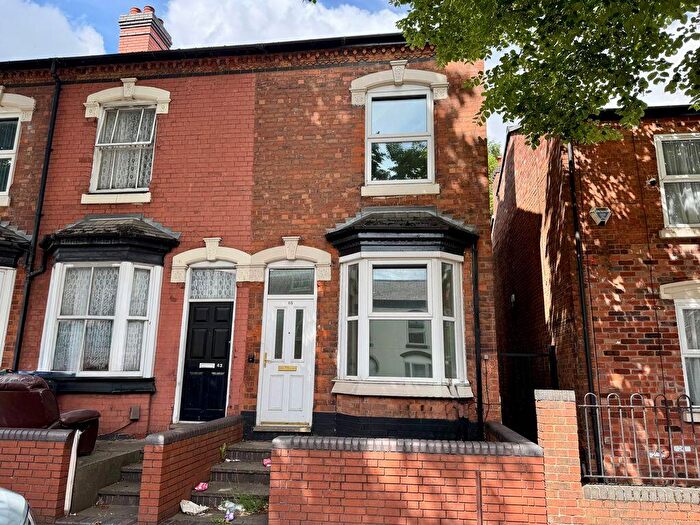
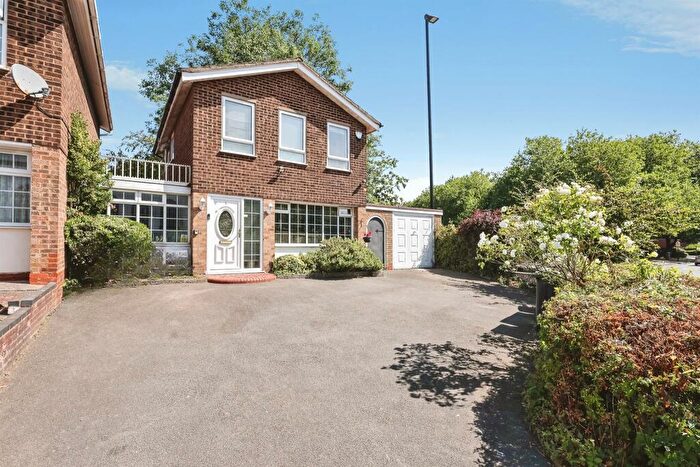
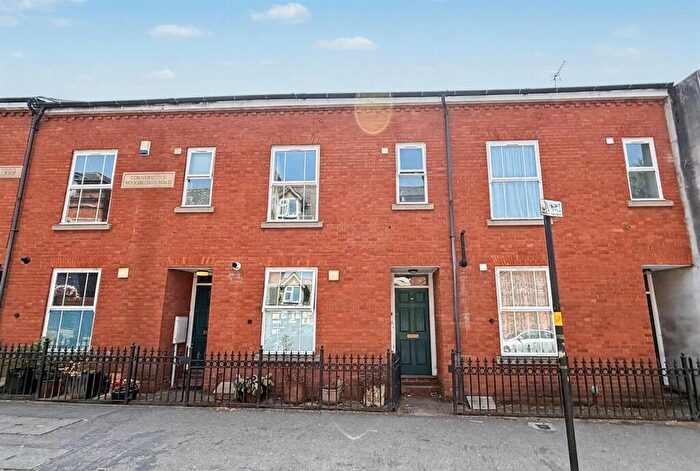
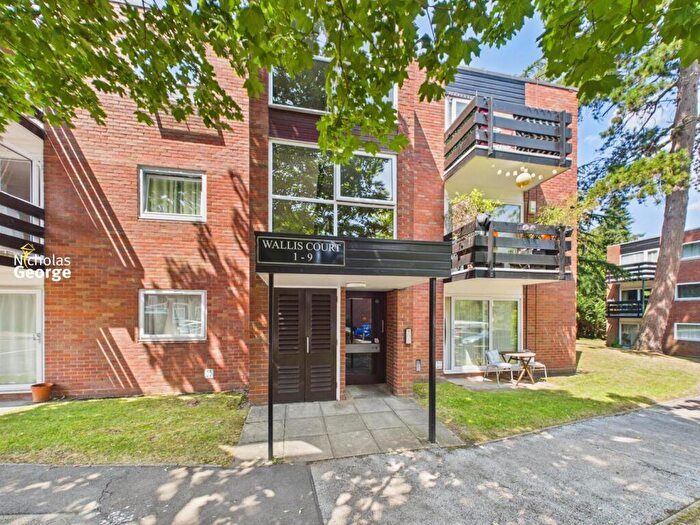
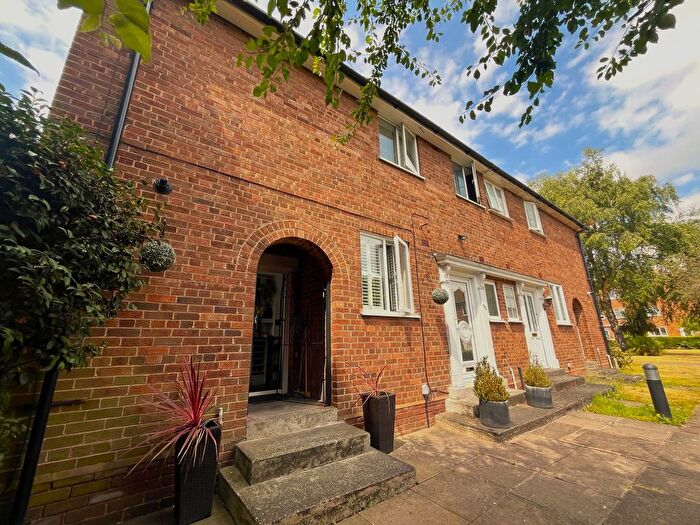
Properties for sale in Birmingham
![]()
If you are looking to sell your house, let it out, or receive a property valuation, an expert can help you.
Click the button below to get started.


Towns in Birmingham
Navigate through our locations to find the location of your next house in Birmingham, England for sale or to rent.
Property price trends in Birmingham
According to the latest Land Registry data, the average home in Birmingham sold for £264,556 in 2026. That figure comes from a substantial record of 439,351 sales logged over the past 31 years.
Prices have moved up over the last three years. Compared with 2023, when the typical sale came in around £251,234, that's a rise of roughly 5.3%.
Looking back five years, average prices are up about 8.6% since 2021, a gain of around £20,864 in cash terms.
Zoom out to the past decade for the fuller picture. Back in 2016, homes here averaged £182,284, so the typical sold price has climbed about 45.1% since then, roughly 3.8% a year. Stretch the view to fifteen years and that annual pace holds at about 3.7%.
Frequently asked questions about Birmingham
What is the average price for a property for sale in Birmingham?
The average price for a property for sale in Birmingham is £256,870. This amount is 28% lower than the average price in England. There are more than 10,000 property listings for sale in Birmingham.
What locations have the most expensive properties for sale in Birmingham?
The locations with the most expensive properties for sale in Birmingham are Sutton Coldfield at an average of £392,539 and Halesowen at an average of £271,331.
What locations have the most affordable properties for sale in Birmingham?
The location with the most affordable properties for sale in Birmingham is Birmingham at an average of £236,622.
Which train stations are available in or near Birmingham?
Some of the train stations available in or near Birmingham are Birmingham Moor Street, Birmingham Bordesley and Birmingham New Street.
Property Price Paid in Birmingham by Year
The average sold property price by year was:
| Year | Average Sold Price | Price Change |
Sold Properties
|
|---|---|---|---|
| 2026 | £264,556 | 1% |
2,012 Properties |
| 2025 | £261,577 | 2% |
10,814 Properties |
| 2024 | £256,069 | 2% |
10,815 Properties |
| 2023 | £251,234 | -1% |
10,240 Properties |
| 2022 | £253,455 | 4% |
12,692 Properties |
| 2021 | £243,692 | 9% |
14,594 Properties |
| 2020 | £222,675 | 6% |
11,267 Properties |
| 2019 | £209,875 | 2% |
14,404 Properties |
| 2018 | £205,569 | 4% |
15,143 Properties |
| 2017 | £196,877 | 7% |
14,303 Properties |
Property Price per Property Type in Birmingham
Here you can find historic sold price data in order to help with your property search.
The average Property Paid Price for specific property types in the last three years are:
| Property Type | Average Sold Price | Sold Properties |
|---|---|---|
| Semi Detached House | £275,153.00 | 11,581 Semi Detached Houses |
| Terraced House | £222,284.00 | 13,069 Terraced Houses |
| Detached House | £512,202.00 | 3,294 Detached Houses |
| Flat | £155,674.00 | 5,937 Flats |
Transport in Birmingham
Please see below transportation links in this area:
