
Houses for sale & to rent in Castle Vale, Birmingham
House Prices in Castle Vale
Properties in Castle Vale have an average house price of £221k and had 8 Property Transactions within the last 3 years¹.
Castle Vale is an area in Birmingham, Birmingham with 1,188 households², where the most expensive property was sold for £260k.
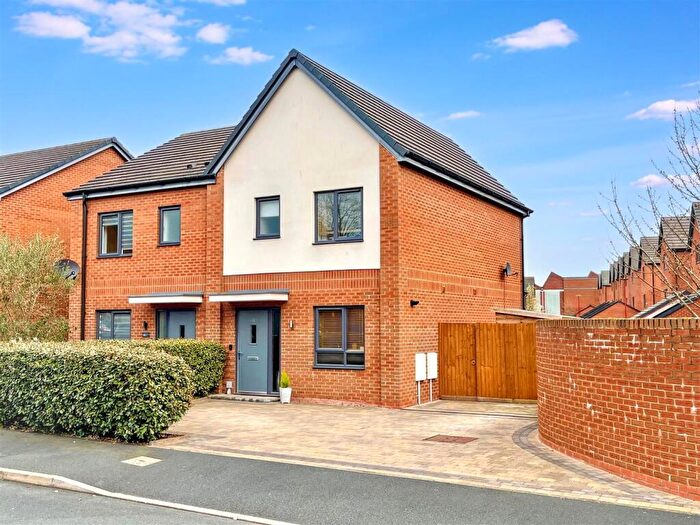
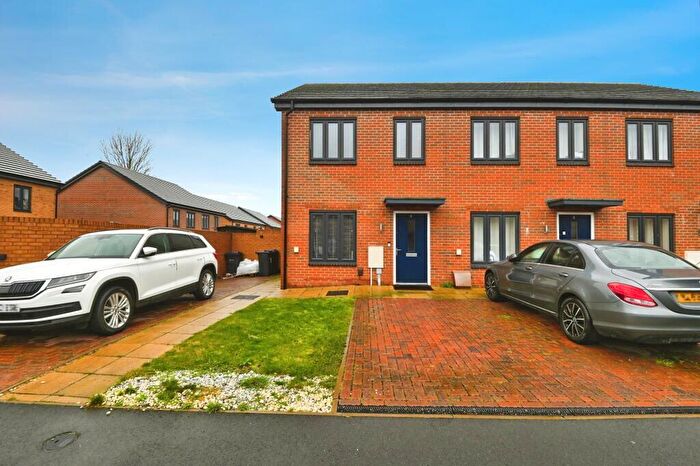
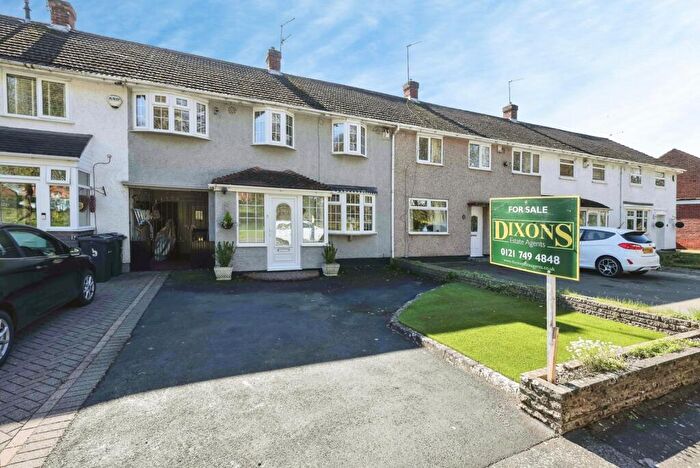
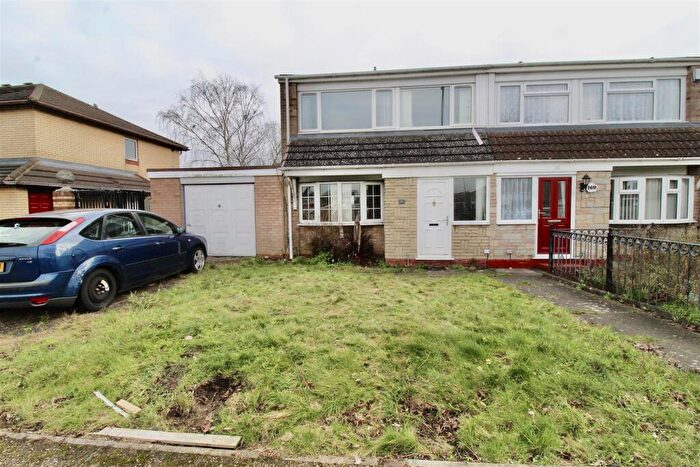
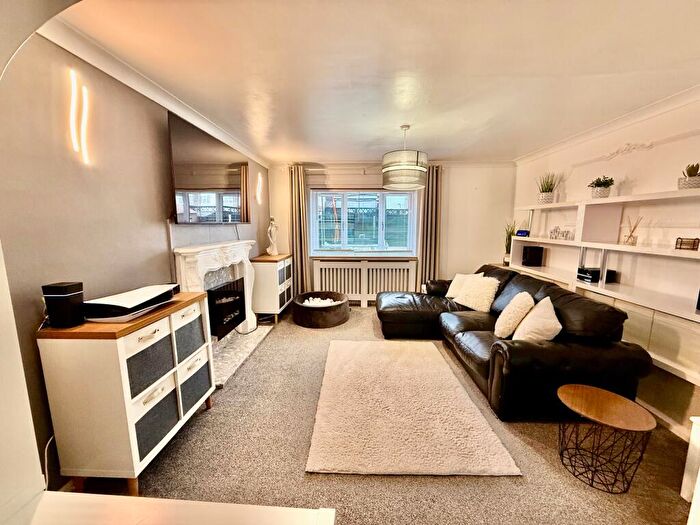
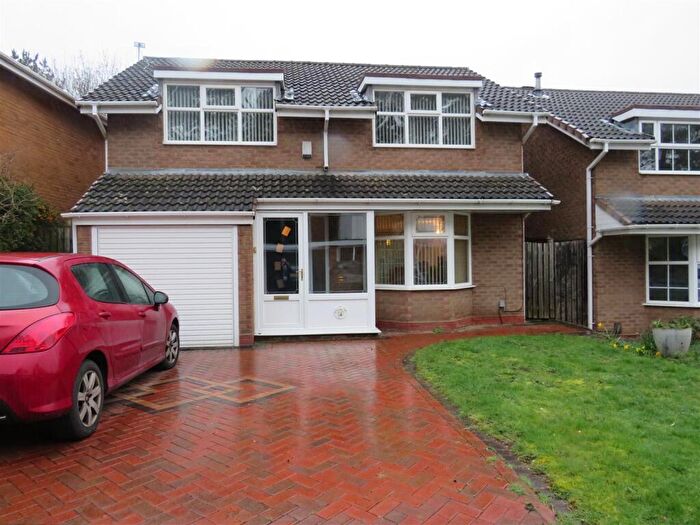
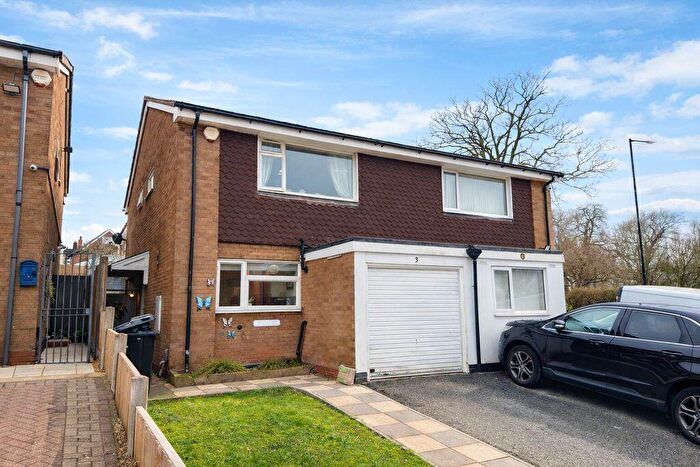
Properties for sale in Castle Vale
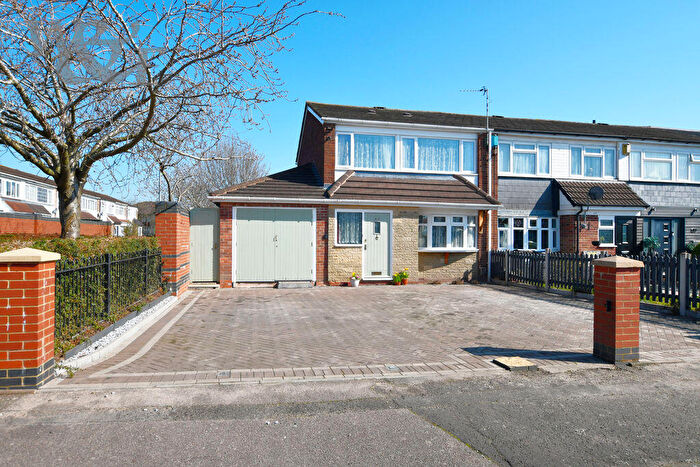
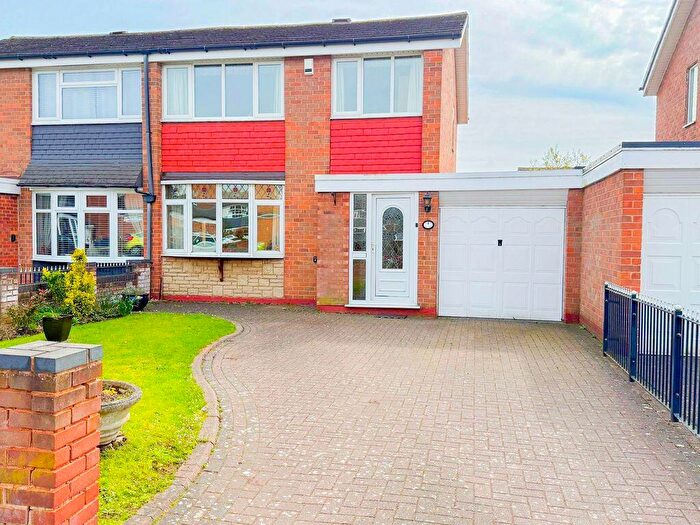

![]()
If you are looking to sell your house, let it out, or receive a property valuation, an expert can help you.
Click the button below to get started.
Roads and Postcodes in Castle Vale
Navigate through our locations to find the location of your next house in Castle Vale, Birmingham for sale or to rent.
| Streets | Postcodes |
|---|---|
| Abingdon Way | B35 6QF |
| Avro Way | B35 7NW |
| Bader Walk | B35 7HA |
| Baginton Road | B35 6JE B35 6JS |
| Bicester Square | B35 6HS |
| Blenheim Way | B35 7JF |
| Bond Drive | B35 7QQ |
| Bovingdon Road | B35 6QD |
| Cadbury Drive | B35 7EX |
| Castle Vale Retail Park | B35 6HB |
| Chester Road | B35 7ED |
| Chigwell Close | B35 7HH |
| Clayton Walk | B35 7DF |
| Coltishall Close | B35 7EF |
| Concorde Drive | B35 7EE |
| Corbett Boulevard | B35 7DZ |
| Cosford Crescent | B35 6QE |
| Cranwell Way | B35 6QH |
| Dehavilland Drive | B35 7FP |
| Donibristle Croft | B35 6BL |
| Drem Croft | B35 7HW B35 7HY |
| Ellis Crescent | B35 7BU |
| Farnborough Road | B35 7JA B35 7LQ B35 7PA B35 7PD |
| Halfpenny Field Walk | B35 7HX |
| Hawker Drive | B35 7DX |
| Hawkinge Drive | B35 6BS B35 6BT |
| Hurricane Way | B35 7FW |
| Innsworth Drive | B35 6BD |
| Jackson Walk | B35 7ES |
| Kemble Drive | B35 6QS |
| Kenrick Croft | B35 7DN |
| Kingsbury Road | B35 6AJ |
| Lancaster Drive | B35 7JX |
| Langley Drive | B35 7AD |
| Longcroft Close | B35 7QS |
| Manby Road | B35 6HE |
| Mere Avenue | B35 6QT |
| Merlin Close | B35 7JW |
| Mitchell Avenue | B35 7DU |
| Neville Walk | B35 7JH |
| Northolt Drive | B35 6QX |
| Oakington Drive | B35 7HQ |
| Orton Way | B35 7BT |
| Park Lane | B35 6AN B35 6LJ B35 6LS |
| Pioneer Way | B35 7LA |
| Pixhall Walk | B35 7FE |
| Ruislip Close | B35 6JN |
| School Close | B35 7NU B35 7BF |
| Shawberry Avenue | B35 6QU |
| Squadron Close | B35 7PF |
| St Athan Croft | B35 7LR |
| St Cuthberts Place | B35 7PL |
| Stornoway Road | B35 6PD |
| Tameside Drive | B35 7AB B35 7AG B35 7AQ B35 7XX |
| Tangmere Drive | B35 6EE B35 7QW |
| Tangmere Square | B35 6DL |
| Upavon Close | B35 6BG |
| Viscount Close | B35 7JQ |
| Viscount Drive | B35 7JZ |
| Wadsworth Knoll | B35 7DR |
| Watton Green | B35 7GA B35 7JT |
| Wellington Way | B35 7JU |
| Westland Walk | B35 7QN |
| Whittle Croft | B35 6DN |
| Yatesbury Avenue | B35 6DW B35 6LA B35 6LB B35 6QG B35 6QP B35 6QR |
| B35 9DE B35 9DQ B35 9DT B35 9DY B35 9DZ B35 9EB B35 9ED B35 9EE B36 0HQ B36 0YP B36 8HX B36 8WA B36 8ZR B35 7DS B35 7DW B35 9EH B35 9EN B35 9EP B35 9ES |
Transport near Castle Vale
-
 Water Orton Station
 -
Chester Road Station
-
Erdington Station
-
Stechford Station
-
Lea Hall Station
-
Gravelly Hill Station
-
Wylde Green Station
- FAQ
- Price Paid By Year
- Property Type Price
Frequently asked questions about Castle Vale
What is the average price for a property for sale in Castle Vale?
The average price for a property for sale in Castle Vale is £220,875. This amount is 7% lower than the average price in Birmingham. There are 743 property listings for sale in Castle Vale.
What streets have the most expensive properties for sale in Castle Vale?
The streets with the most expensive properties for sale in Castle Vale are Lancaster Drive at an average of £250,000, Kemble Drive at an average of £220,000 and Whittle Croft at an average of £219,333.
What streets have the most affordable properties for sale in Castle Vale?
The streets with the most affordable properties for sale in Castle Vale are Neville Walk at an average of £207,000 and Farnborough Road at an average of £212,000.
Which train stations are available in or near Castle Vale?
Some of the train stations available in or near Castle Vale are Water Orton, Chester Road and Erdington.
Property Price Paid in Castle Vale by Year
The average sold property price by year was:
| Year | Average Sold Price | Price Change |
Sold Properties
|
|---|---|---|---|
| 2025 | £223,000 | 11% |
4 Properties |
| 2024 | £197,500 | -22% |
2 Properties |
| 2023 | £240,000 | 27% |
2 Properties |
| 2022 | £174,666 | -6% |
3 Properties |
| 2021 | £186,000 | 17% |
1 Property |
| 2020 | £155,000 | 21% |
2 Properties |
| 2019 | £122,900 | -17% |
5 Properties |
| 2018 | £144,000 | 17% |
2 Properties |
| 2017 | £118,916 | 7% |
3 Properties |
| 2016 | £110,250 | 1% |
2 Properties |
| 2015 | £109,375 | 22% |
4 Properties |
| 2013 | £85,000 | 9% |
1 Property |
| 2012 | £77,000 | - |
1 Property |
Property Price per Property Type in Castle Vale
Here you can find historic sold price data in order to help with your property search.
The average Property Paid Price for specific property types in the last three years are:
| Property Type | Average Sold Price | Sold Properties |
|---|---|---|
| Terraced House | £216,714.00 | 7 Terraced Houses |
| Semi Detached House | £250,000.00 | 1 Semi Detached House |