
Houses for sale & to rent in Moseley And Kings Heath, Birmingham
House Prices in Moseley And Kings Heath
Properties in Moseley And Kings Heath have an average house price of £349k and had 837 Property Transactions within the last 3 years¹.
Moseley And Kings Heath is an area in Birmingham, Birmingham with 10,636 households², where the most expensive property was sold for £1.48M.
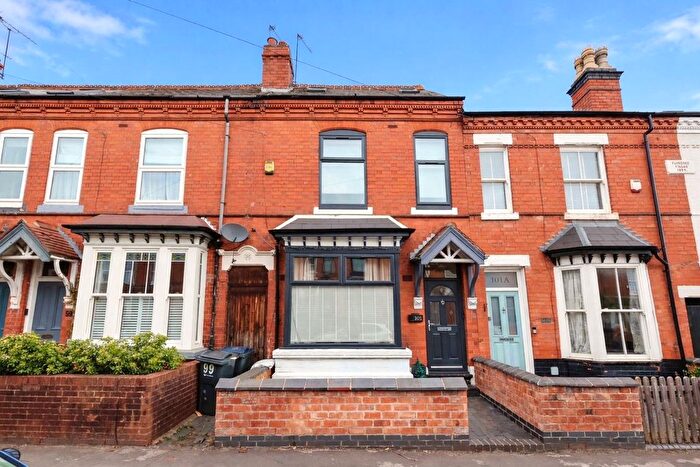
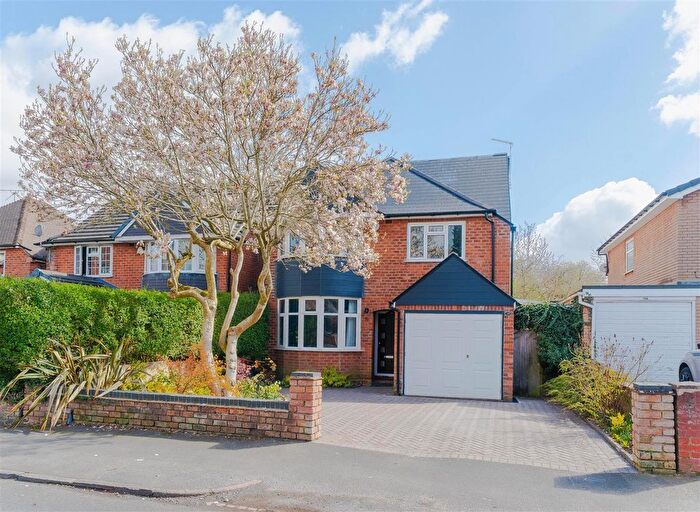
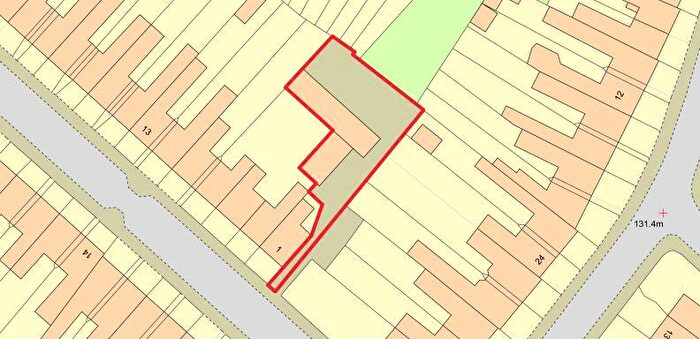
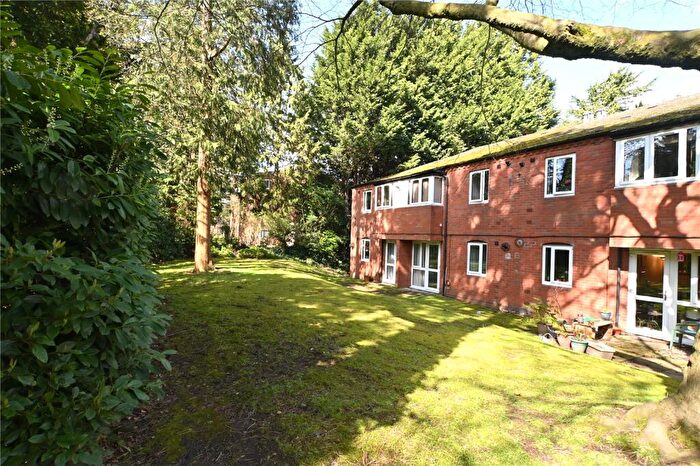
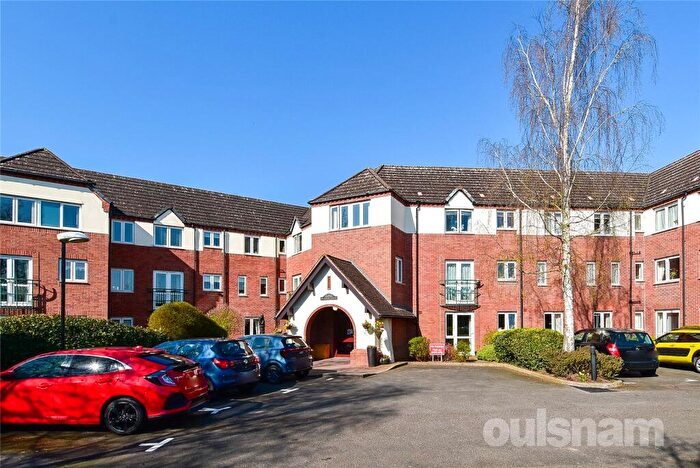
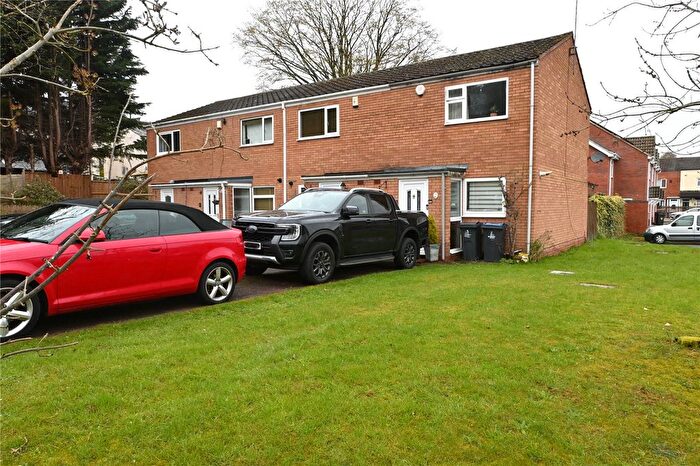
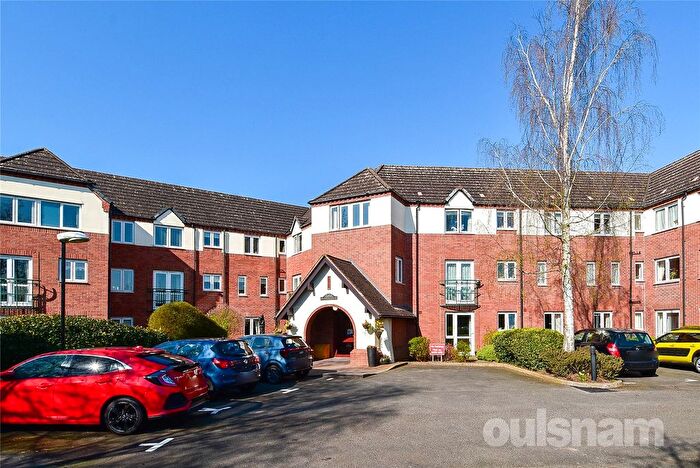
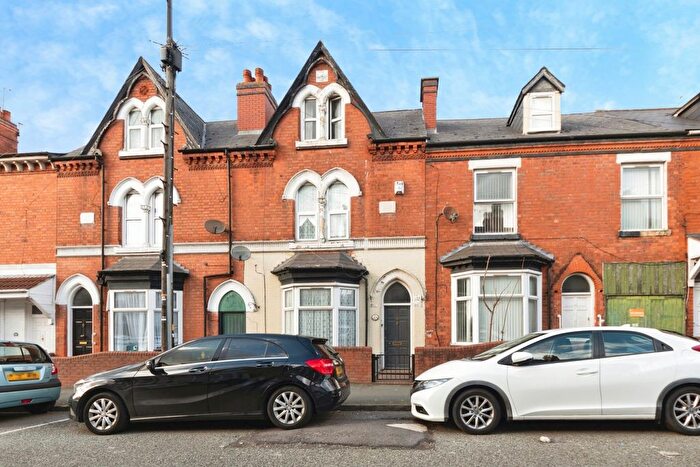
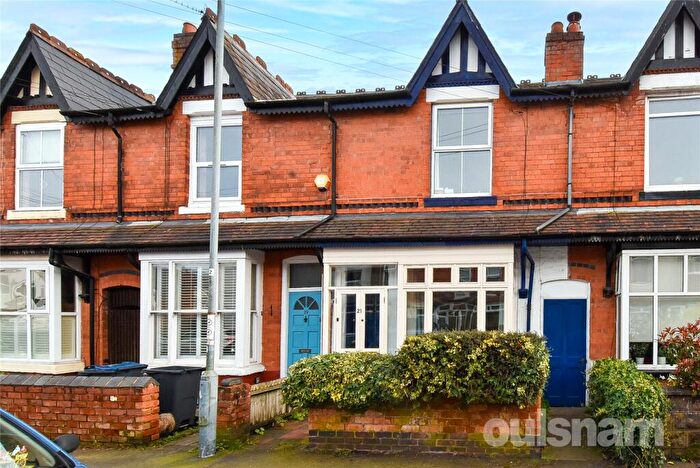
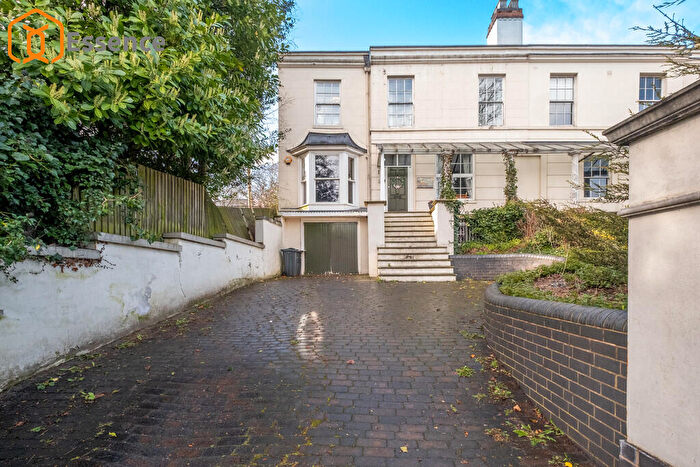
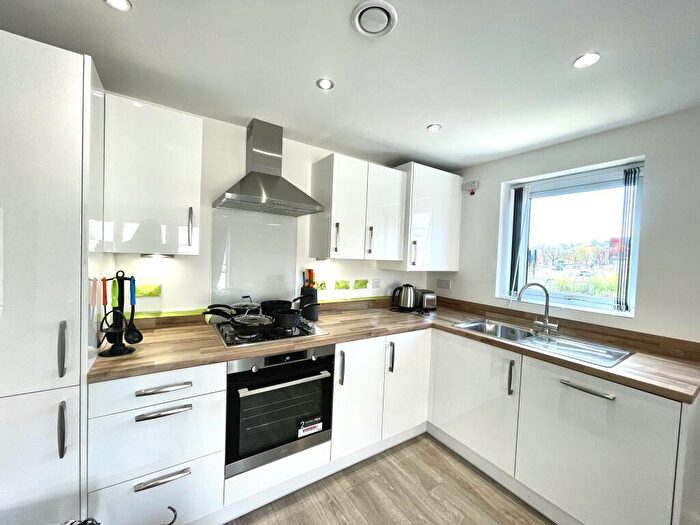
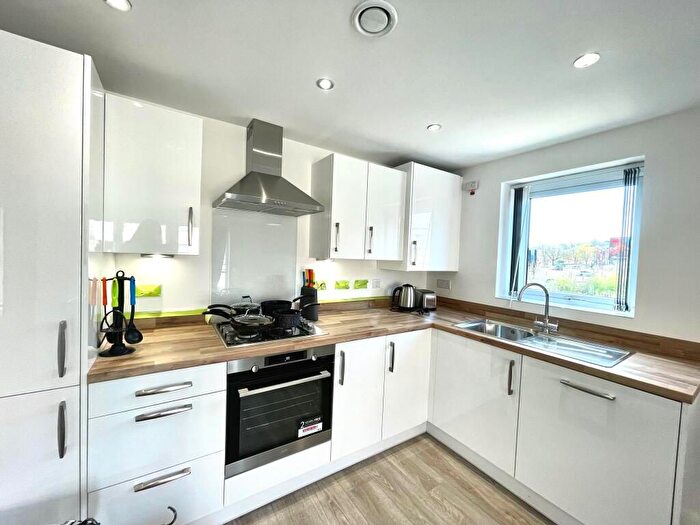
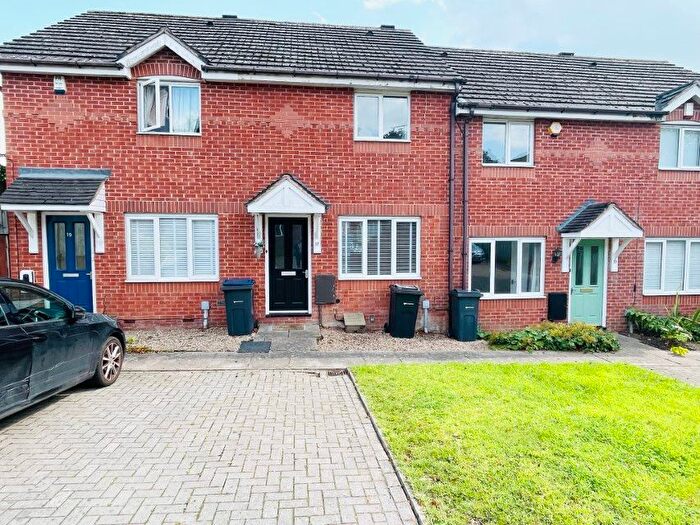
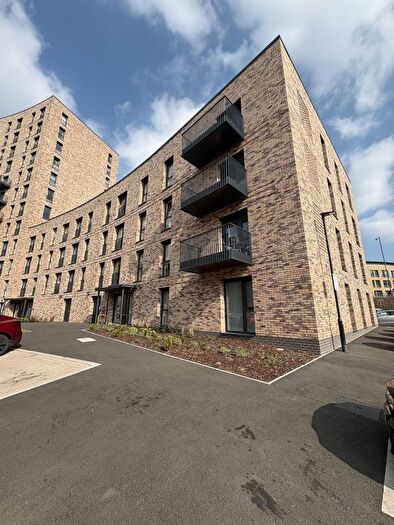
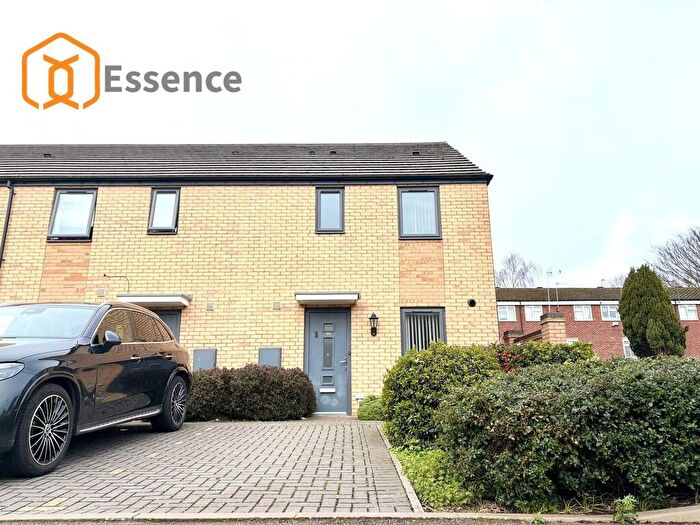
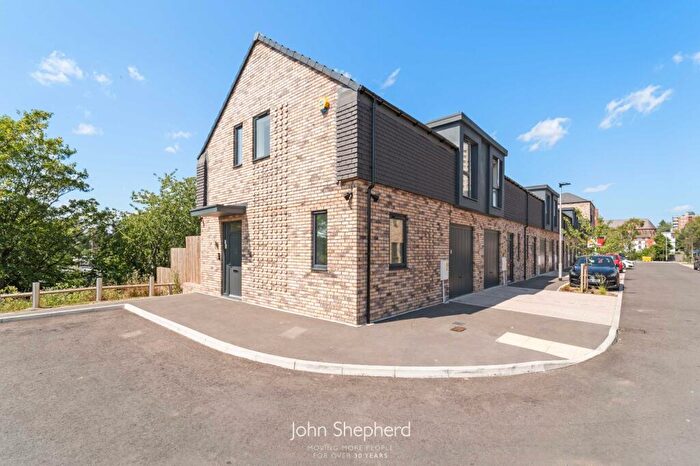
Properties for sale in Moseley And Kings Heath

![]()
If you are looking to sell your house, let it out, or receive a property valuation, an expert can help you.
Click the button below to get started.


Roads and Postcodes in Moseley And Kings Heath
Navigate through our locations to find the location of your next house in Moseley And Kings Heath, Birmingham for sale or to rent.
Transport near Moseley And Kings Heath
-
 Hall Green Station
 -
Small Heath Station
-
Bournville Station
-
Yardley Wood Station
-
Selly Oak Station
-
Spring Road Station
-
Birmingham Bordesley Station
-
University Station
-
Tyseley Station
-
Five Ways Station
- FAQ
- Price Paid By Year
- Property Type Price
Frequently asked questions about Moseley And Kings Heath
What is the average price for a property for sale in Moseley And Kings Heath?
The average price for a property for sale in Moseley And Kings Heath is £349,132. This amount is 48% higher than the average price in Birmingham. There are 5,494 property listings for sale in Moseley And Kings Heath.
What streets have the most expensive properties for sale in Moseley And Kings Heath?
The streets with the most expensive properties for sale in Moseley And Kings Heath are Reddings Road at an average of £889,250, Ascot Road at an average of £876,000 and Dyott Road at an average of £760,300.
What streets have the most affordable properties for sale in Moseley And Kings Heath?
The streets with the most affordable properties for sale in Moseley And Kings Heath are Caroline Road at an average of £39,000, Woodnorton Drive at an average of £73,000 and Wake Green Park at an average of £122,876.
Which train stations are available in or near Moseley And Kings Heath?
Some of the train stations available in or near Moseley And Kings Heath are Hall Green, Small Heath and Bournville.
Property Price Paid in Moseley And Kings Heath by Year
The average sold property price by year was:
| Year | Average Sold Price | Price Change |
Sold Properties
|
|---|---|---|---|
| 2026 | £337,300 | -1% |
5 Properties |
| 2025 | £340,208 | -0,4% |
244 Properties |
| 2024 | £341,656 | -7% |
304 Properties |
| 2023 | £365,010 | 9% |
284 Properties |
| 2022 | £333,312 | -0,1% |
353 Properties |
| 2021 | £333,672 | 7% |
463 Properties |
| 2020 | £309,901 | 7% |
274 Properties |
| 2019 | £289,695 | 5% |
347 Properties |
| 2018 | £275,406 | -3% |
339 Properties |
| 2017 | £283,292 | 12% |
396 Properties |
| 2016 | £248,528 | 5% |
378 Properties |
| 2015 | £236,255 | 7% |
396 Properties |
| 2014 | £220,705 | -2% |
390 Properties |
| 2013 | £224,872 | 4% |
353 Properties |
| 2012 | £216,364 | -4% |
266 Properties |
| 2011 | £223,942 | -5% |
251 Properties |
| 2010 | £234,772 | 12% |
302 Properties |
| 2009 | £206,001 | -12% |
282 Properties |
| 2008 | £230,007 | 5% |
297 Properties |
| 2007 | £219,202 | 3% |
479 Properties |
| 2006 | £212,369 | 5% |
552 Properties |
| 2005 | £202,390 | 8% |
518 Properties |
| 2004 | £186,999 | 6% |
512 Properties |
| 2003 | £176,650 | 18% |
553 Properties |
| 2002 | £144,984 | 18% |
611 Properties |
| 2001 | £119,142 | 1% |
548 Properties |
| 2000 | £117,556 | 25% |
573 Properties |
| 1999 | £88,677 | 18% |
602 Properties |
| 1998 | £72,443 | 2% |
482 Properties |
| 1997 | £71,320 | 10% |
512 Properties |
| 1996 | £64,206 | -3% |
432 Properties |
| 1995 | £66,401 | - |
419 Properties |
Property Price per Property Type in Moseley And Kings Heath
Here you can find historic sold price data in order to help with your property search.
The average Property Paid Price for specific property types in the last three years are:
| Property Type | Average Sold Price | Sold Properties |
|---|---|---|
| Semi Detached House | £512,937.00 | 136 Semi Detached Houses |
| Detached House | £686,466.00 | 106 Detached Houses |
| Terraced House | £315,135.00 | 339 Terraced Houses |
| Flat | £167,453.00 | 256 Flats |